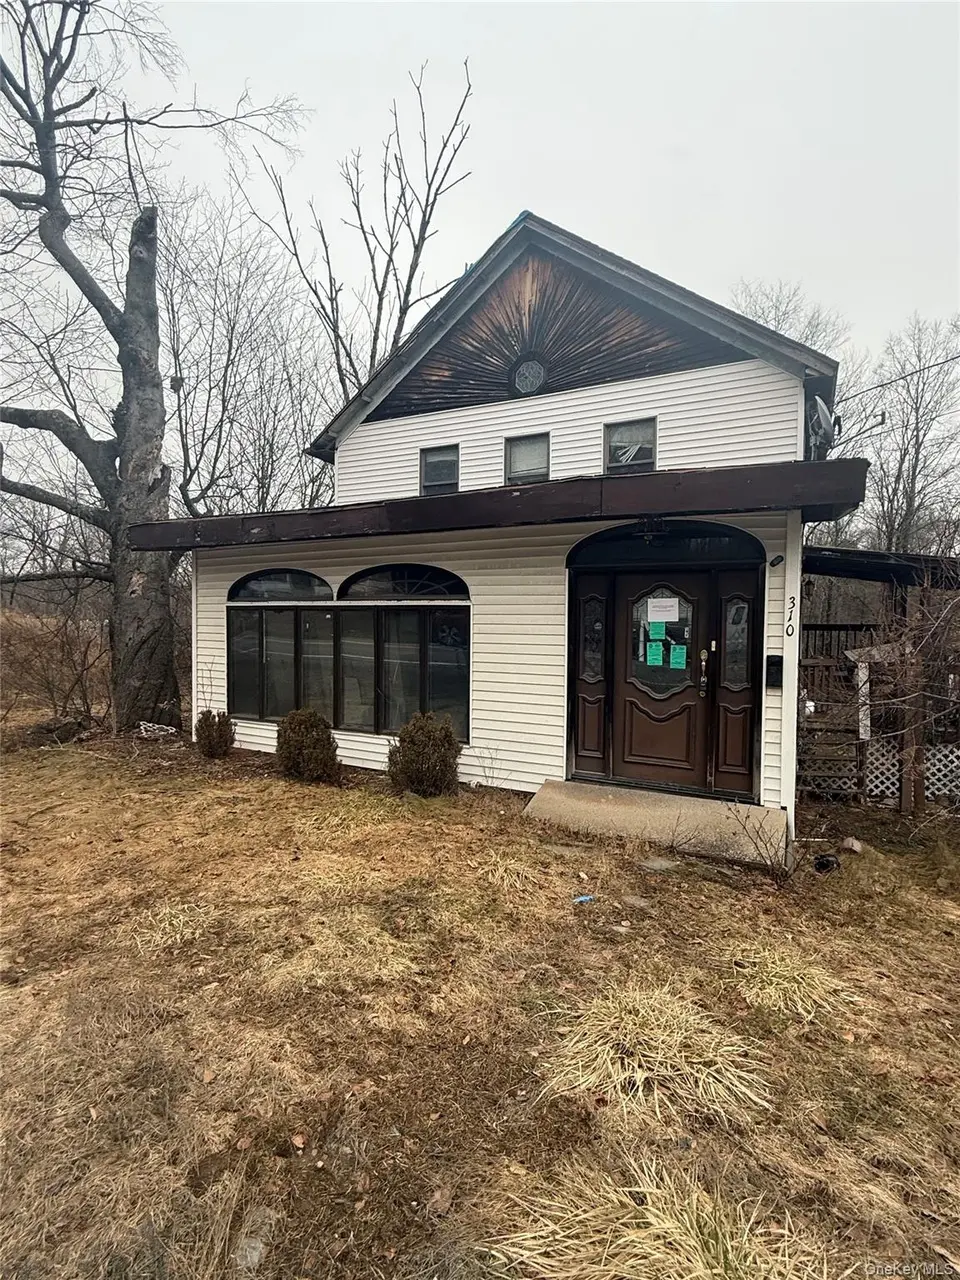
310 Main St · Hurleyville, NY
Flood risk 1/10 · Minimal
- FEMA flood zone
- X (unshaded)
- Chance of flooding over 30 yrs
- 0.0%
- Est. flood insurance / yr
- $473 – $860
Fire risk 2/10 · Minimal
- Est. fire insurance / yr
- $691 – $1,283
Heat risk 2/10 · Minimal
- Hot days now (above 91°F)
- 7 days/yr
- Hot days in 30 yrs
- 16 days/yr
Wind risk 3/10 · Minor
- Chance of severe wind over 30 yrs
- 5.0%
Air-quality risk 2/10 · Minimal
- Unhealthy air days now
- 1 days/yr
- Unhealthy air days in 30 yrs
- 1 days/yr
Risk factors via First Street. Map © Google.
Why this score? — see what drove the C+ grade
The composite is a weighted blend of 9 inputs, each scored 0–100. Each bar is that input's sub-score; the figure is the points it added to the 100-point composite (weight × sub-score).
- Cash flow +19.7/30.0
- Appreciation +10.0/10.0
- ARV discount +8.3/15.0
- 1% rule +7.6/10.0
- DSCR +6.2/10.0
- Rent growth +2.5/5.0
- Livability +2.5/5.0
- Condition / age +2.5/5.0
- Schools +2.4/10.0
$139,000
🖨 Deal sheet 📄 Offer letter ✓ Due diligence
Listing remarks MLS
Highest and best use: large family that needs all the bedrooms or an investor looking to do some clean up and repair and then collect rent. Set up as 4 bedroom, kitchen, bath and very large living room with an additional bedroom and kitchen, bath with separate entry below. New boiler and two new hot water tanks. See Agent's Remarks..... Additional Information: ParkingFeatures:2 Car Attached,
Key facts
- 0.26 acre lot
- 2 garage spots
- Built 1920
Neighborhood map
What this means for you Summary
Snapshot
- This is a 3-bed/2.0-bath single-family listed at $139k.
Deal economics
- At list price, monthly cash flow is $163 ($2k/yr) — positive.
- The deal already cash-flows at list — no discount required.
- Meets the 1% rule at list price ($2k rent vs $139k).
- Recommended offer: $137k (1.5% below list) — sets the bar for market timing.
Location & tenants
- Location reads: area grade C — affects rentability + tenant quality, not the cash-flow math above.
- Fallsburg Central School District (town): math 29% / reading 27% proficiency, ranked #583 of 590 in NY (top 99%) — low school quality limits family demand, transient renter base, plan for 1-2y turnover.
- Zoned schools: Benjamin Cosor Elementary School (math 8% / reading 22%, grade F, #2,024 of 2,108 statewide, top 97%, 810 students, 72% FRL); Fallsburg Junior Senior High School (math 52% / reading 32%, grade F, #1,046 of 1,100 statewide, top 96%, 684 students, 64% FRL).
- Market conditions: 21 active listings in the ZIP; 739 units permitted in Sullivan County in 2024 (5 in 5+ unit buildings).
Forward outlook
- In year one you build about $15k of equity ($961 loan paydown + $14k appreciation (10.0% local appreciation)).
- Sullivan County population projected at -24% by 2050 — secular population decline; favor cash flow + early exit over multi-decade hold.
- At projected returns (10.0% appreciation + 3.0% rent growth), your $39k cash investment doubles in ~3 years — after that, you're playing with house money.
- By year 3, paydown + projected appreciation supports a ~$38k cash-out refi (75% LTV) — recoverable capital for the next deal without selling this one.
Negotiation context
- It's been on market 19 days — a 2% lower offer ($137k) is reasonable based on typical stale-listing flexibility.
- 5 sale attempts since 15y ago with the ask held roughly flat each time — persistent listings suggest the price (not the market) is what's stuck; bring a comps-based counter.
- Current owner paid $33k; list at $139k implies a 321% gain — meaningful room to come down on a strong offer.
Risks & watch-outs
- Watch-outs: property tax is 3.7% of price; built in 1920 — expect roof / HVAC / electrical / plumbing capex.
Questions for the listing agent
- Built in 1920 — when were the roof, HVAC, electrical panel, plumbing, and water heater last replaced?
- Property tax is high relative to price — has the assessment been appealed recently, and will the sale trigger a re-assessment?
- Is there a deadline driving the sale (1031 exchange, divorce, estate, relocation)? That informs how much negotiation room exists.
- What's the average days-on-market for RENTAL listings here right now (not sales)? A rising rental-DOM trend means longer vacancies and softer asking-rent achievability than the comps imply.
- What's the recent tenant-quality profile in this submarket — average credit score on applications, eviction rate, late-payment / NSF rate, and stable-employment percentage? A property-management company in the area should have these aggregated.
- How much new for-sale + rental construction is in the pipeline within 1–3 miles? Heavy new supply typically softens prices + rents 12–24 months out; constrained supply supports both.
Investment metrics
- 1% rule
- 1.26% ✓
- Cap rate
- 7.70%
- Cash-on-cash
- 5.02%
- DSCR
- 1.22
- GRM
- 6.6
CMA / ARV
- ARV (on-the-fly)
- $141,525
- Comps found
- 1
Show comp detail 1 sale within ~0.75 mi
| Address | Dist | Beds/Ba | Sqft | Sold | Price | $/sf | Match |
|---|---|---|---|---|---|---|---|
| 268 Hurleyville Main St | 0.19mi | 3/1.5 | 1,502 (-10%) | 14mo | $127,000 | $85 | 61 |
Match score weights: distance 35% · size 25% · config 20% · recency 20%. Top-matched comps best support the ARV.
Projected returns pro-forma
10.0% appreciation · 3.0% rent growth · sell at horizon
- IRR
- 28.0%
- Equity multiple
- 3.22×
- Total profit
- $86,266
- Equity at exit
- $125,222
- IRR
- 24.4%
- Equity multiple
- 7.33×
- Total profit
- $246,244
- Equity at exit
- $270,046
Cash invested: $38,920 (down + closing). Projections, not guarantees.
Landlord ↔ Tenant lean methodology
- Overall (STATE)
- 15 Strongly Tenant-Friendly
- State New York
- 15 Strongly Tenant-Friendly · D+10
- County
- — inherits STATE
- City
- — inherits STATE
ZIP-level market 12747
- Home prices YoY
- 3.2%
- Active inventory
- 21
- Price-to-rent
- 6.6×
Monthly cashflow live
- Estimated rent
- $1,747 medium interval (Pro) →
- Mortgage (P&I)
- −$729
- Tax from tax record
- −$430 /mo · $5,165/yr
- Insurance
- −$58
- HOA
- −$0
- Vacancy / Maint / Mgmt
- −$367
- Net cashflow
- $163
Break-even live
UW: 25.0% down · 7.5% · 30yr · 1.5% tax · 5.0% vac · 8.0% maint · 8.0% mgmt
Financing live
Cash to close
- Down payment
- $34,750
- Closing costs
- $4,170
- Reserves months
- —
- Total cash needed
- —
Loan-product check · same deal, 3 products live
Conventional
25% down · 7.5% · 30yr
- Down + closing
- —
- Monthly P&I
- —
- Monthly cashflow
- —
- DSCR
- —
- Eligible?
- —
Personal DTI + credit; lowest rate.
DSCR
20% down · 8.5% · 30yr
- Down + closing
- —
- Monthly P&I
- —
- Monthly cashflow
- —
- DSCR
- —
- Eligible?
- —
No personal income docs; deal must DSCR.
Hard money
10% down · 12.0% · 12mo
- Down + closing
- —
- Monthly P&I
- —
- Monthly cashflow
- —
- DSCR
- —
- Eligible?
- —
Short-term bridge; refi at stabilization.
Listing history 13 events
-
2026-04-30status Pending
-
2026-03-16$139,000 Active
-
2014-12-18soldstatus $33,000 394-char remark
Show marketing remark (340 chars)
Highest and best use: large family that needs all the bedrooms or an investor looking to do some clean up and repair and then collect rent. Set up as 4 bedroom, kitchen, bath and very large living room with an additional bedroom and kitchen, bath with separate entry below. New boiler and two new hot water tanks. See Agent's Remarks. .. ..
-
2014-12-18soldstatus $33,000 340-char remark
Show marketing remark (340 chars)
Highest and best use: large family that needs all the bedrooms or an investor looking to do some clean up and repair and then collect rent. Set up as 4 bedroom, kitchen, bath and very large living room with an additional bedroom and kitchen, bath with separate entry below. New boiler and two new hot water tanks. See Agent's Remarks. .. ..
-
2014-11-18historical 340-char remark
Show marketing remark (340 chars)
Highest and best use: large family that needs all the bedrooms or an investor looking to do some clean up and repair and then collect rent. Set up as 4 bedroom, kitchen, bath and very large living room with an additional bedroom and kitchen, bath with separate entry below. New boiler and two new hot water tanks. See Agent's Remarks. .. ..
-
2014-02-04$36,000 394-char remark
Show marketing remark (340 chars)
Highest and best use: large family that needs all the bedrooms or an investor looking to do some clean up and repair and then collect rent. Set up as 4 bedroom, kitchen, bath and very large living room with an additional bedroom and kitchen, bath with separate entry below. New boiler and two new hot water tanks. See Agent's Remarks. .. ..
-
2014-02-04$36,000 340-char remark
Show marketing remark (340 chars)
Highest and best use: large family that needs all the bedrooms or an investor looking to do some clean up and repair and then collect rent. Set up as 4 bedroom, kitchen, bath and very large living room with an additional bedroom and kitchen, bath with separate entry below. New boiler and two new hot water tanks. See Agent's Remarks. .. ..
-
2011-04-05soldstatus $20,000
-
2011-04-05soldstatus $20,000
-
2011-03-02historical
-
2011-02-08$24,000
-
2011-02-07$24,000
-
2005-07-27soldstatus $90,000
ⓘ Source: listings_history table (triggers on properties + properties_extension) + one-shot
backfill from property_details.listing_events for pre-trigger history.
Tax reassessment forecast NY · Partial reset (capped growth)
- Current annual tax
- $5,165 · $430/mo
- Projected year-2 tax
- $5,165 · $430/mo
- Expected delta
- $0/yr ($0/mo · 0.0%)
ⓘ Screening estimate from a state-policy table — verify with the county assessor before closing.
Climate risk First Street
- Flood 1/10 Low FEMA zone X (unshaded) · 0% chance over 30 yrs
- Wildfire 2/10 Low
- Heat 2/10 Low 7 d/yr ≥91°F today · 16 d/yr by 30 yrs out
- Wind 3/10 Moderate 5% chance of damaging wind over 30 yrs
- Air quality 2/10 Low 1 unhealthy d/yr today · 1 by 30 yrs out
Nearby sold comps map
Loading sold comps map…
Walkable amenities ~0.75 mi
Loading nearby amenities…
Taxation est. · year 1
- Rental income
- $20,966
- − Mortgage interest
- −$7,786
- − Property taxes
- −$5,165
- − Insurance
- −$695
- − Repairs & maintenance
- −$1,677
- − Management
- −$1,677
- − Depreciation
- −$4,044
- Taxable loss
- −$79
- Est. tax savings @ 24.0%
- +$19
- After-tax cash flow
- $1,974/yr
For passive investors: Depreciation is non-cash, so a rental often shows a tax loss while cash-flowing — sheltering income. Rental losses are passive: they offset passive income freely, and up to $25,000/yr can offset ordinary (W-2) income if you actively participate and your MAGI is under $100k (phasing out to $0 by $150k); unused losses carry forward. On sale, claimed depreciation is recaptured at up to 25%, and gains may owe capital-gains tax (a 1031 exchange can defer both). Figures are a year-1 estimate at your 24.0% rate — not tax advice; consult a CPA.
Schools (NCES district)
- District
- Fallsburg Central School District
- NCES district ID
- 3610950
- Math proficiency
- 29% ▼ -3.00%
- Reading proficiency
- 27% ▬ 0.00%
- Median HH income
- $42,513
- Composite
- 23.84/100
- National rank
- #7805
- State rank
- #583 of 590 in NY
Livability — Hurleyville
No livability data for this city. (Only ~50 U.S. cities are tracked.)
Census & demographics
- Census place
- Hurleyville, NY
- Population (ZIP)
- 2,036
Population outlook (Sullivan County) Hauer SSP2
- Today (2025)
- 68,974 people
- By 2030
- 65,609 · -4.9%
- By 2040
- 58,878 · -14.6%
- By 2050
- 52,500 · -23.9%
- By 2075
- 39,941 · -42.1%
- By 2100
- 28,880 · -58.1%
Race, ethnicity, and origin ACS 2023
- Neighborhood character
- Predominantly White (75%)
- Race & ethnicity
- White 75% Hispanic / Latino 12% Two or more races 11% Black 8% Asian 2%
- Hispanic origin (detail)
- Puerto Rican 5%
- Common ancestry
- Romanian 14% Lithuanian 10% Scotch-Irish 5%
- Foreign-born
- 7% · Canada
- Languages at home
- 88% English-only · Spanish 10% Chinese 1%
Political lean MEDSL · Sullivan
- 2024 margin
- R (+16.7) · D 41.6% · R 58.4%
- 2008→2024 swing
- -26.2pp toward R · 2008: 9.5pp · 2024: -16.7pp
- All cycles
- 2024: R+16.7 2020: R+9.2 2016: R+13.7 2012: D+10.4 2008: D+9.5
Not yet ingested
- Civics
- —
Market trends
- HPI YoY
- ▲ 15.46%
- Current HPI
- 504.332
- Rent YoY
- —
- Metro
- —
- State GDP YoY
- ▲ 2.60%
- F500 in state
- 92
Industry mix (Fortune 500 HQ in NY)
| Industry | F500 HQs | Revenue |
|---|---|---|
| Financial Services | 10 | $950B |
|
||
| Consumer Goods | 9 | $162B |
|
||
| Insurance | 4 | $225B |
|
||
| Telecommunications | 2 | $144B |
|
||
| Pharmaceuticals | 2 | $112B |
|
||
| Media / Entertainment | 2 | $69B |
|
||
Price history
+54.4% since first listed13 events — show timeline
- 2026-04-30 Pending — OneKey® MLS as Distributed by MLS Grid
- 2026-03-16 Listed $139,000 OneKey® MLS as Distributed by MLS Grid
- 2014-12-18 Sold (MLS) $33,000 HGMLS
- 2014-12-18 Sold (MLS) $33,000 OneKey® MLS as Distributed by MLS Grid
- 2014-11-18 Delisted — HGMLS
- 2014-02-04 Listed $36,000 HGMLS
- 2014-02-04 Listed $36,000 OneKey® MLS as Distributed by MLS Grid
- 2011-04-05 Sold (MLS) $20,000 HGMLS
- 2011-04-05 Sold (MLS) $20,000 HGMLS
- 2011-03-02 Delisted — HGMLS
- 2011-02-08 Listed $24,000 HGMLS
- 2011-02-07 Listed $24,000 HGMLS
- 2005-07-27 Sold (Public Records) $90,000 Public Records
Property tax history
+0.7%/yrLatest (2025): $5,165 · +1.3% YoY. Source: county tax records.
Cash-flow waterfall
monthlySold comps — $/sqft
last 12 mo · ≤1 miLoading sold comps…