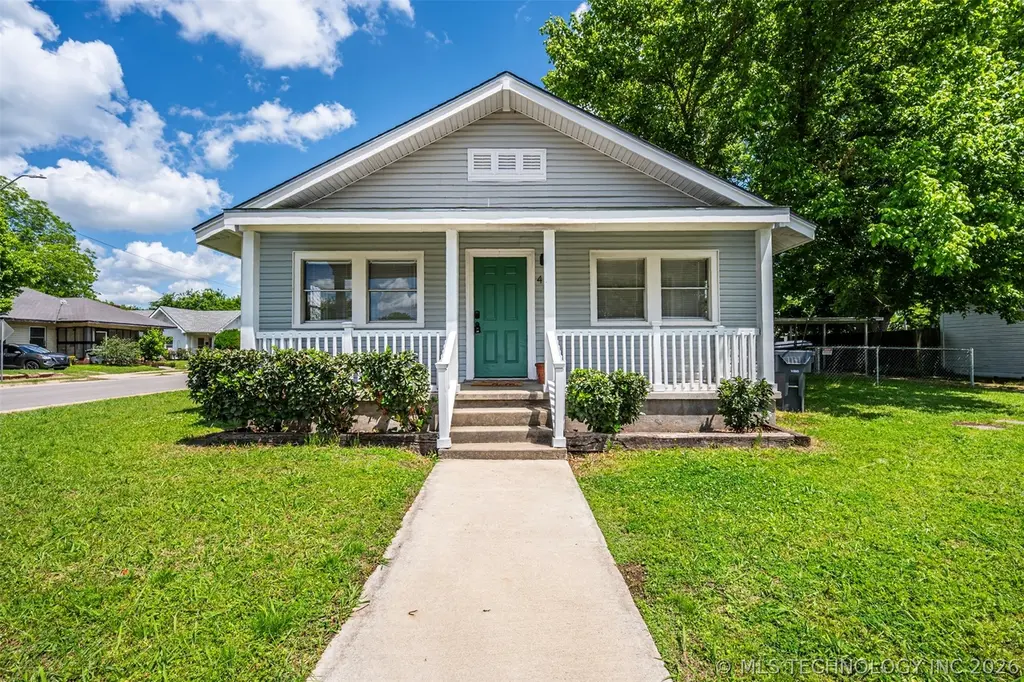
422 NW A St · Ardmore, OK
Flood risk 1/10 · Minimal
- FEMA flood zone
- X (unshaded)
- Chance of flooding over 30 yrs
- 0.0%
- Est. flood insurance / yr
- $507 – $1,088
Fire risk 5/10 · Moderate
- Est. fire insurance / yr
- $2,463 – $4,575
Heat risk 6/10 · Moderate
- Hot days now (above 112°F)
- 7 days/yr
- Hot days in 30 yrs
- 20 days/yr
Wind risk 4/10 · Minor
- Chance of severe wind over 30 yrs
- 10.0%
Air-quality risk 3/10 · Minor
- Unhealthy air days now
- 2 days/yr
- Unhealthy air days in 30 yrs
- 3 days/yr
Risk factors via First Street. Map © Google.
Why this score? — see what drove the D+ grade
The composite is a weighted blend of 9 inputs, each scored 0–100. Each bar is that input's sub-score; the figure is the points it added to the 100-point composite (weight × sub-score).
- Cash flow +24.9/30.0
- DSCR +8.1/10.0
- 1% rule +5.3/10.0
- Rent growth +4.3/5.0
- Livability +2.9/5.0
- Condition / age +2.5/5.0
- Schools +1.1/10.0
- ARV discount +0.0/15.0
- Appreciation +0.0/10.0
$134,900
🖨 Deal sheet 📄 Offer letter ✓ Due diligence
Listing remarks
Completely remodeled from top to bottom in 2019–2020, this light-filled bungalow blends modern updates with timeless charm. Located in the heart of Ardmore, this move-in ready 2 bedroom, 1 bath home offers warm wood floors, bright neutral finishes, and a thoughtfully designed open feel throughout. The fully updated kitchen features custom cabinetry, granite countertops, stainless steel appliances, upgraded lighting, designer tile backsplash, and abundant storage. Spacious living and dining areas are filled with natural light and showcase the home’s beautifully refinished wood floors and fresh designer touches throughout. Major updates completed during the remodel include a new H
Key facts
- Custom cabinetry
- Updated kitchen
- Granite countertops
Tags
Property features AI
Finance
- HOA & community: Sidewalks in the community
Exterior
- Security: No safety shelter
- Utilities: Electricity available; Public water; Public sewer
- Home design: Single-story; Faces west; Entry on crawlspace foundation
- Construction: Built with vinyl siding and wood frame; Asphalt/fiberglass roof; Crawlspace foundation; Year built per public records
- Exterior features: Corner lot; Chain link fence; Storage structure
Interior
- Kitchen: Oven; Range
- Flooring: Tile flooring; Wood flooring
- Bathrooms: 1 full bathroom
- Heating & cooling: Central heating (electric); Central air; Window unit(s)
- Interior features: Granite counters; Ceiling fan(s); Other interior features
Neighborhood map
What this means for you Summary
Snapshot
- This is a 3-bed/1.0-bath single-family listed at $135k.
Deal economics
- At list price, monthly cash flow is $291 ($3k/yr) — positive.
- The deal already cash-flows at list — no discount required.
- Meets the 1% rule at list price ($1k rent vs $135k).
- Recommended offer: $131k (3.0% below list) — sets the bar for market timing.
- Cap rate 8.9% vs local median 4.6% in Ardmore — top-decile yield for the area; either an underpriced asset or a hidden risk that comps aren't pricing in. Stress-test before assuming the spread holds.
Location & tenants
- Location reads 58/100 on livability (#447 in OK) — a working-class tenant base; expect higher turnover. Strengths: cost of living A+, housing A+; Watch: schools F, crime F, amenities F.
- Ardmore (town): math 12% / reading 15% proficiency, ranked #241 of 270 in OK (top 89%) — low school quality limits family demand, transient renter base, plan for 1-2y turnover; 73% free/reduced lunch — lower-income household profile, screen leases tightly.
- Market conditions: Rents rising fast (+7.4%/yr); 379 active listings in the ZIP; 73 units permitted in Carter County in 2024 (0 in 5+ unit buildings).
Forward outlook
- Local home prices are declining (-3.0%/yr); year-one equity from $933 of loan paydown is wiped out by about $4k of value loss. Plan a longer hold.
- Carter County population projected at +9% by 2050 — modest demand growth; plan on rents tracking national, not racing it.
- At projected returns (-3.0% appreciation + 7.4% rent growth), your $38k cash investment doubles in ~8 years — after that, you're playing with house money.
Negotiation context
- It's been on market 38 days — a 3% lower offer ($131k) is reasonable based on typical stale-listing flexibility.
- 8 sale attempts since 11y ago with the ask held roughly flat each time — persistent listings suggest the price (not the market) is what's stuck; bring a comps-based counter.
- Current owner paid $32k; list at $135k implies a 322% gain — meaningful room to come down on a strong offer.
Risks & watch-outs
- Watch-outs: built in 1950 — expect roof / HVAC / electrical / plumbing capex.
- Climate carrying-cost: moderate wildfire risk; extreme-heat days projected 7→20/yr by 2055 (HVAC capex compounding) — expect insurance premiums to compound above CPI over the hold.
Questions for the listing agent
- It's been on market 38 days. Have you received any prior offers? Is the seller open to a 3% concession, seller financing, or rate buy-down credit?
- Built in 1950 — when were the roof, HVAC, electrical panel, plumbing, and water heater last replaced?
- Is there a deadline driving the sale (1031 exchange, divorce, estate, relocation)? That informs how much negotiation room exists.
- Schools are F-rated, which usually means shorter tenancies and higher turnover. Who's the typical renter profile here, and what's been the actual vacancy rate?
- Crime grade is F in this area — have there been break-ins, vandalism, or insurance claims at this property in the last 3 years? What carrier currently insures it and at what premium?
- The area grade is low — what's the realistic commute time and amenity access for the typical tenant pool here? Any planned neighborhood developments (good or bad) we should know about?
- What's the average days-on-market for RENTAL listings here right now (not sales)? A rising rental-DOM trend means longer vacancies and softer asking-rent achievability than the comps imply.
- What's the recent tenant-quality profile in this submarket — average credit score on applications, eviction rate, late-payment / NSF rate, and stable-employment percentage? A property-management company in the area should have these aggregated.
- How much new for-sale + rental construction is in the pipeline within 1–3 miles? Heavy new supply typically softens prices + rents 12–24 months out; constrained supply supports both.
Investment metrics
- 1% rule
- 1.03% ✓
- Cap rate
- 8.88%
- Cash-on-cash
- 9.25%
- DSCR
- 1.41
- GRM
- 8.1
CMA / ARV
- ARV (on-the-fly)
- $96,096
- Comps found
- 12
Show comp detail 12 sales within ~0.75 mi
| Address | Dist | Beds/Ba | Sqft | Sold | Price | $/sf | Match |
|---|---|---|---|---|---|---|---|
| 20 8th NW | 0.20mi | 3/1.0 | 1,109 (+2%) | 10mo | $80,000 | $72 | 79 |
| 607 3rd NW | 0.42mi | 3/1.0 | 1,096 (+0%) | 7mo | $80,000 | $73 | 74 |
| 504 5th NW | 0.35mi | 2/1.0 (-1) | 1,162 (+6%) | 3mo | $138,000 | $119 | 66 |
| 408 NW 11th St | 0.50mi | 2/1.0 (-1) | 1,194 (+9%) | 1mo | $140,000 | $117 | 55 |
| 113 10th Ave NE | 0.42mi | 2/1.0 (-1) | 938 (-14%) | 3mo | $83,000 | $88 | 49 |
| 1220 Hargrove | 0.67mi | 3/1.0 | 1,182 (+8%) | 7mo | $155,000 | $131 | 49 |
| 518 3rd Ave NW | 0.39mi | 2/1.0 (-1) | 1,244 (+14%) | 5mo | $89,000 | $72 | 49 |
| 810 2nd Ave NW | 0.56mi | 2/2.0 (-1) | 1,172 (+7%) | 10mo | $75,000 | $64 | 44 |
| 915 Martin Luther King Dr | 0.74mi | 3/1.0 | 1,223 (+12%) | 3mo | $41,000 | $34 | 43 |
| 1115 Harris St | 0.71mi | 2/2.0 (-1) | 1,180 (+8%) | 4mo | $128,000 | $108 | 41 |
| 1003 NE 8th Ave | 0.74mi | 3/1.5 | 997 (-9%) | 12mo | $19,500 | $20 | 39 |
| 1005 E NW | 0.52mi | 3/2.0 | 1,255 (+15%) | 12mo | $169,000 | $135 | 37 |
Match score weights: distance 35% · size 25% · config 20% · recency 20%. Top-matched comps best support the ARV.
Projected returns pro-forma
-3.0% appreciation · 7.38% rent growth · sell at horizon
- IRR
- 2.0%
- Equity multiple
- 1.08×
- Total profit
- $3,004
- Equity at exit
- $20,114
- IRR
- 15.1%
- Equity multiple
- 2.45×
- Total profit
- $54,919
- Equity at exit
- $11,664
Cash invested: $37,772 (down + closing). Projections, not guarantees.
Landlord ↔ Tenant lean methodology
- Overall (STATE)
- 83 Strongly Landlord-Friendly
- State Oklahoma
- 83 Strongly Landlord-Friendly · R+20
- County
- — inherits STATE
- City
- — inherits STATE
ZIP-level market 73401
- Home prices YoY
- -21.7%
- Rents YoY
- 7.4%
- Active inventory
- 379
- Price-to-rent
- 8.1×
Monthly cashflow live
- Estimated rent
- $1,387 medium interval (Pro) →
- Mortgage (P&I)
- −$707
- Tax from tax record
- −$41 /mo · $489/yr
- Insurance
- −$56
- HOA
- −$0
- Vacancy / Maint / Mgmt
- −$291
- Net cashflow
- $291
Break-even live
UW: 25.0% down · 7.5% · 30yr · 1.5% tax · 5.0% vac · 8.0% maint · 8.0% mgmt
Financing live
Cash to close
- Down payment
- $33,725
- Closing costs
- $4,047
- Reserves months
- —
- Total cash needed
- —
Loan-product check · same deal, 3 products live
Conventional
25% down · 7.5% · 30yr
- Down + closing
- —
- Monthly P&I
- —
- Monthly cashflow
- —
- DSCR
- —
- Eligible?
- —
Personal DTI + credit; lowest rate.
DSCR
20% down · 8.5% · 30yr
- Down + closing
- —
- Monthly P&I
- —
- Monthly cashflow
- —
- DSCR
- —
- Eligible?
- —
No personal income docs; deal must DSCR.
Hard money
10% down · 12.0% · 12mo
- Down + closing
- —
- Monthly P&I
- —
- Monthly cashflow
- —
- DSCR
- —
- Eligible?
- —
Short-term bridge; refi at stabilization.
Listing history 34 events
-
2026-06-19days on market $134,900 Active 38 DOM
-
2026-06-18days on market $134,900 Active 37 DOM
-
2026-06-17days on market $134,900 Active 36 DOM
-
2026-06-16days on market $134,900 Active 35 DOM
-
2026-06-15days on market $134,900 Active 34 DOM
-
2026-06-14days on market $134,900 Active 32 DOM
-
2026-06-12days on market $134,900 Active 31 DOM
-
2026-06-09days on market $134,900 Active 28 DOM
-
2026-06-08days on market $134,900 Active 27 DOM
-
2026-06-07days on market $134,900 Active 26 DOM
-
2026-06-05days on market $134,900 Active 23 DOM
-
2026-06-03days on market $134,900 Active 22 DOM
-
2026-06-02days on market $134,900 Active 21 DOM
-
2026-06-01days on market $134,900 Active 20 DOM
-
2026-05-31days on market $134,900 Active 19 DOM
-
2026-05-30days on market $134,900 Active 18 DOM
-
2026-05-12$134,900 Active
-
2024-11-12historical $1,050
-
2024-11-01$1,050
-
2024-02-19historical
-
2024-01-29historical
-
2023-10-31historical
-
2023-08-10$139,000 Active
-
2023-08-10$139,000 Active
-
2023-08-02$139,000 Active
-
2023-07-01historical
-
2019-09-09soldstatus $32,000
-
2019-05-06$35,000
-
2016-02-26soldstatus $65,000
-
2016-02-25$65,000
-
2015-11-12soldstatus $29,000
-
2015-11-09soldstatus $29,000
-
2015-05-06$29,000
-
2005-07-20soldstatus $25,000
ⓘ Source: listings_history table (triggers on properties + properties_extension) + one-shot
backfill from property_details.listing_events for pre-trigger history.
Tax reassessment forecast OK · Resets to sale price
- Current annual tax
- $489 · $41/mo
- Projected year-2 tax
- $1,214 · $101/mo
- Expected delta
- +$725/yr (+$60/mo · 148.3%)
ⓘ Screening estimate from a state-policy table — verify with the county assessor before closing.
Climate risk First Street
- Flood 1/10 Low FEMA zone X (unshaded) · 0% chance over 30 yrs
- Wildfire 5/10 Major
- Heat 6/10 Major 7 d/yr ≥112°F today · 20 d/yr by 30 yrs out
- Wind 4/10 Moderate 10% chance of damaging wind over 30 yrs
- Air quality 3/10 Moderate 2 unhealthy d/yr today · 3 by 30 yrs out
Nearby sold comps map
Loading sold comps map…
Walkable amenities ~0.75 mi
Loading nearby amenities…
Taxation est. · year 1
- Rental income
- $16,640
- − Mortgage interest
- −$7,556
- − Property taxes
- −$489
- − Insurance
- −$674
- − Repairs & maintenance
- −$1,331
- − Management
- −$1,331
- − Depreciation
- −$3,924
- Taxable income
- $1,334
- Est. tax owed @ 24.0%
- −$320
- After-tax cash flow
- $3,173/yr
For passive investors: Depreciation is non-cash, so a rental often shows a tax loss while cash-flowing — sheltering income. Rental losses are passive: they offset passive income freely, and up to $25,000/yr can offset ordinary (W-2) income if you actively participate and your MAGI is under $100k (phasing out to $0 by $150k); unused losses carry forward. On sale, claimed depreciation is recaptured at up to 25%, and gains may owe capital-gains tax (a 1031 exchange can defer both). Figures are a year-1 estimate at your 24.0% rate — not tax advice; consult a CPA.
Schools (NCES district)
- District
- Ardmore
- NCES district ID
- 4003180
- Math proficiency
- 12% ▼ -7.00%
- Reading proficiency
- 15% ▼ -6.00%
- Median HH income
- $35,194
- Composite
- 11.1/100
- National rank
- #9733
- State rank
- #241 of 270 in OK
Livability — Ardmore
- Score
- 58/100
- State rank
- #447
- US rank
- #21387
Category grades
Schools grade is shown separately in the Schools card above.
Census & demographics
- Census place
- Ardmore, OK
- County
- Carter County · 36,833 people
- City population
- 36,833
- Metro
- Ardmore, OK
- Population (ZIP)
- 36,833
- Household income
- $61,989
- Rent vs Own
- Severe rent burden
- 1026.0
Population outlook (Carter County) Hauer SSP2
- Today (2025)
- 50,892 people
- By 2030
- 51,913 · +2.0%
- By 2040
- 53,857 · +5.8%
- By 2050
- 55,604 · +9.3%
- By 2075
- 60,670 · +19.2%
- By 2100
- 62,366 · +22.5%
Race, ethnicity, and origin ACS 2023
- Neighborhood character
- Diverse neighborhood (Simpson 0.57)
- Race & ethnicity
- White 65% Two or more races 14% Hispanic / Latino 9% Native American 8% Black 7% Asian 1%
- Hispanic origin (detail)
- Mexican 7%
- Common ancestry
- Slovak 2% Lithuanian 1% Italian 1%
- Foreign-born
- 4% · Canada
- Languages at home
- 92% English-only · Spanish 5%
Political lean MEDSL · Carter
- 2024 margin
- Solid R (+54.7) · D 21.9% · R 76.7% · Other 1.4%
- 2008→2024 swing
- -14.2pp toward R · 2008: -40.5pp · 2024: -54.7pp
- All cycles
- 2024: R+54.7 2020: R+52.5 2016: R+52.6 2012: R+42.7 2008: R+40.5
Not yet ingested
- Civics
- —
Market trends
- HPI YoY
- ▼ -74.93%
- Current HPI
- 269.7381
- Rent YoY
- ▲ 7.38%
- Metro
- Ardmore, OK
- State GDP YoY
- ▲ 1.55%
- F500 in state
- 6
Industry mix (Fortune 500 HQ in OK)
| Industry | F500 HQs | Revenue |
|---|---|---|
| Energy | 3 | $48B |
|
||
Price history
+439.6% since first listed18 events — show timeline
- 2026-05-12 Listed $134,900 MLS Technology, Inc.
- 2024-11-12 Rental Removed $1,050 APPFOLIO
- 2024-11-01 Listed for Rent $1,050 APPFOLIO
- 2024-02-19 Listing Removed — MLSOK
- 2024-01-29 Listing Removed — MLS Technology, Inc.
- 2023-10-31 Listing Removed — MLSOK
- 2023-08-10 Listed $139,000 MLSOK
- 2023-08-10 Listed $139,000 MLS Technology, Inc.
- 2023-08-02 Listed $139,000 MLSOK
- 2023-07-01 Rental Removed — APPFOLIO
- 2019-09-09 Sold (MLS) $32,000 MLS Technology, Inc.
- 2019-05-06 Listed $35,000 MLS Technology, Inc.
- 2016-02-26 Sold (MLS) $65,000 MLS Technology, Inc.
- 2016-02-25 Listed $65,000 MLS Technology, Inc.
- 2015-11-12 Sold (Public Records) $29,000 Public Records
- 2015-11-09 Sold (MLS) $29,000 MLS Technology, Inc.
- 2015-05-06 Listed $29,000 MLS Technology, Inc.
- 2005-07-20 Sold (Public Records) $25,000 Public Records
Property tax history
+6.2%/yrLatest (2025): $489 · +4.9% YoY. Source: county tax records.
Cash-flow waterfall
monthlySold comps — $/sqft
last 12 mo · ≤1 miLoading sold comps…