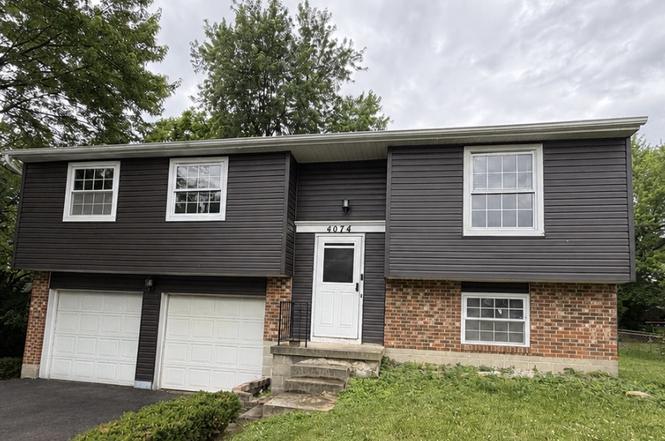
4074 Rymark Ct · Clayton, OH
Flood risk 1/10 · Minimal
- FEMA flood zone
- X (unshaded)
- Chance of flooding over 30 yrs
- 0.0%
- Est. flood insurance / yr
- $473 – $860
Fire risk 1/10 · Minimal
- Est. fire insurance / yr
- $713 – $1,323
Heat risk 3/10 · Minor
- Hot days now (above 101°F)
- 7 days/yr
- Hot days in 30 yrs
- 18 days/yr
Wind risk 2/10 · Minimal
- Chance of severe wind over 30 yrs
- 0.0%
Air-quality risk 3/10 · Minor
- Unhealthy air days now
- 3 days/yr
- Unhealthy air days in 30 yrs
- 4 days/yr
Risk factors via First Street. Map © Google.
Why this score? — see what drove the C- grade
The composite is a weighted blend of 9 inputs, each scored 0–100. Each bar is that input's sub-score; the figure is the points it added to the 100-point composite (weight × sub-score).
- Cash flow +15.3/30.0
- ARV discount +15.0/15.0
- Schools +5.0/10.0
- DSCR +4.7/10.0
- 1% rule +4.4/10.0
- Livability +3.6/5.0
- Rent growth +2.5/5.0
- Condition / age +2.5/5.0
- Appreciation +0.0/10.0
$189,000
🖨 Deal sheet 📄 Offer letter ✓ Due diligence
Listing remarks MLS
Great opportunity to own this 3 bed 2 bath bi-level property nestled close to the end of a cul-de-sac street! This Home boasts a 2 Car Garage with ample space to work on projects, an additional Storage shed, Several large closets, Large fenced in backyard, Extra large deck just in time for summer grilling and relaxing on your patio. BRAND NEW A/C UNIT and BRAND NEW FURNACE, New garbage disposal. Northmont City School district. Not even 5 minutes from several restaurants, shopping, and easy access to the interstate. This one won't last long.
Key facts
- 9,775 sq ft lot
- 2 garage spots
- Built 1978
Neighborhood map
What this means for you Summary
Snapshot
- This is a 3-bed/1.5-bath single-family listed at $189k.
Deal economics
- At list price, monthly cash flow is $68 ($822/yr) — positive.
- The deal already cash-flows at list — no discount required.
- To meet the 1% rule (rent ≥ 1% of price), the offer needs to be $178k (5.7% below list).
- Recommended offer: $178k (5.7% below list) — sets the bar for 1% rule.
- Cap rate 6.7% vs local median 4.4% in Clayton — top-decile yield for the area; either an underpriced asset or a hidden risk that comps aren't pricing in. Stress-test before assuming the spread holds.
Location & tenants
- Location reads 72/100 on livability (#363 in OH) — a middle-class / working-renter tenant base. Strengths: crime A+, cost of living A+, housing A+; Watch: amenities F, commute F, health & safety F.
- Northmont City (suburban): math 52% / reading 62% proficiency, ranked #318 of 656 in OH (top 48%) — acceptable for families but not a draw, mixed tenant base, ~2y average lease.
- Market conditions: 53 active listings in the ZIP; 8 comparable units currently listed for rent nearby; rentals leasing fast (median 3d on market — plan ~1-2 weeks tenant-placement turnaround); solid renter incomes; 907 units permitted in Montgomery County in 2024 (416 in 5+ unit buildings).
Forward outlook
- Local home prices are declining (-3.0%/yr); year-one equity from $1k of loan paydown is wiped out by about $6k of value loss. Plan a longer hold.
- Montgomery County population projected at -10% by 2050 — secular population decline; favor cash flow + early exit over multi-decade hold.
Negotiation context
- Only 0 days on market — expect competitive offers; lowballing is unlikely to land.
- 3 sale attempts since 3y ago with the ask held roughly flat each time — persistent listings suggest the price (not the market) is what's stuck; bring a comps-based counter.
Questions for the listing agent
- Built in 1978 — when were the roof, HVAC, electrical panel, plumbing, and water heater last replaced?
- Is there a deadline driving the sale (1031 exchange, divorce, estate, relocation)? That informs how much negotiation room exists.
- Schools are B-rated — typically a magnet for longer-tenancy family renters. What's the average tenant stay here, and is there a school-zone premium baked into asking?
- What's the average days-on-market for RENTAL listings here right now (not sales)? A rising rental-DOM trend means longer vacancies and softer asking-rent achievability than the comps imply.
- What's the recent tenant-quality profile in this submarket — average credit score on applications, eviction rate, late-payment / NSF rate, and stable-employment percentage? A property-management company in the area should have these aggregated.
- How much new for-sale + rental construction is in the pipeline within 1–3 miles? Heavy new supply typically softens prices + rents 12–24 months out; constrained supply supports both.
Investment metrics
- 1% rule
- 0.94% ✗
- Cap rate
- 6.73%
- Cash-on-cash
- 1.55%
- DSCR
- 1.07
- GRM
- 8.8
CMA / ARV
- ARV (on-the-fly)
- $227,708
- Comps found
- 12
Show comp detail 12 sales within ~0.75 mi
| Address | Dist | Beds/Ba | Sqft | Sold | Price | $/sf | Match |
|---|---|---|---|---|---|---|---|
| 6781 Taywood Rd | 0.33mi | 3/2.0 | 1,545 (+2%) | 4mo | $228,000 | $148 | 75 |
| 6826 Stillmore Dr | 0.52mi | 3/2.0 | 1,463 (-3%) | 2mo | $210,000 | $144 | 67 |
| 3799 Old Salem Rd | 0.28mi | 3/2.0 | 1,336 (-11%) | 1mo | $300,000 | $225 | 65 |
| 4507 Skylark Dr | 0.61mi | 3/2.0 | 1,500 (-0%) | 6mo | $249,100 | $166 | 64 |
| 4301 Skylark Dr | 0.38mi | 3/2.0 | 1,658 (+10%) | 1mo | $264,000 | $159 | 63 |
| 3406 Northfield Rd | 0.48mi | 3/2.0 | 1,590 (+5%) | 11mo | $265,000 | $167 | 57 |
| 4400 Old Salem Rd | 0.73mi | 3/2.0 | 1,499 (-1%) | 10mo | $220,000 | $147 | 55 |
| 4250 Willow Creek Dr | 0.56mi | 3/2.0 | 1,640 (+9%) | 4mo | $244,000 | $149 | 54 |
| 4528 Sydenham Rd | 0.52mi | 3/2.0 | 1,684 (+12%) | 1mo | $250,000 | $148 | 54 |
| 4245 Satellite Ave | 0.32mi | 4/2.5 (+1) | 1,656 (+10%) | 9mo | $249,900 | $151 | 53 |
| 3631 Greenbay Dr | 0.57mi | 3/2.0 | 1,666 (+10%) | 6mo | $199,000 | $119 | 49 |
| 3020 Old Salem Rd | 0.70mi | 3/1.5 | 1,334 (-12%) | 9mo | $259,750 | $195 | 40 |
Match score weights: distance 35% · size 25% · config 20% · recency 20%. Top-matched comps best support the ARV.
Projected returns pro-forma
-3.0% appreciation · 3.0% rent growth · sell at horizon
- IRR
- -13.8%
- Equity multiple
- 0.50×
- Total profit
- $-26,218
- Equity at exit
- $28,181
- IRR
- -4.9%
- Equity multiple
- 0.68×
- Total profit
- $-17,023
- Equity at exit
- $16,341
Cash invested: $52,920 (down + closing). Projections, not guarantees.
Landlord ↔ Tenant lean methodology
- Overall (STATE)
- 73 Landlord-Friendly
- State Ohio
- 73 Landlord-Friendly · R+6
- County
- — inherits STATE
- City
- — inherits STATE
ZIP-level market 45415
- Active inventory
- 53
- Price-to-rent
- 8.8×
Monthly cashflow live
- Estimated rent
- $1,782 high interval (Pro) →
- Mortgage (P&I)
- −$991
- Tax from tax record
- −$270 /mo · $3,237/yr
- Insurance
- −$79
- HOA
- −$0
- Vacancy / Maint / Mgmt
- −$374
- Net cashflow
- $68
Break-even live
UW: 25.0% down · 7.5% · 30yr · 1.5% tax · 5.0% vac · 8.0% maint · 8.0% mgmt
Financing live
Cash to close
- Down payment
- $47,250
- Closing costs
- $5,670
- Reserves months
- —
- Total cash needed
- —
Loan-product check · same deal, 3 products live
Conventional
25% down · 7.5% · 30yr
- Down + closing
- —
- Monthly P&I
- —
- Monthly cashflow
- —
- DSCR
- —
- Eligible?
- —
Personal DTI + credit; lowest rate.
DSCR
20% down · 8.5% · 30yr
- Down + closing
- —
- Monthly P&I
- —
- Monthly cashflow
- —
- DSCR
- —
- Eligible?
- —
No personal income docs; deal must DSCR.
Hard money
10% down · 12.0% · 12mo
- Down + closing
- —
- Monthly P&I
- —
- Monthly cashflow
- —
- DSCR
- —
- Eligible?
- —
Short-term bridge; refi at stabilization.
Rent comps 8 comps
| Address | Beds | Baths | Sqft | Rent | $/sqft | DOM | Units | Dist |
|---|---|---|---|---|---|---|---|---|
| 4564 Linchmere Dr Dayton, OH | 3.0 | 3.0 | 1096 | $1,595 | $1.46 | 14d | 1 | 0.55mi |
| 4777 Dawnwood Dr Dayton, OH | 3.0 | 2.5 | 1479 | $1,900 | $1.28 | 2d | 1 | 0.91mi |
| 5900 Macduff Dr Dayton, OH | 1.0–4.0 | 1.0–2.0 | 1104 | $1,467 | $1.33 | 2d | 17 | 1.24mi |
| 5011 Scothills Dr Englewood, OH | 3.0 | 2.0 | 1060 | $1,595 | $1.50 | 2d | 1 | 1.31mi |
| 6844 Union Rd Englewood, OH | 3.0 | 2.0 | 1700 | $2,100 | $1.24 | 2d | 1 | 1.32mi |
| 8825 Meeker Rd Dayton, OH | 4.0 | 1.0 | 2000 | $2,000 | $1.00 | 2d | 1 | 1.36mi |
| 416 W Wenger Rd Englewood, OH | 3.0 | 1.5 | 1249 | $2,000 | $1.60 | 2d | 1 | 1.39mi |
| 8915 Meeker Rd Dayton, OH | 3.0 | 1.5 | 1542 | $1,700 | $1.10 | 2d | 1 | 1.39mi |
Listing history 2 events
-
2026-06-18remarks 693-char remark
-
2026-06-18$189,000 Pending
ⓘ Source: listings_history table (triggers on properties + properties_extension) + one-shot
backfill from property_details.listing_events for pre-trigger history.
Tax reassessment forecast OH · Partial reset (capped growth)
- Current annual tax
- $3,237 · $270/mo
- Projected year-2 tax
- $3,237 · $270/mo
- Expected delta
- $0/yr ($0/mo · 0.0%)
ⓘ Screening estimate from a state-policy table — verify with the county assessor before closing.
Climate risk First Street
- Flood 1/10 Low FEMA zone X (unshaded) · 0% chance over 30 yrs
- Wildfire 1/10 Low
- Heat 3/10 Moderate 7 d/yr ≥101°F today · 18 d/yr by 30 yrs out
- Wind 2/10 Low 0% chance of damaging wind over 30 yrs
- Air quality 3/10 Moderate 3 unhealthy d/yr today · 4 by 30 yrs out
Nearby sold comps map
Loading sold comps map…
Walkable amenities ~0.75 mi
Loading nearby amenities…
Taxation est. · year 1
- Rental income
- $21,389
- − Mortgage interest
- −$10,587
- − Property taxes
- −$3,237
- − Insurance
- −$945
- − Repairs & maintenance
- −$1,711
- − Management
- −$1,711
- − Depreciation
- −$5,498
- Taxable loss
- −$2,300
- Est. tax savings @ 24.0%
- +$552
- After-tax cash flow
- $1,374/yr
For passive investors: Depreciation is non-cash, so a rental often shows a tax loss while cash-flowing — sheltering income. Rental losses are passive: they offset passive income freely, and up to $25,000/yr can offset ordinary (W-2) income if you actively participate and your MAGI is under $100k (phasing out to $0 by $150k); unused losses carry forward. On sale, claimed depreciation is recaptured at up to 25%, and gains may owe capital-gains tax (a 1031 exchange can defer both). Figures are a year-1 estimate at your 24.0% rate — not tax advice; consult a CPA.
Schools (NCES district)
- District
- Northmont City
- NCES district ID
- 3904872
- Math proficiency
- 52% ▼ -15.00%
- Reading proficiency
- 62% ▼ -8.00%
- Median HH income
- $60,230
- Composite
- 49.53/100
- National rank
- #1995
- State rank
- #318 of 656 in OH
Livability — Clayton
- Score
- 72/100
- State rank
- #363
- US rank
- #5877
Category grades
Schools grade is shown separately in the Schools card above.
Census & demographics
- Census place
- Clayton, OH
- County
- Montgomery · 506,435 people
- City population
- 37,953
- Metro
- Dayton-Kettering-Beavercreek, OH
- Population (ZIP)
- 12,171
- Household income
- $78,864
- Rent vs Own
- Severe rent burden
- 9.7
Population outlook (Montgomery County) Hauer SSP2
- Today (2025)
- 523,241 people
- By 2030
- 514,948 · -1.6%
- By 2040
- 493,378 · -5.7%
- By 2050
- 469,639 · -10.2%
- By 2075
- 418,360 · -20.0%
- By 2100
- 353,315 · -32.5%
Race, ethnicity, and origin ACS 2023
- Neighborhood character
- Diverse neighborhood (Simpson 0.55)
- Race & ethnicity
- White 53% Black 42% Two or more races 4%
- Common ancestry
- Lithuanian 2% Slovak 2% Romanian 1%
- Foreign-born
- 5% · Canada
- Languages at home
- 95% English-only · Other Indo-European 1% Spanish 1%
Political lean MEDSL · Montgomery
- 2024 margin
- Toss-up / Even · D 49.8% · R 49.3%
- 2008→2024 swing
- -5.8pp toward R · 2008: 6.2pp · 2024: 0.5pp
- All cycles
- 2024: D+0.5 2020: D+2.2 2016: R+1.2 2012: D+3.1 2008: D+6.2
Not yet ingested
- Civics
- —
Market trends
- HPI YoY
- ▼ -151.39%
- Current HPI
- 171.4122
- Rent YoY
- —
- Metro
- —
- State GDP YoY
- ▲ 1.98%
- F500 in state
- 48
Industry mix (Fortune 500 HQ in OH)
| Industry | F500 HQs | Revenue |
|---|---|---|
| Insurance | 3 | $145B |
|
||
| Industrial Machinery | 3 | $49B |
|
||
| Financial Services | 3 | $24B |
|
||
| Consumer Goods | 2 | $93B |
|
||
| Aerospace / Defense | 2 | $47B |
|
||
| Utilities | 2 | $33B |
|
||
Price history
+243.6% since first listed15 events — show timeline
- 2026-06-18 Listing Removed — Dayton MLS
- 2026-06-18 Listed $189,000 Dayton MLS
- 2023-04-17 Sold (MLS) $192,000 WRIST
- 2023-04-17 Sold (MLS) $192,000 Dayton MLS
- 2023-04-17 Sold (MLS) $192,000 Dayton MLS
- 2023-03-21 Pending — WRIST
- 2023-03-21 Pending — Dayton MLS
- 2023-02-28 Listed $195,000 WRIST
- 2023-02-28 Listed $195,000 Dayton MLS
- 2018-01-25 Sold (Public Records) $124,900 Public Records
- 2010-05-19 Sold (Public Records) $136,900 Public Records
- 2008-04-24 Sold (Public Records) $136,900 Public Records
- 2003-08-29 Sold (Public Records) $120,300 Public Records
- 1997-02-03 Sold (Public Records) $94,000 Public Records
- 1985-01-31 Sold (Public Records) $55,000 Public Records
Property tax history
+2.2%/yrLatest (2025): $3,237 · +5.6% YoY. Source: county tax records.
Cash-flow waterfall
monthlySold comps — $/sqft
last 12 mo · ≤1 miLoading sold comps…