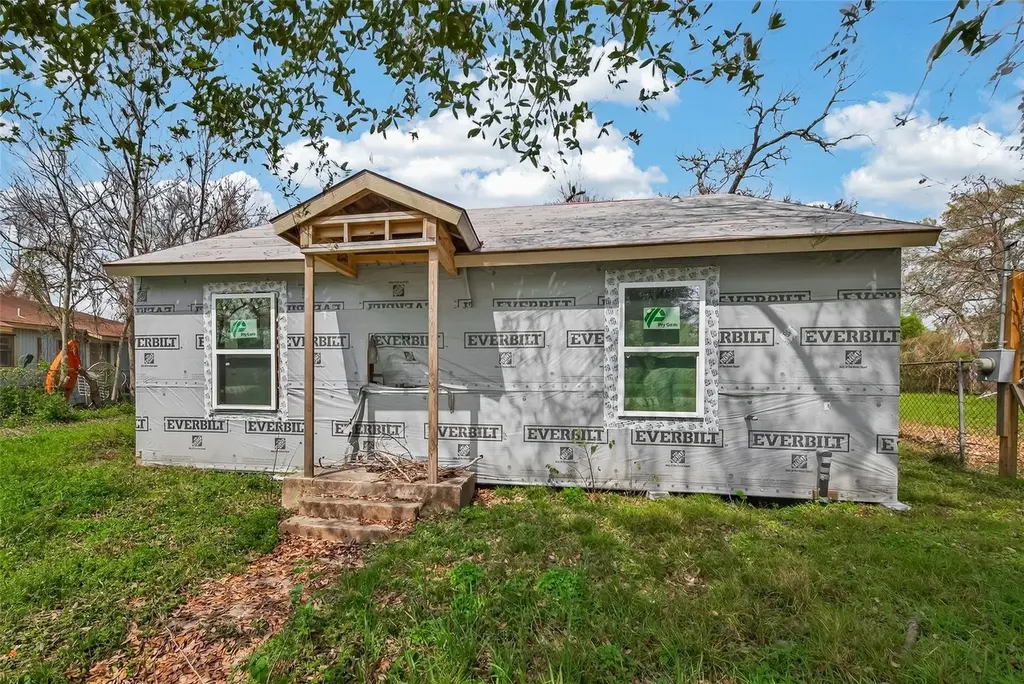
3511 Bain St · Houston, TX
Flood risk 4/10 · Minor
- FEMA flood zone
- AE
- Chance of flooding over 30 yrs
- 0.21%
- Est. flood insurance / yr
- $1,737 – $8,500
Fire risk 1/10 · Minimal
- Est. fire insurance / yr
- $1,222 – $2,270
Heat risk 9/10 · Severe
- Hot days now (above 109°F)
- 7 days/yr
- Hot days in 30 yrs
- 23 days/yr
Wind risk 9/10 · Severe
- Chance of severe wind over 30 yrs
- 99.0%
Air-quality risk 3/10 · Minor
- Unhealthy air days now
- 2 days/yr
- Unhealthy air days in 30 yrs
- 3 days/yr
Risk factors via First Street. Map © Google.
Why this score? — see what drove the C grade
The composite is a weighted blend of 9 inputs, each scored 0–100. Each bar is that input's sub-score; the figure is the points it added to the 100-point composite (weight × sub-score).
- Cash flow +16.0/30.0
- ARV discount +15.0/15.0
- Appreciation +6.9/10.0
- DSCR +5.0/10.0
- 1% rule +4.9/10.0
- Livability +3.7/5.0
- Rent growth +3.3/5.0
- Schools +2.7/10.0
- Condition / age +2.5/5.0
$104,995
🖨 Deal sheet 📄 Offer letter ✓ Due diligence
Listing remarks
Location, close to downtown
Key facts
- 8,511 sq ft lot
- Built 1940
- Listed 34 days
Property features AI
Finance
- Other: Living area approximately 840; Lot about 8,512 sq ft (0.1954 acres)
- Financial info: Lease not considered
Exterior
- Utilities: Public water; Public sewer
- Home design: Residential property; Built in 1940; Single-story (entry level: first); Facing information not provided
- Construction: Wood siding exterior; Composition roof; Pillar/post/pier foundation
- Exterior features: Subdivision lot
Interior
- Bedrooms: Bedroom (first level); Primary bedroom (first level)
- Bathrooms: 1 full bathroom
- Heating & cooling: Central heating (electric); Central air conditioning (electric)
- Interior features: Two total rooms
Neighborhood map
What this means for you Summary
Snapshot
- This is a 2-bed/1.0-bath single-family listed at $105k.
Deal economics
- At list price, monthly cash flow is $-374 ($-4k/yr) — negative.
- To cash-flow at today's rent, offer at most $41k (60.6% below list).
- To meet the 1% rule (rent ≥ 1% of price), the offer needs to be $104k (1.2% below list).
- Recommended offer: $41k (60.6% below list) — sets the bar for cash-flow.
- Cap rate 6.9% vs local median 3.2% in Houston — top-decile yield for the area; either an underpriced asset or a hidden risk that comps aren't pricing in. Stress-test before assuming the spread holds.
Location & tenants
- Location reads 74/100 on livability (#184 in TX, #4,771 nationally) — a middle-class / working-renter tenant base. Strengths: amenities A+, cost of living A+, housing A+; Watch: schools D, crime F.
- Houston ISD (urban): math 27% / reading 35% proficiency, ranked #593 of 826 in TX (top 72%) — families likely to look elsewhere, expect single-tenant / working-renter base with shorter leases; 71% free/reduced lunch — lower-income household profile, screen leases tightly.
- Market conditions: Rents rising (+3.1%/yr); 445 active listings in the ZIP; 31 comparable units currently listed for rent nearby; rentals lingering (median 44d on market — plan ~5-8 weeks vacancy on turnover, expect pricing pressure); 55% of comp listings sitting > 30 days — soft ceiling on asking rent; lower-income renter base — watch delinquency; 29,883 units permitted in Harris County in 2024 (8,621 in 5+ unit buildings).
- This rent runs 32% of the median local income ($39k/yr) — at the standard rent-burdened threshold; future hikes will face affordability resistance.
Forward outlook
- In year one you build about $5k of equity ($726 loan paydown + $4k appreciation (3.9% local appreciation)).
- Harris County population projected at +47% by 2050 — long-run rental-demand tailwind backs the buy-and-hold thesis.
- By year 7, paydown + projected appreciation supports a ~$31k cash-out refi (75% LTV) — recoverable capital for the next deal without selling this one.
Negotiation context
- It's been on market 34 days — a 3% lower offer ($102k) is reasonable based on typical stale-listing flexibility.
- 7 sale attempts since 5y ago with the ask held roughly flat each time — persistent listings suggest the price (not the market) is what's stuck; bring a comps-based counter.
Risks & watch-outs
- Watch-outs: flood insurance adds $427/mo; built in 1940 — expect roof / HVAC / electrical / plumbing capex.
- Climate carrying-cost: in FEMA flood zone AE (mandatory federal flood insurance); severe wind risk, 99% chance of damaging wind over 30y; extreme-heat days projected 7→23/yr by 2055 (HVAC capex compounding) — expect insurance premiums to compound above CPI over the hold.
Questions for the listing agent
- What do current leases actually rent for vs. the listed asking? Can we see a recent rent roll and the last 12 months of T-12 income?
- It's been on market 34 days. Have you received any prior offers? Is the seller open to a 61% concession, seller financing, or rate buy-down credit?
- Built in 1940 — when were the roof, HVAC, electrical panel, plumbing, and water heater last replaced?
- What's the actual annual flood-insurance premium (NFIP or private), and is the property in a SFHA with mandatory coverage?
- Is there a deadline driving the sale (1031 exchange, divorce, estate, relocation)? That informs how much negotiation room exists.
- Schools are D-rated, which usually means shorter tenancies and higher turnover. Who's the typical renter profile here, and what's been the actual vacancy rate?
- Crime grade is F in this area — have there been break-ins, vandalism, or insurance claims at this property in the last 3 years? What carrier currently insures it and at what premium?
- What's the average days-on-market for RENTAL listings here right now (not sales)? A rising rental-DOM trend means longer vacancies and softer asking-rent achievability than the comps imply.
- What's the recent tenant-quality profile in this submarket — average credit score on applications, eviction rate, late-payment / NSF rate, and stable-employment percentage? A property-management company in the area should have these aggregated.
- How much new for-sale + rental construction is in the pipeline within 1–3 miles? Heavy new supply typically softens prices + rents 12–24 months out; constrained supply supports both.
Investment metrics
- 1% rule
- 0.99% ✗
- Cap rate
- 6.89%
- Cash-on-cash
- 2.14%
- DSCR
- 1.10
- GRM
- 8.4
CMA / ARV
- ARV (median comp)
- $126,384
- List price
- $104,995
- Delta
- -16.92%
- Verdict
- UNDERPRICED
- Comps
- 20 within 1.0 mi
Show comp detail 9 sales within ~0.75 mi
| Address | Dist | Beds/Ba | Sqft | Sold | Price | $/sf | Match |
|---|---|---|---|---|---|---|---|
| 4010 Falls St | 0.31mi | 2/1.0 | 890 (+6%) | 12mo | $216,500 | $243 | 66 |
| 3011 Retta St | 0.59mi | 3/1.0 (+1) | 792 (-6%) | 6mo | $85,000 | $107 | 53 |
| 4313 Engleford St | 0.53mi | 3/1.0 (+1) | 900 (+7%) | 11mo | $139,900 | $155 | 50 |
| 4811 Falls St | 0.67mi | 2/1.0 | 800 (-5%) | 17mo | $95,000 | $119 | 46 |
| 3114 Kentucky St St | 0.62mi | 2/1.0 | 900 (+7%) | 17mo | $177,900 | $198 | 44 |
| 2705 Brewster St | 0.63mi | 2/1.0 | 720 (-14%) | 6mo | $85,000 | $118 | 42 |
| 3804 Lila St | 0.54mi | 2/2.0 | 732 (-13%) | 11mo | $120,000 | $164 | 41 |
| 2902 Gregg St | 0.43mi | 2/2.0 | 720 (-14%) | 16mo | $153,000 | $213 | 39 |
| 3825 Ranch St | 0.66mi | 2/1.0 | 774 (-8%) | 23mo | $185,000 | $239 | 37 |
Match score weights: distance 35% · size 25% · config 20% · recency 20%. Top-matched comps best support the ARV.
Projected returns pro-forma
3.89% appreciation · 3.08% rent growth · sell at horizon
- IRR
- -3.2%
- Equity multiple
- 0.80×
- Total profit
- $-5,741
- Equity at exit
- $52,577
- IRR
- 1.5%
- Equity multiple
- 1.25×
- Total profit
- $7,492
- Equity at exit
- $85,474
Cash invested: $29,399 (down + closing). Projections, not guarantees.
Landlord ↔ Tenant lean methodology
- Overall (STATE)
- 87 Strongly Landlord-Friendly
- State Texas
- 87 Strongly Landlord-Friendly · R+5
- County
- — inherits STATE
- City
- — inherits STATE
ZIP-level market 77026
- Home prices YoY
- 1.5%
- Rents YoY
- 3.1%
- Active inventory
- 445
- Price-to-rent
- 8.4×
Monthly cashflow live
- Estimated rent
- $1,037 high interval (Pro) →
- Mortgage (P&I)
- −$551
- Tax from tax record
- −$172 /mo · $2,070/yr
- Insurance
- −$44
- Flood insurance flood zone
- −$427 /mo · $5,118/yr
- HOA
- −$0
- Vacancy / Maint / Mgmt
- −$218
- Net cashflow
- $-374
Break-even live
UW: 25.0% down · 7.5% · 30yr · 1.5% tax · 5.0% vac · 8.0% maint · 8.0% mgmt
Financing live
Cash to close
- Down payment
- $26,249
- Closing costs
- $3,150
- Reserves months
- —
- Total cash needed
- —
Loan-product check · same deal, 3 products live
Conventional
25% down · 7.5% · 30yr
- Down + closing
- —
- Monthly P&I
- —
- Monthly cashflow
- —
- DSCR
- —
- Eligible?
- —
Personal DTI + credit; lowest rate.
DSCR
20% down · 8.5% · 30yr
- Down + closing
- —
- Monthly P&I
- —
- Monthly cashflow
- —
- DSCR
- —
- Eligible?
- —
No personal income docs; deal must DSCR.
Hard money
10% down · 12.0% · 12mo
- Down + closing
- —
- Monthly P&I
- —
- Monthly cashflow
- —
- DSCR
- —
- Eligible?
- —
Short-term bridge; refi at stabilization.
Rent comps 31 comps
| Address | Beds | Baths | Sqft | Rent | $/sqft | DOM | Units | Dist |
|---|---|---|---|---|---|---|---|---|
| 4203 Hirsch Rd Unit 5 Houston, TX | 2.0 | 1.0 | 758 | $950 | $1.25 | 44d | 1 | 0.46mi |
| 4111 Cavalcade St Unit 5 Houston, TX | 2.0 | 1.0 | 757 | $825 | $1.09 | 44d | 1 | 0.50mi |
| 3019 Florida St Houston, TX | 2.0 | 1.0 | 576 | $950 | $1.65 | 44d | 1 | 0.53mi |
| 3813 Wipprecht St Houston, TX | 2.0 | 1.0 | 750 | $1,200 | $1.60 | 24d | 1 | 0.75mi |
| 3805 Wipprecht St Houston, TX | 2.0 | 1.0 | 768 | $1,100 | $1.43 | 19d | 1 | 0.75mi |
| 3814 Wipprecht St Unit 18B Houston, TX | 1.0 | 1.0 | 750 | $700 | $0.93 | 16d | 1 | 0.79mi |
| 3806 Wipprecht St Houston, TX | 1.0 | 1.0 | 750 | $700 | $0.93 | 14d | 1 | 0.79mi |
| 3502 Campbell St Houston, TX | 2.0 | 1.0 | 725 | $800 | $1.10 | 44d | 1 | 0.85mi |
| 1710 Shelby St Houston, TX | 2.0 | 1.0 | 688 | $1,250 | $1.82 | 44d | 1 | 0.95mi |
| 5006 Cavalcade St Apt 2 Houston, TX | 1.0 | 1.0 | 541 | $850 | $1.57 | 44d | 1 | 0.95mi |
| 3919 Elysian St Unit 4 Houston, TX | 1.0 | 1.0 | 650 | $1,250 | $1.92 | 44d | 1 | 1.00mi |
| 3031 Sumpter St Unit 50 Houston, TX | 2.0 | 1.0 | 732 | $1,200 | $1.64 | 24d | 1 | 1.07mi |
| 5430 Makeig St Houston, TX | 2.0 | 1.0 | 749 | $650 | $0.87 | 24d | 1 | 1.17mi |
| 5436 Makeig St Houston, TX | 2.0 | 1.0 | 749 | $650 | $0.87 | 24d | 1 | 1.17mi |
| 3816 Gano St Unit B Houston, TX | 1.0 | 1.0 | 700 | $1,150 | $1.64 | 44d | 1 | 1.19mi |
| 5462 Makeig St Houston, TX | 2.0 | 1.0 | 749 | $650 | $0.87 | 24d | 1 | 1.20mi |
| 5506 Crane St Apt 2 Houston, TX | 2.0 | 1.0 | 800 | $750 | $0.94 | 44d | 1 | 1.21mi |
| 5117 Lavender St Houston, TX | 2.0–3.0 | 1.0 | 780 | $1,040 | $1.33 | 20d | 2 | 1.21mi |
| 5117 Lavender St Houston, TX | 2.0 | 1.0 | 740 | $1,040 | $1.41 | 8d | 4 | 1.21mi |
| 5117 Lavender St Houston, TX | 2.0 | 1.0 | 740 | $1,065 | $1.44 | 15d | 8 | 1.21mi |
| 5504 Morwood St Houston, TX | 2.0 | 1.0 | 749 | $850 | $1.13 | 24d | 1 | 1.23mi |
| 5510 Morwood St Houston, TX | 2.0 | 1.0 | 749 | $650 | $0.87 | 24d | 1 | 1.25mi |
| 5514 Morgood St Houston, TX | 2.0 | 1.0 | 749 | $650 | $0.87 | 44d | 1 | 1.26mi |
| 2202 Solo St Houston, TX | 2.0 | 1.0 | 620 | $1,200 | $1.94 | 44d | 1 | 1.31mi |
| 4903 Noble St Houston, TX | 2.0 | 1.0 | 525 | $1,200 | $2.29 | 44d | 1 | 1.31mi |
| 5414 Pardee St Houston, TX | 3.0 | 2.0 | 1100 | $1,500 | $1.36 | 44d | 1 | 1.34mi |
| 3730 Lyons Ave Unit 216 Houston, TX | 3.0 | 2.0 | 1107 | $1,300 | $1.17 | 44d | 1 | 1.34mi |
| 2704 Sam Wilson St Unit 1391353P Houston, TX | 2.0 | 2.0 | 1001 | $1,916 | $1.91 | 8d | 1 | 1.38mi |
| 1714 Mary St Houston, TX | 2.0 | 2.0 | 1100 | $2,400 | $2.18 | 44d | 1 | 1.41mi |
| 2209 Gano St Unit 4 Houston, TX | 2.0 | 1.0 | 700 | $1,250 | $1.79 | 44d | 1 | 1.50mi |
| 2209 Gano St Unit 3 Houston, TX | 2.0 | 1.0 | 700 | $1,200 | $1.71 | 44d | 1 | 1.50mi |
Listing history 36 events
-
2026-06-10days on market $104,995 Active 34 DOM
-
2026-06-08days on market $104,995 Active 33 DOM
-
2026-06-07days on market $104,995 Active 32 DOM
-
2026-06-04days on market $104,995 Active 29 DOM
-
2026-06-01days on market $104,995 Active 26 DOM
-
2026-05-31days on market $104,995 Active 25 DOM
-
2026-05-14price $104,995 27-char remark
-
2026-05-06$109,995 Active 27-char remark
-
2026-04-30historical
-
2026-04-29price $109,995
-
2026-04-08price $114,995
-
2026-03-28price $119,995
-
2026-03-23price $129,995
-
2026-02-02price $139,995
-
2026-01-14$149,900 Active
-
2025-12-31historical
-
2025-07-09price $155,000
-
2025-07-08$145,000 Active
-
2025-04-01soldstatus
-
2024-02-16soldstatus Sold
-
2024-02-09soldstatus
-
2024-01-09price $145,000
-
2023-12-27$129,500 Active
-
2023-12-08historical
-
2023-11-07price $129,500
-
2023-10-25price $139,500
-
2023-09-14price $145,000
-
2023-06-15soldstatus
-
2023-06-14soldstatus
-
2023-06-08$155,000 Active
-
2023-04-24soldstatus
-
2021-10-11status Active
-
2021-10-11historical
-
2021-07-22status Pending
-
2021-07-16$52,000 Active
-
1988-01-02soldstatus
ⓘ Source: listings_history table (triggers on properties + properties_extension) + one-shot
backfill from property_details.listing_events for pre-trigger history.
Tax reassessment forecast TX · Resets to sale price
- Current annual tax
- $2,070 · $172/mo
- Projected year-2 tax
- $2,070 · $172/mo
- Expected delta
- $0/yr ($0/mo · 0.0%)
ⓘ Screening estimate from a state-policy table — verify with the county assessor before closing.
Climate risk First Street
- Flood 4/10 Moderate FEMA zone AE · 21% chance over 30 yrs
- Wildfire 1/10 Low
- Heat 9/10 Extreme 7 d/yr ≥109°F today · 23 d/yr by 30 yrs out
- Wind 9/10 Extreme 99% chance of damaging wind over 30 yrs
- Air quality 3/10 Moderate 2 unhealthy d/yr today · 3 by 30 yrs out
Nearby sold comps map
Loading sold comps map…
Walkable amenities ~0.75 mi
Loading nearby amenities…
Taxation est. · year 1
- Rental income
- $12,446
- − Mortgage interest
- −$5,881
- − Property taxes
- −$2,070
- − Insurance
- −$5,643
- − Repairs & maintenance
- −$996
- − Management
- −$996
- − Depreciation
- −$3,054
- Taxable loss
- −$6,194
- Est. tax savings @ 24.0%
- +$1,487
- After-tax cash flow
- $-3,002/yr
For passive investors: Depreciation is non-cash, so a rental often shows a tax loss while cash-flowing — sheltering income. Rental losses are passive: they offset passive income freely, and up to $25,000/yr can offset ordinary (W-2) income if you actively participate and your MAGI is under $100k (phasing out to $0 by $150k); unused losses carry forward. On sale, claimed depreciation is recaptured at up to 25%, and gains may owe capital-gains tax (a 1031 exchange can defer both). Figures are a year-1 estimate at your 24.0% rate — not tax advice; consult a CPA.
Schools (NCES district)
- District
- Houston ISD
- NCES district ID
- 4823640
- Math proficiency
- 27% ▼ -18.00%
- Reading proficiency
- 35% ▼ -6.00%
- Median HH income
- $46,054
- Composite
- 26.63/100
- National rank
- #7173
- State rank
- #593 of 826 in TX
Livability — Houston
- Score
- 74/100
- State rank
- #184
- US rank
- #4771
Category grades
Schools grade is shown separately in the Schools card above.
Census & demographics
- Census place
- Houston, TX
- County
- Harris County · 4,702,590 people
- City population
- 3,226,434
- Metro
- Houston-The Woodlands-Sugar Land, TX
- Population (ZIP)
- 21,981
- Household income
- $39,211
- Rent vs Own
- Severe rent burden
- 1531.0
Population outlook (Harris County) Hauer SSP2
- Today (2025)
- 5,571,493 people
- By 2030
- 6,089,821 · +9.3%
- By 2040
- 7,142,806 · +28.2%
- By 2050
- 8,185,864 · +46.9%
- By 2075
- 10,574,329 · +89.8%
- By 2100
- 12,109,958 · +117.4%
Race, ethnicity, and origin ACS 2023
- Neighborhood character
- Diverse neighborhood (Simpson 0.56)
- Race & ethnicity
- Black 49% Hispanic / Latino 44% Two or more races 18% White 5% Native American 1%
- Hispanic origin (detail)
- Mexican 34%
- Common ancestry
- Lithuanian 1%
- Foreign-born
- 15% · Canada
- Languages at home
- 61% English-only · Spanish 39%
Political lean MEDSL · Harris
- 2024 margin
- Lean D (+5.5) · D 52.0% · R 46.4% · Other 1.6%
- 2008→2024 swing
- +3.9pp toward D · 2008: 1.6pp · 2024: 5.5pp
- All cycles
- 2024: D+5.5 2020: D+13.3 2016: D+12.4 2012: D+0.1 2008: D+1.6
Not yet ingested
- Civics
- —
Market trends
- HPI YoY
- ▲ 3.89%
- Current HPI
- 267.5995
- Rent YoY
- ▲ 3.08%
- Metro
- Houston-The Woodlands-Sugar Land, TX
- State GDP YoY
- ▲ 3.95%
- F500 in state
- 110
Industry mix (Fortune 500 HQ in TX)
| Industry | F500 HQs | Revenue |
|---|---|---|
| Energy | 16 | $1,198B |
|
||
| Technology | 5 | $198B |
|
||
| Engineering / Construction | 4 | $72B |
|
||
| Energy Services | 3 | $60B |
|
||
| Utilities | 3 | $41B |
|
||
| Healthcare | 2 | $330B |
|
||
Price history
+101.9% since first listed32 events — show timeline
- 2026-06-10 Listing Removed — HARMLS
- 2026-06-05 Sold (Public Records) — Public Records
- 2026-05-14 Price Changed $104,995 HARMLS
- 2026-05-06 Listed $109,995 HARMLS
- 2026-04-30 Listing Removed — HARMLS
- 2026-04-29 Price Changed $109,995 HARMLS
- 2026-04-08 Price Changed $114,995 HARMLS
- 2026-03-28 Price Changed $119,995 HARMLS
- 2026-03-23 Price Changed $129,995 HARMLS
- 2026-02-02 Price Changed $139,995 HARMLS
- 2026-01-14 Listed $149,900 HARMLS
- 2025-12-31 Listing Removed — HARMLS
- 2025-07-09 Price Changed $155,000 HARMLS
- 2025-07-08 Listed $145,000 HARMLS
- 2025-04-01 Sold (Public Records) — Public Records
- 2024-02-16 Sold (MLS) — HARMLS
- 2024-02-09 Sold (Public Records) — Public Records
- 2024-01-09 Price Changed $145,000 HARMLS
- 2023-12-27 Listed $129,500 HARMLS
- 2023-12-08 Listing Removed — HARMLS
- 2023-11-07 Price Changed $129,500 HARMLS
- 2023-10-25 Price Changed $139,500 HARMLS
- 2023-09-14 Price Changed $145,000 HARMLS
- 2023-06-15 Sold (Public Records) — Public Records
- 2023-06-14 Sold (Public Records) — Public Records
- 2023-06-08 Listed $155,000 HARMLS
- 2023-04-24 Sold (Public Records) — Public Records
- 2021-10-11 Relisted — HARMLS
- 2021-10-11 Listing Removed — HARMLS
- 2021-07-22 Pending — HARMLS
- 2021-07-16 Listed $52,000 HARMLS
- 1988-01-02 Sold (Public Records) — Public Records
Property tax history
+12.2%/yrLatest (2025): $2,070 · +15.3% YoY. Source: county tax records.
Cash-flow waterfall
monthlySold comps — $/sqft
last 12 mo · ≤1 miLoading sold comps…