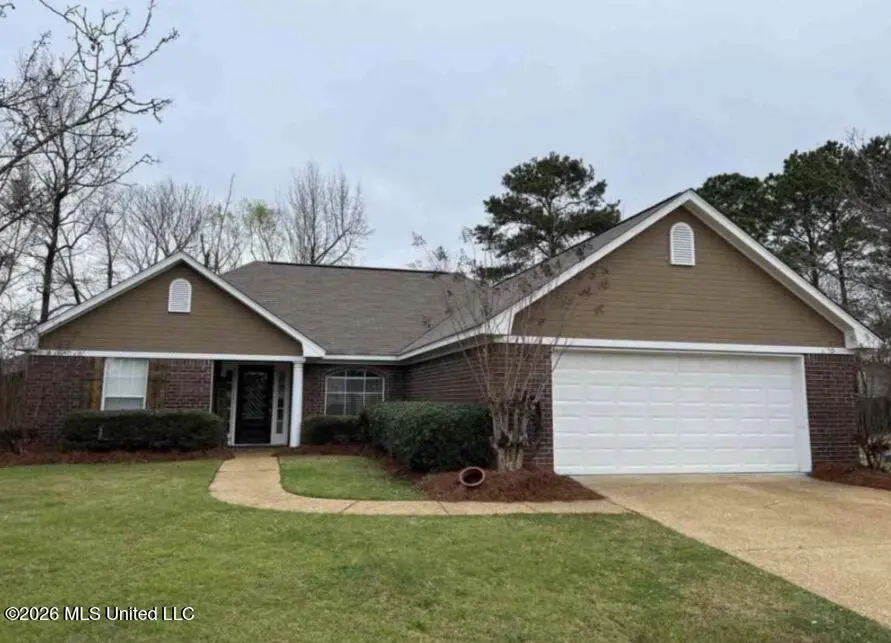
735 Prominence Dr · Flowood, MS
Flood risk 1/10 · Minimal
- FEMA flood zone
- X (shaded)
- Chance of flooding over 30 yrs
- 0.0%
- Est. flood insurance / yr
- $507 – $1,088
Fire risk 3/10 · Minor
- Est. fire insurance / yr
- $1,241 – $2,305
Heat risk 8/10 · Major
- Hot days now (above 108°F)
- 7 days/yr
- Hot days in 30 yrs
- 21 days/yr
Wind risk 8/10 · Major
- Chance of severe wind over 30 yrs
- 80.0%
Air-quality risk 2/10 · Minimal
- Unhealthy air days now
- 0 days/yr
- Unhealthy air days in 30 yrs
- 1 days/yr
Risk factors via First Street. Map © Google.
Why this score? — see what drove the D- grade
The composite is a weighted blend of 9 inputs, each scored 0–100. Each bar is that input's sub-score; the figure is the points it added to the 100-point composite (weight × sub-score).
- Cash flow +9.1/30.0
- Appreciation +5.4/10.0
- ARV discount +4.7/15.0
- Schools +4.6/10.0
- Rent growth +4.1/5.0
- Livability +3.9/5.0
- DSCR +2.5/10.0
- Condition / age +2.5/5.0
- 1% rule +1.9/10.0
$278,500
🖨 Deal sheet (PDF) 📄 Offer letter ✓ Due diligence
Listing remarks
Move-in ready home located in sought-after Laurelwood Subdivision! This well-maintained 3 bedroom, 2 bath home features an inviting open layout with spacious living areas and great natural light throughout. The kitchen opens to the breakfast area and living room, creating a perfect flow for everyday living and entertaining. The primary suite offers a relaxing soaking tub, separate shower, and walk-in closet. Enjoy outdoor living with a covered patio and large wood deck overlooking the fenced backyard. Additional features include a 2-car garage, attractive curb appeal, and a desirable location right beside Pool #2 with relaxing pool views. Residents of Laurelwood enjoy outstanding neighborho
Key facts
- Wood deck
- Pool views
- Soaking tub
Tags
Property features AI
Finance
- HOA & community: Homeowners association (has association); Community clubhouse; Community pool; Fitness center; Hiking/walking trails; Lake; Fishing; Barbecue area; Street lights; Near entertainment
Exterior
- Parking: 2-car garage; Garage door opener; Concrete driveway
- Security: Smoke detectors; Other security features
- Utilities: Public water; Public sewer; Cable available; Electricity connected
- Home design: Single-family house; One level; Move-in ready
- Construction: Brick and siding construction; Conventional foundation; Built (year source: appraiser)
- Exterior features: Asphalt shingle roof; Back yard wood fencing; Corner lot; Cul-de-sac lot; Fenced yard; Front yard; Landscaped; Views; Other exterior features
Interior
- Kitchen: Free-standing electric range; Refrigerator
- Flooring: Laminate; Tile
- Bathrooms: 2 full bathrooms
- Heating & cooling: Central heating; Central air conditioning
- Interior features: Eat-in kitchen; Open floorplan; Pantry; Soaking tub; Double vanity; Blinds; Living room fireplace
- Laundry & utility: Washer hookup; Dryer hookup (electric); Inside laundry room
Neighborhood map
What this means for you Summary
Snapshot
- This is a 3-bed/2.0-bath single-family listed at $278k.
Deal economics
- At list price, monthly cash flow is $-213 ($-3k/yr) — negative.
- To cash-flow at today's rent, offer at most $241k (13.5% below list).
- To meet the 1% rule (rent ≥ 1% of price), the offer needs to be $192k (31.1% below list).
- Recommended offer: $192k (31.1% below list) — sets the bar for 1% rule.
- Cap rate 5.4% vs local median 4.3% in Flowood — meaningfully above typical; check what's discounted (condition, days-on-market, listing class) to confirm the premium yield is real.
Location & tenants
- Location reads 77/100 on livability (#10 in MS, #3,075 nationally) — a middle-class / working-renter tenant base. Strengths: crime A+, cost of living A+, housing A+; Watch: amenities F, commute F.
- Rankin County School District (rural): math 56% / reading 48% proficiency, ranked #6 of 130 in MS (top 5%) — acceptable for families but not a draw, mixed tenant base, ~2y average lease.
- Zoned schools: Flowood Elementary School (math 48% / reading 51%, grade D, #65 of 375 statewide, top 20%, 489 students, 99% FRL); Northwest Rankin Middle School (math 63% / reading 51%, grade B, #13 of 179 statewide, top 7%, 1,374 students, 100% FRL); Northwest Rankin High School (math 48% / reading 42%, grade D-, #34 of 197 statewide, top 17%, 1,898 students, 100% FRL) — zoned schools average 100% FRL vs 35% district-wide (65 pts higher); higher-poverty schools than district average — tighter screening recommended.
- Market conditions: Rents rising fast (+6.6%/yr); 158 active listings in the ZIP; 7 comparable units currently listed for rent nearby; rentals lingering (median 46d on market — plan ~5-8 weeks vacancy on turnover, expect pricing pressure); 57% of comp listings sitting > 30 days — soft ceiling on asking rent; solid renter incomes; 343 units permitted in Rankin County in 2024 (0 in 5+ unit buildings).
Forward outlook
- In year one you build about $4k of equity ($2k loan paydown + $2k appreciation (0.8% local appreciation)).
- Rankin County population projected at +17% by 2050 — long-run rental-demand tailwind backs the buy-and-hold thesis.
- By year 8, paydown + projected appreciation supports a ~$34k cash-out refi (75% LTV) — recoverable capital for the next deal without selling this one.
Negotiation context
- Only 4 days on market — expect competitive offers; lowballing is unlikely to land.
Risks & watch-outs
- Climate carrying-cost: severe wind risk, 80% chance of damaging wind over 30y; extreme-heat days projected 7→21/yr by 2055 (HVAC capex compounding) — expect insurance premiums to compound above CPI over the hold.
Questions for the listing agent
- What do current leases actually rent for vs. the listed asking? Can we see a recent rent roll and the last 12 months of T-12 income?
- What does the HOA fee cover, when was the last increase, and are there any pending special assessments or reserve-fund shortfalls?
- Is there a deadline driving the sale (1031 exchange, divorce, estate, relocation)? That informs how much negotiation room exists.
- Schools are B-rated — typically a magnet for longer-tenancy family renters. What's the average tenant stay here, and is there a school-zone premium baked into asking?
- The area grade is low — what's the realistic commute time and amenity access for the typical tenant pool here? Any planned neighborhood developments (good or bad) we should know about?
- What's the average days-on-market for RENTAL listings here right now (not sales)? A rising rental-DOM trend means longer vacancies and softer asking-rent achievability than the comps imply.
- What's the recent tenant-quality profile in this submarket — average credit score on applications, eviction rate, late-payment / NSF rate, and stable-employment percentage? A property-management company in the area should have these aggregated.
- How much new for-sale + rental construction is in the pipeline within 1–3 miles? Heavy new supply typically softens prices + rents 12–24 months out; constrained supply supports both.
Investment metrics
- 1% rule
- 0.69% ✗
- Cap rate
- 5.37%
- Cash-on-cash
- -3.29%
- DSCR
- 0.85
- GRM
- 12.1
CMA / ARV
- ARV (on-the-fly)
- $262,422
- Comps found
- 12
Show comp detail 12 sales within ~0.75 mi
| Address | Dist | Beds/Ba | Sqft | Sold | Price | $/sf | Match |
|---|---|---|---|---|---|---|---|
| 208 Woodgreen Cv | 0.16mi | 3/2.0 | 1,430 (-0%) | 6mo | $270,000 | $189 | 87 |
| 306 Swan Dr | 0.35mi | 3/2.0 | 1,371 (-4%) | 1mo | $239,900 | $175 | 76 |
| 332 Swan Dr | 0.49mi | 3/2.0 | 1,380 (-4%) | 1mo | $245,000 | $178 | 70 |
| 349 Audubon Cir | 0.13mi | 3/2.0 | 1,252 (-13%) | 4mo | $229,900 | $184 | 69 |
| 3018 Windwood Cir | 0.62mi | 3/2.0 | 1,421 (-1%) | 2mo | $265,000 | $186 | 68 |
| 305 Hemlock Dr | 0.65mi | 3/2.0 | 1,421 (-1%) | 5mo | $259,900 | $183 | 64 |
| 300 Orchard Way | 0.53mi | 3/2.0 | 1,362 (-5%) | 4mo | $239,900 | $176 | 63 |
| 2030 Stockton Pl | 0.40mi | 3/2.0 | 1,305 (-9%) | 5mo | $214,500 | $164 | 63 |
| 500 Ridgeway Dr | 0.58mi | 3/2.0 | 1,360 (-5%) | 3mo | $239,900 | $176 | 62 |
| 424 Timber Ridge Way | 0.65mi | 3/2.0 | 1,365 (-5%) | 3mo | $249,900 | $183 | 59 |
| 1210 Michael St | 0.38mi | 3/2.0 | 1,640 (+14%) | 1mo | $285,000 | $174 | 58 |
| 813 Whippoorwill Dr | 0.71mi | 3/2.0 | 1,347 (-6%) | 0mo | $254,000 | $189 | 57 |
Match score weights: distance 35% · size 25% · config 20% · recency 20%. Top-matched comps best support the ARV.
Projected returns pro-forma
0.79% appreciation · 6.57% rent growth · sell at horizon
- IRR
- -1.0%
- Equity multiple
- 0.95×
- Total profit
- $-4,134
- Equity at exit
- $92,103
- IRR
- 5.9%
- Equity multiple
- 1.76×
- Total profit
- $58,946
- Equity at exit
- $120,130
Cash invested: $77,980 (down + closing). Projections, not guarantees.
Landlord ↔ Tenant lean methodology
- Overall (STATE)
- 90 Strongly Landlord-Friendly
- State Mississippi
- 90 Strongly Landlord-Friendly · R+11
- County
- — inherits STATE
- City
- — inherits STATE
ZIP-level market 39232
- Home prices YoY
- 0.5%
- Rents YoY
- 6.6%
- Active inventory
- 158
- Price-to-rent
- 12.1×
Monthly cashflow live
- Estimated rent
- $1,919 high interval (Pro) →
- Mortgage (P&I)
- −$1,460
- Tax from tax record
- −$127 /mo · $1,524/yr
- Insurance
- −$116
- HOA
- −$26
- Vacancy / Maint / Mgmt
- −$403
- Net cashflow
- $-213
Break-even live
Sensitivity live
| Price | -10% $-56 | -5% $-135 | +0% $-213 | +5% $-292 | +10% $-371 |
|---|---|---|---|---|---|
| Rent | -10% $-365 | -5% $-289 | +0% $-213 | +5% $-138 | +10% $-62 |
| Rate | -1.0pp $-73 | -0.5pp $-143 | base $-213 | +0.5pp $-286 | +1.0pp $-359 |
UW: 25.0% down · 7.5% · 30yr · 1.5% tax · 5.0% vac · 8.0% maint · 8.0% mgmt
Financing live
Cash to close
- Down payment
- $69,625
- Closing costs
- $8,355
- Reserves months
- —
- Total cash needed
- —
Loan-product check · same deal, 3 products live
Conventional
25% down · 7.5% · 30yr
- Down + closing
- —
- Monthly P&I
- —
- Monthly cashflow
- —
- DSCR
- —
- Eligible?
- —
Personal DTI + credit; lowest rate.
DSCR
20% down · 8.5% · 30yr
- Down + closing
- —
- Monthly P&I
- —
- Monthly cashflow
- —
- DSCR
- —
- Eligible?
- —
No personal income docs; deal must DSCR.
Hard money
10% down · 12.0% · 12mo
- Down + closing
- —
- Monthly P&I
- —
- Monthly cashflow
- —
- DSCR
- —
- Eligible?
- —
Short-term bridge; refi at stabilization.
Rent comps 7 comps
| Address | Beds | Baths | Sqft | Rent | $/sqft | DOM | Units | Dist |
|---|---|---|---|---|---|---|---|---|
| 224 Jacks Pl Brandon, MS | 3.0 | 2.0 | 1512 | $2,100 | $1.39 | 45d | 1 | 0.14mi |
| 508 Stockton Cv Flowood, MS | 3.0 | 2.0 | 1271 | $1,806 | $1.42 | 45d | 1 | 0.42mi |
| 1703 Old Fannin Rd Flowood, MS | 2.0 | 2.0 | 950 | $1,174 | $1.24 | 25d | 1 | 0.84mi |
| 1703 Old Fannin Rd Flowood, MS | 2.0 | 2.0 | 950 | $1,166 | $1.23 | 45d | 1 | 0.84mi |
| 1703 Old Fannin Rd Flowood, MS | 2.0 | 2.0 | 950 | $1,207 | $1.27 | 15d | 1 | 0.84mi |
| 146 Tradition Pkwy Flowood, MS | 3.0 | 2.0 | 1786 | $2,495 | $1.40 | 23d | 1 | 0.98mi |
| 301 Jasmine Ct Brandon, MS | 3.0 | 2.0 | 1805 | $2,200 | $1.22 | 45d | 1 | 1.36mi |
HOA detail
- Monthly dues
- $26 · $312/yr
- Likely covers
- pool
Listing history 5 events
-
2026-06-01status $278,500 Pending 4 DOM
-
2026-05-31days on market $278,500 Active 4 DOM
-
2026-05-30days on market $278,500 Active 3 DOM
-
2026-05-27$278,500 Active
-
2022-04-01soldstatus
ⓘ Source: listings_history table (triggers on properties + properties_extension) + one-shot
backfill from property_details.listing_events for pre-trigger history.
Tax reassessment forecast MS · Resets to sale price
- Current annual tax
- $1,524 · $127/mo
- Projected year-2 tax
- $2,200 · $183/mo
- Expected delta
- +$676/yr (+$56/mo · 44.3%)
ⓘ Screening estimate from a state-policy table — verify with the county assessor before closing.
Climate risk First Street
- Flood 1/10 Low FEMA zone X (shaded) · 0% chance over 30 yrs
- Wildfire 3/10 Moderate
- Heat 8/10 Severe 7 d/yr ≥108°F today · 21 d/yr by 30 yrs out
- Wind 8/10 Severe 80% chance of damaging wind over 30 yrs
- Air quality 2/10 Low 0 unhealthy d/yr today · 1 by 30 yrs out
Nearby sold comps map
Loading sold comps map…
Walkable amenities ~0.75 mi
Loading nearby amenities…
Taxation est. · year 1
- Rental income
- $23,029
- − Mortgage interest
- −$15,600
- − Property taxes
- −$1,524
- − Insurance
- −$1,392
- − Repairs & maintenance
- −$1,842
- − Management
- −$1,842
- − HOA
- −$312
- − Depreciation
- −$8,102
- Taxable loss
- −$7,587
- Est. tax savings @ 24.0%
- +$1,821
- After-tax cash flow
- $-741/yr
For passive investors: Depreciation is non-cash, so a rental often shows a tax loss while cash-flowing — sheltering income. Rental losses are passive: they offset passive income freely, and up to $25,000/yr can offset ordinary (W-2) income if you actively participate and your MAGI is under $100k (phasing out to $0 by $150k); unused losses carry forward. On sale, claimed depreciation is recaptured at up to 25%, and gains may owe capital-gains tax (a 1031 exchange can defer both). Figures are a year-1 estimate at your 24.0% rate — not tax advice; consult a CPA.
Schools (NCES district)
- District
- Rankin County School District
- NCES district ID
- 2803830
- Math proficiency
- 56% ▼ -4.00%
- Reading proficiency
- 48% ▼ -6.00%
- Median HH income
- $61,867
- Composite
- 45.62/100
- National rank
- #2587
- State rank
- #6 of 130 in MS
Livability — Flowood
- Score
- 77/100
- State rank
- #10
- US rank
- #3075
Category grades
Schools grade is shown separately in the Schools card above.
Census & demographics
- County
- Rankin County · 123,614 people
- City population
- 9,222
- Metro
- Jackson, MS
- Population (ZIP)
- 9,222
- Household income
- $82,931
- Rent vs Own
- Severe rent burden
- 731.0
Population outlook (Rankin County) Hauer SSP2
- Today (2025)
- 164,317 people
- By 2030
- 171,013 · +4.1%
- By 2040
- 182,723 · +11.2%
- By 2050
- 192,376 · +17.1%
- By 2075
- 209,535 · +27.5%
- By 2100
- 209,534 · +27.5%
Race, ethnicity, and origin ACS 2023
- Neighborhood character
- Majority White (63%)
- Race & ethnicity
- White 63% Black 27% Hispanic / Latino 4% Asian 4% Two or more races 4%
- Common ancestry
- Italian 6% Lithuanian 3% Slovak 2%
- Foreign-born
- 5% · Canada, China, South Korea
- Languages at home
- 92% English-only · Spanish 2% Other Asian/Pacific 2% German/W. Germanic 1%
Political lean MEDSL · Rankin
- 2024 margin
- Solid R (+47.1) · D 25.9% · R 73.0% · Other 1.0%
- 2008→2024 swing
- +6.4pp toward D · 2008: -53.5pp · 2024: -47.1pp
- All cycles
- 2024: R+47.1 2020: R+45.4 2016: R+52.9 2012: R+51.9 2008: R+53.5
Not yet ingested
- Civics
- —
Market trends
- HPI YoY
- ▲ 0.79%
- Current HPI
- 163.9292
- Rent YoY
- ▲ 6.57%
- Metro
- Jackson, MS
- State GDP YoY
- —
- F500 in state
- 0
Price history
2 events — show timeline
- 2026-05-27 Listed $278,500 MLSU
- 2022-04-01 Sold (Public Records) — Public Records
Property tax history
+2.4%/yrLatest (2025): $1,524 · +1.9% YoY. Source: county tax records.
Cash-flow waterfall
monthlySold comps — $/sqft
last 12 mo · ≤1 miLoading sold comps…