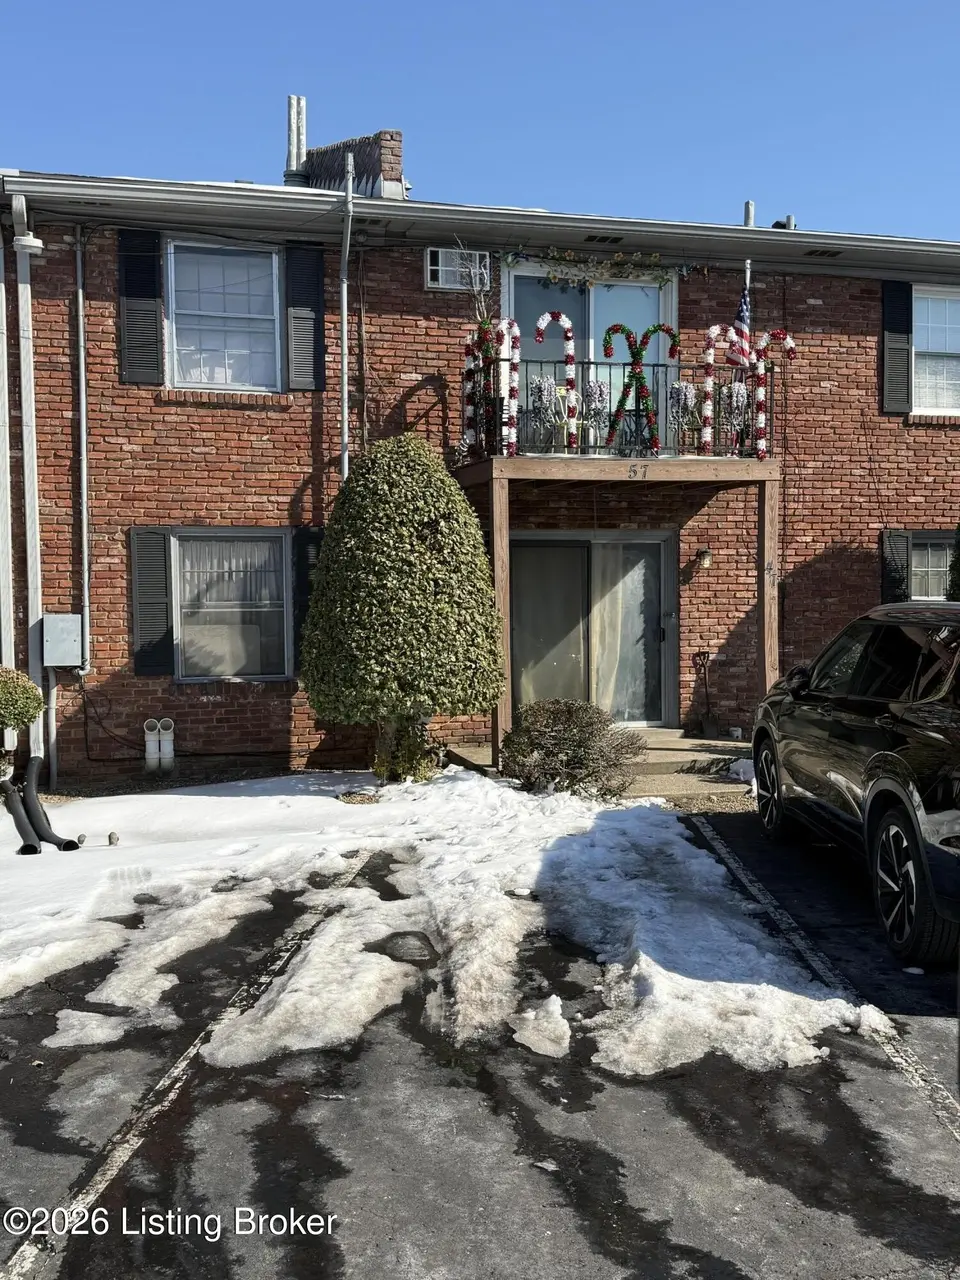
1924 Goldsmith Ln Unit 47 · Louisville, KY
Flood risk 1/10 · Minimal
- FEMA flood zone
- X (unshaded)
- Chance of flooding over 30 yrs
- 0.0%
- Est. flood insurance / yr
- $507 – $1,088
Fire risk 1/10 · Minimal
- Est. fire insurance / yr
- $839 – $1,559
Heat risk 5/10 · Moderate
- Hot days now (above 105°F)
- 7 days/yr
- Hot days in 30 yrs
- 20 days/yr
Wind risk 2/10 · Minimal
- Chance of severe wind over 30 yrs
- 2.0%
Air-quality risk 3/10 · Minor
- Unhealthy air days now
- 3 days/yr
- Unhealthy air days in 30 yrs
- 5 days/yr
Risk factors via First Street. Map © Google.
Why this score? — see what drove the D grade
The composite is a weighted blend of 9 inputs, each scored 0–100. Each bar is that input's sub-score; the figure is the points it added to the 100-point composite (weight × sub-score).
- Cash flow +15.0/30.0
- ARV discount +7.5/15.0
- 1% rule +5.0/10.0
- DSCR +5.0/10.0
- Livability +3.2/5.0
- Condition / age +2.5/5.0
- Schools +2.3/10.0
- Rent growth +1.6/5.0
- Appreciation +0.0/10.0
$1
🖨 Deal sheet 📄 Offer letter ✓ Due diligence
Listing remarks MLS
CONVENIENT LOCATION, POOL, COIN LAUNDRY IN BASEMENT, REFRIGERATOR, RANGE AND DISHWASHER REMAIN, MIRRORED DOOR ON CLOSET IN BEDROOM
Key facts
- $8 HOA
- Pool
- Built 1974
Property features AI
Finance
- HOA & community: Association present with a monthly maintenance fee of $100
Exterior
- Parking: See remarks for parking details
- Utilities: Utilities: Other
- Home design: Residential auction property; One-story
- Construction: Built in 1974; Shingle roof; Poured concrete foundation
- Exterior features: Patio-style property; Subdivision: HOLLY HOUSE
Interior
- Bedrooms: One bedroom located on the first floor; Primary bedroom on the first floor
- Bathrooms: One full bathroom on the first floor
- Heating & cooling: Radiant heating; Central air conditioning
- Interior features: Three total rooms; Three closets; No basement
- Laundry & utility: First-floor laundry
Neighborhood map
What this means for you Summary
Snapshot
- This is a 1-bed/1.0-bath townhouse listed at $1.
Deal economics
- At list price, monthly cash flow is $727 ($9k/yr) — positive.
- The deal already cash-flows at list — no discount required.
- Meets the 1% rule at list price ($931 rent vs $1).
- Cap rate 872910.2% vs local median 5.0% in Louisville — top-decile yield for the area; either an underpriced asset or a hidden risk that comps aren't pricing in. Stress-test before assuming the spread holds.
Location & tenants
- Location reads 63/100 on livability (#333 in KY) — a middle-class / working-renter tenant base. Strengths: cost of living A+, housing A+; Watch: employment C-, health & safety D+, schools D-.
- Jefferson County (urban): math 19% / reading 35% proficiency, ranked #121 of 165 in KY (top 73%) — low school quality limits family demand, transient renter base, plan for 1-2y turnover.
- Market conditions: Rents falling (-3.5%/yr); 100 active listings in the ZIP; 10 comparable units currently listed for rent nearby; rentals at typical pace (median 16d on market — plan ~3-4 weeks tenant-placement turnaround); 2,836 units permitted in Jefferson County in 2024 (1,558 in 5+ unit buildings).
Forward outlook
- Local home prices are declining (-3.0%/yr); year-one equity from $0 of loan paydown is wiped out by about $0 of value loss. Plan a longer hold.
- Jefferson County population projected at +13% by 2050 — modest demand growth; plan on rents tracking national, not racing it.
- At projected returns (-3.0% appreciation + 0.0% rent growth), your $0 cash investment doubles in ~1 year — after that, you're playing with house money.
Negotiation context
- Only 14 days on market — expect competitive offers; lowballing is unlikely to land.
- 2 sale attempts since 28y ago with the ask held roughly flat each time — persistent listings suggest the price (not the market) is what's stuck; bring a comps-based counter.
Risks & watch-outs
- Climate carrying-cost: extreme-heat days projected 7→20/yr by 2055 (HVAC capex compounding) — expect insurance premiums to compound above CPI over the hold.
Questions for the listing agent
- Built in 1974 — when were the roof, HVAC, electrical panel, plumbing, and water heater last replaced?
- What does the HOA fee cover, when was the last increase, and are there any pending special assessments or reserve-fund shortfalls?
- Is there a deadline driving the sale (1031 exchange, divorce, estate, relocation)? That informs how much negotiation room exists.
- Schools are D-rated, which usually means shorter tenancies and higher turnover. Who's the typical renter profile here, and what's been the actual vacancy rate?
- Crime grade is F in this area — have there been break-ins, vandalism, or insurance claims at this property in the last 3 years? What carrier currently insures it and at what premium?
- The area grade is low — what's the realistic commute time and amenity access for the typical tenant pool here? Any planned neighborhood developments (good or bad) we should know about?
- What's the average days-on-market for RENTAL listings here right now (not sales)? A rising rental-DOM trend means longer vacancies and softer asking-rent achievability than the comps imply.
- What's the recent tenant-quality profile in this submarket — average credit score on applications, eviction rate, late-payment / NSF rate, and stable-employment percentage? A property-management company in the area should have these aggregated.
- How much new for-sale + rental construction is in the pipeline within 1–3 miles? Heavy new supply typically softens prices + rents 12–24 months out; constrained supply supports both.
Investment metrics
- 1% rule
- 93092.00% ✓
- Cap rate
- 872910.16%
- Cash-on-cash
- 3117513.81%
- DSCR
- 138712.82
- GRM
- 0.0
CMA / ARV
- ARV (on-the-fly)
- $103,626
- Comps found
- 12
Show comp detail 12 sales within ~0.75 mi
| Address | Dist | Beds/Ba | Sqft | Sold | Price | $/sf | Match |
|---|---|---|---|---|---|---|---|
| 1924 Goldsmith Ln #41 | 0.01mi | 1/1.0 | 550 (-9%) | 4mo | $74,500 | $135 | 81 |
| 1935 Gardiner Ln Unit G97 | 0.43mi | 1/1.0 | 614 (+1%) | 2mo | $105,000 | $171 | 76 |
| 1935 Gardiner Ln Apt B27 | 0.43mi | 1/1.0 | 613 (+1%) | 3mo | $95,000 | $155 | 76 |
| 1935 Gardiner Ln Apt B29 | 0.43mi | 1/1.0 | 614 (+1%) | 4mo | $105,000 | $171 | 74 |
| 1935 Gardiner Ln Unit B18 | 0.43mi | 1/1.0 | 618 (+2%) | 8mo | $129,000 | $209 | 70 |
| 1970 Goldsmith Ln Unit A-4 | 0.32mi | 1/1.0 | 657 (+8%) | 2mo | $65,000 | $99 | 69 |
| 3510 Paragon Ct Unit 13 | 0.41mi | 1/1.0 | 575 (-5%) | 6mo | $76,000 | $132 | 67 |
| 1935 Gardiner Ln Unit F87 | 0.43mi | 1/1.0 | 618 (+2%) | 13mo | $135,000 | $218 | 66 |
| 1935 Gardiner Ln Unit G98 | 0.43mi | 1/1.0 | 614 (+1%) | 15mo | $123,500 | $201 | 65 |
| 3510 Paragon Ct #6 | 0.41mi | 1/1.0 | 575 (-5%) | 12mo | $80,000 | $139 | 62 |
| 1935 Gardiner Ln Apt F84 | 0.43mi | 1/1.0 | 614 (+1%) | 19mo | $120,000 | $195 | 62 |
| 3510 Paragon Ct Unit 3 | 0.41mi | 1/1.0 | 575 (-5%) | 22mo | $75,000 | $130 | 55 |
Match score weights: distance 35% · size 25% · config 20% · recency 20%. Top-matched comps best support the ARV.
Projected returns pro-forma
-3.0% appreciation · 0.0% rent growth · sell at horizon
- IRR
- —
- Equity multiple
- 155788.14×
- Total profit
- $43,620
- Equity at exit
- $0
- IRR
- —
- Equity multiple
- 311338.86×
- Total profit
- $87,175
- Equity at exit
- $0
Cash invested: $0 (down + closing). Projections, not guarantees.
Landlord ↔ Tenant lean methodology
- Overall (STATE)
- 83 Strongly Landlord-Friendly
- State Kentucky
- 83 Strongly Landlord-Friendly · R+16
- County
- — inherits STATE
- City
- — inherits STATE
ZIP-level market 40218
- Rents YoY
- -3.5%
- Active inventory
- 100
Monthly cashflow live
- Estimated rent
- $931 high interval (Pro) →
- Mortgage (P&I)
- −$0
- Tax est. 1.5%
- −$0 /mo · $0/yr
- Insurance
- −$0
- HOA
- −$8
- Vacancy / Maint / Mgmt
- −$195
- Net cashflow
- $727
Break-even live
UW: 25.0% down · 7.5% · 30yr · 1.5% tax · 5.0% vac · 8.0% maint · 8.0% mgmt
Financing live
Cash to close
- Down payment
- $0
- Closing costs
- $0
- Reserves months
- —
- Total cash needed
- —
Loan-product check · same deal, 3 products live
Conventional
25% down · 7.5% · 30yr
- Down + closing
- —
- Monthly P&I
- —
- Monthly cashflow
- —
- DSCR
- —
- Eligible?
- —
Personal DTI + credit; lowest rate.
DSCR
20% down · 8.5% · 30yr
- Down + closing
- —
- Monthly P&I
- —
- Monthly cashflow
- —
- DSCR
- —
- Eligible?
- —
No personal income docs; deal must DSCR.
Hard money
10% down · 12.0% · 12mo
- Down + closing
- —
- Monthly P&I
- —
- Monthly cashflow
- —
- DSCR
- —
- Eligible?
- —
Short-term bridge; refi at stabilization.
Rent comps 10 comps
| Address | Beds | Baths | Sqft | Rent | $/sqft | DOM | Units | Dist |
|---|---|---|---|---|---|---|---|---|
| 3201 Leith Ln Louisville, KY | 1.0–2.0 | 1.0–1.5 | 850 | $879 | $1.03 | 3d | 8 | 0.15mi |
| 3439 Newburg Rd Unit 1 Louisville, KY | 1.0 | 1.0 | 700 | $950 | $1.36 | 23d | 1 | 0.37mi |
| 2007 Terril Ln Louisville, KY | 1.0 | 1.0 | 587 | $862 | $1.47 | 23d | 2 | 0.38mi |
| 2004 Goldsmith Ln Unit 3 Louisville, KY | 2.0 | 1.0 | 750 | $1,050 | $1.40 | 21d | 1 | 0.39mi |
| 2013 Goldsmith Ln Louisville, KY | 1.0 | 1.0 | 675 | $865 | $1.28 | 16d | 1 | 0.46mi |
| 2153 Goldsmith Ln Louisville, KY | 1.0–3.0 | 1.0–2.0 | 950 | $820 | $0.86 | 3d | 10 | 0.79mi |
| 3320 Bardstown Rd Unit V17 Louisville, KY | 1.0 | 1.0 | 554 | $825 | $1.49 | 16d | 1 | 0.83mi |
| 3600 Fountain Dr Louisville, KY | 1.0–3.0 | 1.0 | 675 | $849 | $1.26 | 3d | 30 | 0.92mi |
| 2206 Heather Ln Louisville, KY | 1.0 | 1.0 | 480 | $899 | $1.87 | 16d | 1 | 0.97mi |
| 3715 Ethel Ave Louisville, KY | 1.0 | 1.0 | 600 | $1,400 | $2.33 | 3d | 1 | 1.39mi |
HOA detail
- Monthly dues
- $8 · $96/yr
- Likely covers
- pool
Listing history 4 events
-
2026-05-06status Pending
-
2026-04-22$1 Active
-
1998-12-07soldstatus $31,000 130-char remark
Show marketing remark (130 chars)
CONVENIENT LOCATION, POOL, COIN LAUNDRY IN BASEMENT, REFRIGERATOR, RANGE AND DISHWASHER REMAIN, MIRRORED DOOR ON CLOSET IN BEDROOM
-
1998-10-07$33,500 130-char remark
Show marketing remark (130 chars)
CONVENIENT LOCATION, POOL, COIN LAUNDRY IN BASEMENT, REFRIGERATOR, RANGE AND DISHWASHER REMAIN, MIRRORED DOOR ON CLOSET IN BEDROOM
ⓘ Source: listings_history table (triggers on properties + properties_extension) + one-shot
backfill from property_details.listing_events for pre-trigger history.
Climate risk First Street
- Flood 1/10 Low FEMA zone X (unshaded) · 0% chance over 30 yrs
- Wildfire 1/10 Low
- Heat 5/10 Major 7 d/yr ≥105°F today · 20 d/yr by 30 yrs out
- Wind 2/10 Low 2% chance of damaging wind over 30 yrs
- Air quality 3/10 Moderate 3 unhealthy d/yr today · 5 by 30 yrs out
Nearby sold comps map
Loading sold comps map…
Walkable amenities ~0.75 mi
Loading nearby amenities…
Taxation est. · year 1
- Rental income
- $11,171
- − Mortgage interest
- −$0
- − Property taxes
- −$0
- − Insurance
- −$0
- − Repairs & maintenance
- −$894
- − Management
- −$894
- − HOA
- −$96
- − Depreciation
- −$0
- Taxable income
- $9,288
- Est. tax owed @ 24.0%
- −$2,229
- After-tax cash flow
- $6,500/yr
For passive investors: Depreciation is non-cash, so a rental often shows a tax loss while cash-flowing — sheltering income. Rental losses are passive: they offset passive income freely, and up to $25,000/yr can offset ordinary (W-2) income if you actively participate and your MAGI is under $100k (phasing out to $0 by $150k); unused losses carry forward. On sale, claimed depreciation is recaptured at up to 25%, and gains may owe capital-gains tax (a 1031 exchange can defer both). Figures are a year-1 estimate at your 24.0% rate — not tax advice; consult a CPA.
Schools (NCES district)
- District
- Jefferson County
- NCES district ID
- 2102990
- Math proficiency
- 19% ▼ -17.00%
- Reading proficiency
- 35% ▼ -11.00%
- Median HH income
- $47,885
- Composite
- 23.45/100
- National rank
- #7884
- State rank
- #121 of 165 in KY
Livability — Louisville
- Score
- 63/100
- State rank
- #333
- US rank
- #15887
Category grades
Schools grade is shown separately in the Schools card above.
Census & demographics
- Census place
- Louisville, KY
- County
- Jefferson County · 790,184 people
- City population
- 419,741
- Metro
- Louisville/Jefferson County, KY-IN
- Population (ZIP)
- 33,736
- Household income
- $58,811
- Rent vs Own
- Severe rent burden
- 1590.0
Population outlook (Jefferson County) Hauer SSP2
- Today (2025)
- 823,112 people
- By 2030
- 849,343 · +3.2%
- By 2040
- 895,696 · +8.8%
- By 2050
- 933,630 · +13.4%
- By 2075
- 1,028,262 · +24.9%
- By 2100
- 1,072,675 · +30.3%
Race, ethnicity, and origin ACS 2023
- Neighborhood character
- Diverse neighborhood (Simpson 0.69)
- Race & ethnicity
- White 42% Black 32% Hispanic / Latino 17% Two or more races 16% Asian 4%
- Hispanic origin (detail)
- Mexican 5% Puerto Rican 1% Cuban 7%
- Common ancestry
- Lithuanian 1% Portuguese 1% Swiss 1%
- Foreign-born
- 20% · Canada, India, Jamaica
- Languages at home
- 77% English-only · Spanish 12% Other Indo-European 3% Arabic 1%
Political lean MEDSL · Jefferson
- 2024 margin
- D (+16.6) · D 57.4% · R 40.9% · Other 1.7%
- 2008→2024 swing
- +4.5pp toward D · 2008: 12.0pp · 2024: 16.6pp
- All cycles
- 2024: D+16.6 2020: D+20.1 2016: D+13.3 2012: D+11.1 2008: D+12.0
Not yet ingested
- Civics
- —
Market trends
- HPI YoY
- ▼ -208.23%
- Current HPI
- 257.9528
- Rent YoY
- ▼ -3.47%
- Metro
- Louisville/Jefferson County, KY-IN
- State GDP YoY
- ▲ 1.81%
- F500 in state
- 4
Industry mix (Fortune 500 HQ in KY)
| Industry | F500 HQs | Revenue |
|---|---|---|
| Healthcare | 1 | $118B |
|
||
| Food / Beverage | 1 | $7B |
|
||
Price history
-7.5% since first listed4 events — show timeline
- 2026-05-06 Pending — Metro Search MLS
- 2026-04-22 Listed $1 Metro Search MLS
- 1998-12-07 Sold (MLS) $31,000 Metro Search MLS
- 1998-10-07 Listed $33,500 Metro Search MLS
Property tax history
+4.7%/yrLatest (2025): $916 · +24.0% YoY. Source: county tax records.
Cash-flow waterfall
monthlySold comps — $/sqft
last 12 mo · ≤1 miLoading sold comps…