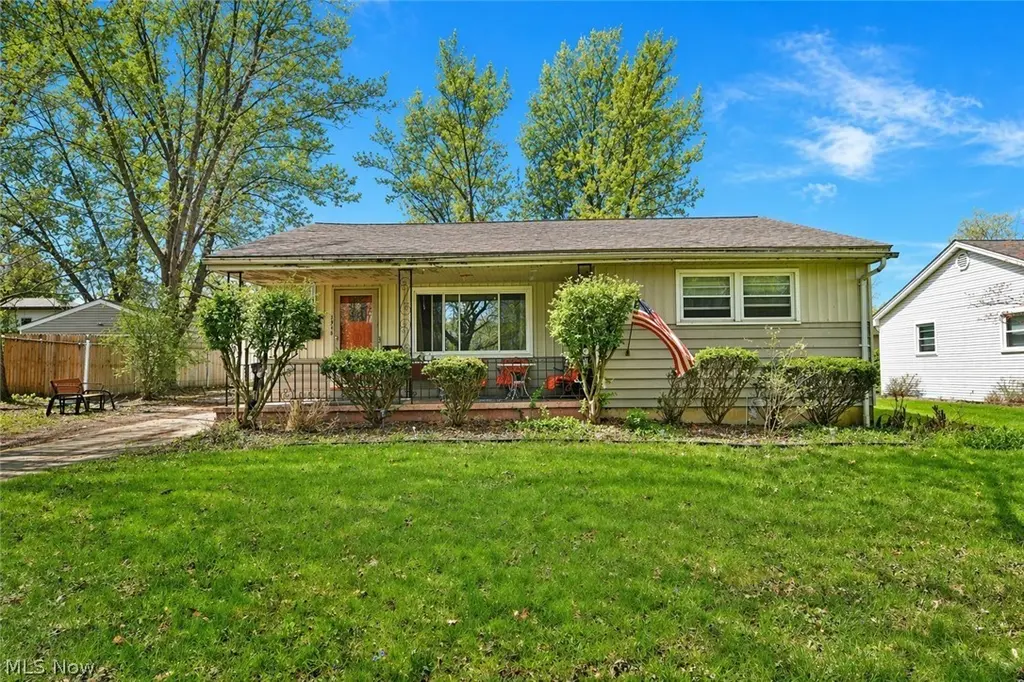
7374 Ranier Trl · Youngstown, OH
Flood risk 1/10 · Minimal
- FEMA flood zone
- X (unshaded)
- Chance of flooding over 30 yrs
- 0.0%
- Est. flood insurance / yr
- $473 – $860
Fire risk 1/10 · Minimal
- Est. fire insurance / yr
- $713 – $1,323
Heat risk 3/10 · Minor
- Hot days now (above 95°F)
- 7 days/yr
- Hot days in 30 yrs
- 17 days/yr
Wind risk 1/10 · Minimal
- Chance of severe wind over 30 yrs
- —
Air-quality risk 2/10 · Minimal
- Unhealthy air days now
- 1 days/yr
- Unhealthy air days in 30 yrs
- 2 days/yr
Risk factors via First Street. Map © Google.
Why this score? — see what drove the C- grade
The composite is a weighted blend of 9 inputs, each scored 0–100. Each bar is that input's sub-score; the figure is the points it added to the 100-point composite (weight × sub-score).
- ARV discount +15.0/15.0
- Cash flow +12.8/30.0
- Schools +5.7/10.0
- Rent growth +4.1/5.0
- Livability +4.0/5.0
- DSCR +3.8/10.0
- 1% rule +3.6/10.0
- Condition / age +2.5/5.0
- Appreciation +0.0/10.0
$129,900
🖨 Deal sheet 📄 Offer letter ✓ Due diligence
Listing remarks
Welcome to 7374 Ranier Trail in Boardman, Ohio! An exceptional investment opportunity in one of the most desirable and convenient locations. Situated just minutes from all Boardman Local Schools and St. Charles, this property offers unbeatable proximity for tenants seeking access to top local education. You'll also enjoy close proximity to the Southern Park Mall, along with a wide variety of shopping, dining, and everyday conveniences. Outdoor enthusiasts will appreciate being just a short drive from all of the scenic beauty and recreational opportunities of Boardman and Mill Creek Parks! This property is ideal for investors looking for immediate, stable income. The home is being offered
Key facts
- Proximity to schools
- Short drive to parks
- 0.23 acre lot
Tags
Property features AI
Exterior
- Parking: Detached garage (1 car)
- Utilities: Public water; Public sewer
- Home design: Single-story house; Block foundation
- Construction: Aluminum and wood siding; Asphalt roof; Built as recorded by appraiser
- Exterior features: Covered patio/porch; Lot approximately 0.23 acres; Faces east
Interior
- Bedrooms: 3 bedrooms on the main level
- Bathrooms: 1 full bathroom on the main level
- Heating & cooling: Forced air heating
- Interior features: Full basement; Covered porch
- Laundry & utility: Laundry in basement
Neighborhood map
What this means for you Summary
Snapshot
- This is a 3-bed/1.0-bath single-family listed at $130k.
Deal economics
- At list price, monthly cash flow is $-12 ($-148/yr) — negative.
- To cash-flow at today's rent, offer at most $128k (1.7% below list).
- To meet the 1% rule (rent ≥ 1% of price), the offer needs to be $112k (13.7% below list).
- Recommended offer: $112k (13.7% below list) — sets the bar for 1% rule.
Location & tenants
- Location reads 81/100 on livability (#99 in OH, #1,506 nationally) — a professional / high-income tenant draw. Strengths: amenities A+, commute A+, cost of living A+; Watch: crime F, employment F.
- Boardman Local (urban): math 63% / reading 71% proficiency, ranked #189 of 656 in OH (top 29%) — acceptable for families but not a draw, mixed tenant base, ~2y average lease.
- Market conditions: Rents rising fast (+6.6%/yr); 136 active listings in the ZIP; 8 comparable units currently listed for rent nearby; rentals at typical pace (median 21d on market — plan ~3-4 weeks tenant-placement turnaround); 147 units permitted in Mahoning County in 2024 (0 in 5+ unit buildings).
Forward outlook
- Local home prices are declining (-3.0%/yr); year-one equity from $898 of loan paydown is wiped out by about $4k of value loss. Plan a longer hold.
- Mahoning County population projected at -14% by 2050 — secular population decline; favor cash flow + early exit over multi-decade hold.
Negotiation context
- It's been on market 57 days — a 3% lower offer ($126k) is reasonable based on typical stale-listing flexibility.
- Current owner paid $60k; list at $130k implies a 116% gain — meaningful room to come down on a strong offer.
Risks & watch-outs
- Watch-outs: built in 1958 — expect roof / HVAC / electrical / plumbing capex.
Questions for the listing agent
- What do current leases actually rent for vs. the listed asking? Can we see a recent rent roll and the last 12 months of T-12 income?
- It's been on market 57 days. Have you received any prior offers? Is the seller open to a 14% concession, seller financing, or rate buy-down credit?
- Built in 1958 — when were the roof, HVAC, electrical panel, plumbing, and water heater last replaced?
- Is there a deadline driving the sale (1031 exchange, divorce, estate, relocation)? That informs how much negotiation room exists.
- Crime grade is F in this area — have there been break-ins, vandalism, or insurance claims at this property in the last 3 years? What carrier currently insures it and at what premium?
- What's the average days-on-market for RENTAL listings here right now (not sales)? A rising rental-DOM trend means longer vacancies and softer asking-rent achievability than the comps imply.
- What's the recent tenant-quality profile in this submarket — average credit score on applications, eviction rate, late-payment / NSF rate, and stable-employment percentage? A property-management company in the area should have these aggregated.
- How much new for-sale + rental construction is in the pipeline within 1–3 miles? Heavy new supply typically softens prices + rents 12–24 months out; constrained supply supports both.
Investment metrics
- 1% rule
- 0.86% ✗
- Cap rate
- 6.18%
- Cash-on-cash
- -0.41%
- DSCR
- 0.98
- GRM
- 9.7
CMA / ARV
- ARV (median comp)
- $159,988
- List price
- $129,900
- Delta
- -18.81%
- Verdict
- UNDERPRICED
- Comps
- 20 within 1.0 mi
Show comp detail 12 sales within ~0.75 mi
| Address | Dist | Beds/Ba | Sqft | Sold | Price | $/sf | Match |
|---|---|---|---|---|---|---|---|
| 7450 Ranier Ave | 0.13mi | 3/1.0 | 1,120 (-3%) | 1mo | $219,000 | $196 | 87 |
| 7387 Oregon Trl | 0.16mi | 3/1.0 | 1,200 (+3%) | 6mo | $125,000 | $104 | 82 |
| 7443 Sugartree Dr | 0.12mi | 3/2.0 | 988 (-15%) | 1mo | $200,000 | $202 | 65 |
| 7427 Westview | 0.39mi | 3/1.5 | 1,216 (+5%) | 10mo | $142,000 | $117 | 64 |
| 7352 Westview Dr | 0.33mi | 3/2.0 | 1,032 (-11%) | 1mo | $139,500 | $135 | 62 |
| 7355 Westview Dr | 0.37mi | 3/2.0 | 1,239 (+7%) | 10mo | $180,000 | $145 | 59 |
| 6721 Glenwood Ave | 0.58mi | 2/1.0 (-1) | 1,141 (-2%) | 8mo | $130,000 | $114 | 58 |
| 107 Oakley Ave | 0.73mi | 3/1.0 | 1,122 (-3%) | 8mo | $152,500 | $136 | 54 |
| 7027 Amherst Ave | 0.54mi | 3/1.0 | 1,308 (+13%) | 1mo | $155,000 | $119 | 52 |
| 7553 Glenwood Ave | 0.35mi | 3/2.0 | 1,332 (+15%) | 7mo | $250,000 | $188 | 49 |
| 31 Rockdale Ave | 0.65mi | 3/1.0 | 1,005 (-13%) | 2mo | $150,000 | $149 | 46 |
| 96 Aylesboro Ave | 0.68mi | 2/2.0 (-1) | 1,003 (-14%) | 1mo | $140,000 | $140 | 36 |
Match score weights: distance 35% · size 25% · config 20% · recency 20%. Top-matched comps best support the ARV.
Projected returns pro-forma
-3.0% appreciation · 6.56% rent growth · sell at horizon
- IRR
- -13.0%
- Equity multiple
- 0.51×
- Total profit
- $-17,662
- Equity at exit
- $19,369
- IRR
- 0.7%
- Equity multiple
- 1.06×
- Total profit
- $2,036
- Equity at exit
- $11,231
Cash invested: $36,372 (down + closing). Projections, not guarantees.
Landlord ↔ Tenant lean methodology
- Overall (STATE)
- 73 Landlord-Friendly
- State Ohio
- 73 Landlord-Friendly · R+6
- County
- — inherits STATE
- City
- — inherits STATE
ZIP-level market 44512
- Home prices YoY
- -21.0%
- Rents YoY
- 6.6%
- Active inventory
- 136
- Price-to-rent
- 9.7×
Monthly cashflow live
- Estimated rent
- $1,121 high interval (Pro) →
- Mortgage (P&I)
- −$681
- Tax from tax record
- −$162 /mo · $1,949/yr
- Insurance
- −$54
- HOA
- −$0
- Vacancy / Maint / Mgmt
- −$235
- Net cashflow
- $-12
Break-even live
UW: 25.0% down · 7.5% · 30yr · 1.5% tax · 5.0% vac · 8.0% maint · 8.0% mgmt
Financing live
Cash to close
- Down payment
- $32,475
- Closing costs
- $3,897
- Reserves months
- —
- Total cash needed
- —
Loan-product check · same deal, 3 products live
Conventional
25% down · 7.5% · 30yr
- Down + closing
- —
- Monthly P&I
- —
- Monthly cashflow
- —
- DSCR
- —
- Eligible?
- —
Personal DTI + credit; lowest rate.
DSCR
20% down · 8.5% · 30yr
- Down + closing
- —
- Monthly P&I
- —
- Monthly cashflow
- —
- DSCR
- —
- Eligible?
- —
No personal income docs; deal must DSCR.
Hard money
10% down · 12.0% · 12mo
- Down + closing
- —
- Monthly P&I
- —
- Monthly cashflow
- —
- DSCR
- —
- Eligible?
- —
Short-term bridge; refi at stabilization.
Rent comps 8 comps
| Address | Beds | Baths | Sqft | Rent | $/sqft | DOM | Units | Dist |
|---|---|---|---|---|---|---|---|---|
| 7125 Locust Ave Unit 7125-11 Youngstown, OH | 2.0 | 1.0 | 880 | $950 | $1.08 | 20d | 1 | 0.40mi |
| 500 Boardman Canfield Rd Youngstown, OH | 1.0–2.0 | 1.0–1.5 | 821 | $1,005 | $1.22 | 13d | 1 | 0.50mi |
| 7059 West Blvd Boardman, OH | 2.0 | 1.0–2.0 | 561 | $960 | $1.71 | 13d | 1 | 0.51mi |
| 7116 Claybourne Ave Youngstown, OH | 3.0 | 1.5 | 1020 | $1,600 | $1.57 | 20d | 1 | 0.54mi |
| 20 Southwoods Ave Unit 23 Youngstown, OH | 2.0 | 1.0 | 700 | $850 | $1.21 | 20d | 1 | 0.66mi |
| 86 Ferncliff Ave Youngstown, OH | 2.0 | 1.0 | 1027 | $1,200 | $1.17 | 20d | 1 | 1.03mi |
| 80 Romaine Ave Unit B Youngstown, OH | 2.0 | 1.0 | 1000 | $795 | $0.80 | 13d | 1 | 1.18mi |
| 7956 Market St Youngstown, OH | 2.0 | 1.0–2.0 | 1025 | $1,080 | $1.05 | 13d | 1 | 1.19mi |
Listing history 19 events
-
2026-06-19days on market $129,900 Active 57 DOM
-
2026-06-18days on market $129,900 Active 56 DOM
-
2026-06-17days on market $129,900 Active 55 DOM
-
2026-06-16days on market $129,900 Active 54 DOM
-
2026-06-15days on market $129,900 Active 53 DOM
-
2026-06-14days on market $129,900 Active 51 DOM
-
2026-06-13days on market $129,900 Active 50 DOM
-
2026-06-10days on market $129,900 Active 48 DOM
-
2026-06-09days on market $129,900 Active 47 DOM
-
2026-06-08days on market $129,900 Active 46 DOM
-
2026-06-07days on market $129,900 Active 45 DOM
-
2026-06-05days on market $129,900 Active 42 DOM
-
2026-06-02days on market $129,900 Active 40 DOM
-
2026-06-01days on market $129,900 Active 39 DOM
-
2026-05-31days on market $129,900 Active 38 DOM
-
2026-05-30days on market $129,900 Active 37 DOM
-
2026-05-17price $129,900 1088-char remark
-
2026-04-24$149,900 Active 1088-char remark
-
1996-07-16soldstatus $60,000
ⓘ Source: listings_history table (triggers on properties + properties_extension) + one-shot
backfill from property_details.listing_events for pre-trigger history.
Tax reassessment forecast OH · Partial reset (capped growth)
- Current annual tax
- $1,949 · $162/mo
- Projected year-2 tax
- $1,988 · $166/mo
- Expected delta
- +$39/yr (+$3/mo · 2.0%)
ⓘ Screening estimate from a state-policy table — verify with the county assessor before closing.
Climate risk First Street
- Flood 1/10 Low FEMA zone X (unshaded) · 0% chance over 30 yrs
- Wildfire 1/10 Low
- Heat 3/10 Moderate 7 d/yr ≥95°F today · 17 d/yr by 30 yrs out
- Wind 1/10 Low
- Air quality 2/10 Low 1 unhealthy d/yr today · 2 by 30 yrs out
Nearby sold comps map
Loading sold comps map…
Walkable amenities ~0.75 mi
Loading nearby amenities…
Taxation est. · year 1
- Rental income
- $13,449
- − Mortgage interest
- −$7,276
- − Property taxes
- −$1,949
- − Insurance
- −$650
- − Repairs & maintenance
- −$1,076
- − Management
- −$1,076
- − Depreciation
- −$3,779
- Taxable loss
- −$2,357
- Est. tax savings @ 24.0%
- +$566
- After-tax cash flow
- $417/yr
For passive investors: Depreciation is non-cash, so a rental often shows a tax loss while cash-flowing — sheltering income. Rental losses are passive: they offset passive income freely, and up to $25,000/yr can offset ordinary (W-2) income if you actively participate and your MAGI is under $100k (phasing out to $0 by $150k); unused losses carry forward. On sale, claimed depreciation is recaptured at up to 25%, and gains may owe capital-gains tax (a 1031 exchange can defer both). Figures are a year-1 estimate at your 24.0% rate — not tax advice; consult a CPA.
Schools (NCES district)
- District
- Boardman Local
- NCES district ID
- 3904830
- Math proficiency
- 63% ▼ -13.00%
- Reading proficiency
- 71% ▼ -8.00%
- Median HH income
- $47,613
- Composite
- 56.62/100
- National rank
- #1142
- State rank
- #189 of 656 in OH
Livability — Youngstown
- Score
- 81/100
- State rank
- #99
- US rank
- #1506
Category grades
Schools grade is shown separately in the Schools card above.
Census & demographics
- County
- Mahoning County · 84,956 people
- City population
- 28,503
- Metro
- Youngstown-Warren-Boardman, OH-PA
- Population (ZIP)
- 32,536
- Household income
- $63,317
- Rent vs Own
- Severe rent burden
- 910.0
Population outlook (Mahoning County) Hauer SSP2
- Today (2025)
- 223,932 people
- By 2030
- 218,387 · -2.5%
- By 2040
- 205,367 · -8.3%
- By 2050
- 193,606 · -13.5%
- By 2075
- 173,694 · -22.4%
- By 2100
- 151,147 · -32.5%
Race, ethnicity, and origin ACS 2023
- Neighborhood character
- Predominantly White (81%)
- Race & ethnicity
- White 81% Black 9% Two or more races 6% Hispanic / Latino 5%
- Hispanic origin (detail)
- Mexican 1% Puerto Rican 2%
- Common ancestry
- Romanian 6% Lithuanian 1% Slovak 1%
- Foreign-born
- 4% · Canada
- Languages at home
- 94% English-only · Spanish 2% Arabic 2% Other Indo-European 1%
Political lean MEDSL · Mahoning
- 2024 margin
- Lean R (+9.4) · D 44.9% · R 54.4%
- 2008→2024 swing
- -36.1pp toward R · 2008: 26.6pp · 2024: -9.4pp
- All cycles
- 2024: R+9.4 2020: R+1.9 2016: D+3.0 2012: D+27.7 2008: D+26.6
Not yet ingested
- Civics
- —
Market trends
- HPI YoY
- ▼ -56.75%
- Current HPI
- 213.1446
- Rent YoY
- ▲ 6.56%
- Metro
- Youngstown-Warren-Boardman, OH-PA
- State GDP YoY
- ▲ 1.98%
- F500 in state
- 48
Industry mix (Fortune 500 HQ in OH)
| Industry | F500 HQs | Revenue |
|---|---|---|
| Insurance | 3 | $145B |
|
||
| Industrial Machinery | 3 | $49B |
|
||
| Financial Services | 3 | $24B |
|
||
| Consumer Goods | 2 | $93B |
|
||
| Aerospace / Defense | 2 | $47B |
|
||
| Utilities | 2 | $33B |
|
||
Price history
+116.5% since first listed3 events — show timeline
- 2026-05-17 Price Changed $129,900 MLSNOW
- 2026-04-24 Listed $149,900 MLSNOW
- 1996-07-16 Sold (Public Records) $60,000 Public Records
Property tax history
+1.0%/yrLatest (2025): $1,949 · -2.2% YoY. Source: county tax records.
Cash-flow waterfall
monthlySold comps — $/sqft
last 12 mo · ≤1 miLoading sold comps…