4400 Gateway Rd #62 · Bethel Island, CA
Flood risk 1/10 · Minimal
- FEMA flood zone
- AE
- Chance of flooding over 30 yrs
- 0.0%
- Est. flood insurance / yr
- $1,737 – $8,500
Fire risk 4/10 · Minor
- Est. fire insurance / yr
- $659 – $1,223
Heat risk 6/10 · Moderate
- Hot days now (above 101°F)
- 7 days/yr
- Hot days in 30 yrs
- 14 days/yr
Wind risk 1/10 · Minimal
- Chance of severe wind over 30 yrs
- —
Air-quality risk 10/10 · Severe
- Unhealthy air days now
- 21 days/yr
- Unhealthy air days in 30 yrs
- 23 days/yr
Risk factors via First Street. Map © Google.
Why this score? — see what drove the B+ grade
The composite is a weighted blend of 9 inputs, each scored 0–100. Each bar is that input's sub-score; the figure is the points it added to the 100-point composite (weight × sub-score).
- Cash flow +30.0/30.0
- 1% rule +10.0/10.0
- DSCR +10.0/10.0
- Appreciation +10.0/10.0
- ARV discount +7.5/15.0
- Condition / age +4.0/5.0
- Schools +3.4/10.0
- Rent growth +2.5/5.0
- Livability +2.5/5.0
$139,900
🖨 Deal sheet 📄 Offer letter ✓ Due diligence
Listing remarks
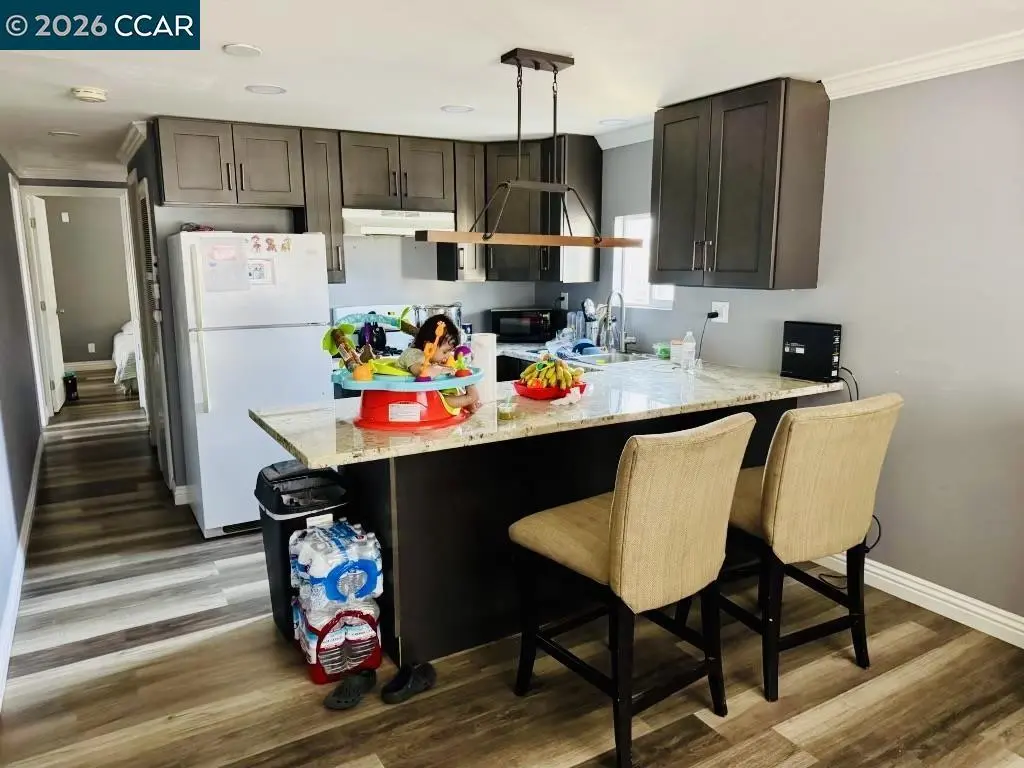
Welcome to this tastefully remodeled manufacture home in the Bethal Island Estates community. This home consist of 3 bedrooms and 1.5 baths. Updated kitchen with stone counter tops. Laminate flooring throughout. The roof is only 3 years old. Fresh paint inside. Spacious porch to enjoy your coffee or favorite drink. This home is waiting for its new owner and it's priced to sell!
Key facts
- Laminate flooring
- Updated kitchen
- Stone counter tops
Tags
Property features AI
Finance
- Other: Living area approximately 900 square feet
- HOA & community: Park name not listed
Exterior
- Parking: Parking spaces available
- Utilities: Public water
- Home design: Manufactured in park; Mobile home (single wide)
- Construction: Wood siding
- Exterior features: Front porch; Level lot
Interior
- Kitchen: Stone counters; Kitchen island; Eat-in kitchen; Breakfast bar; Free-standing range; Updated kitchen
- Bedrooms: 3 bedrooms (street level)
- Flooring: Laminate
- Bathrooms: 2 bathrooms total (1 full, 1 partial)
- Heating & cooling: Wall furnace heating; Ceiling fan(s) for cooling
- Interior features: Breakfast bar; Updated kitchen; No additional rooms
- Laundry & utility: Washer/dryer hookups only
Neighborhood map
What this means for you Summary
Snapshot
- This is a 3-bed/1.5-bath manufactured listed at $140k. Condition is rated good.
Deal economics
- At list price, monthly cash flow is $1k ($17k/yr) — positive.
- The deal already cash-flows at list — no discount required.
- Meets the 1% rule at list price ($4k rent vs $140k).
- Recommended offer: $132k (6.0% below list) — sets the bar for market timing.
- Cap rate 22.3% vs local median 2.9% in Bethel Island — top-decile yield for the area; either an underpriced asset or a hidden risk that comps aren't pricing in. Stress-test before assuming the spread holds.
Location & tenants
- Location reads 49/100 on livability (#1,166 in CA) — a working-class tenant base; expect higher turnover. Strengths: crime A-; Watch: employment C-, schools F, amenities F.
- Oakley Union Elementary (suburban): math 26% / reading 40% proficiency, ranked #837 of 1,400 in CA (top 60%) — families likely to look elsewhere, expect single-tenant / working-renter base with shorter leases.
- Market conditions: 78 active listings in the ZIP; 2,169 units permitted in Contra Costa County in 2024 (896 in 5+ unit buildings).
Forward outlook
- In year one you build about $15k of equity ($967 loan paydown + $14k appreciation (10.0% local appreciation)).
- Contra Costa County population projected at +26% by 2050 — long-run rental-demand tailwind backs the buy-and-hold thesis.
- At projected returns (10.0% appreciation + 3.0% rent growth), your $39k cash investment doubles in ~2 years — after that, you're playing with house money.
- By year 3, paydown + projected appreciation supports a ~$38k cash-out refi (75% LTV) — recoverable capital for the next deal without selling this one.
Negotiation context
- It's been on market 80 days — a 6% lower offer ($132k) is reasonable based on typical stale-listing flexibility.
- 3 sale attempts since 18y ago; this cycle's ask has dropped $25k (15%) from the opening price — seller is motivated, your offer sets the floor, not the list.
Risks & watch-outs
- Watch-outs: flood insurance adds $427/mo.
- Climate carrying-cost: in FEMA flood zone AE (mandatory federal flood insurance); extreme-heat days projected 7→14/yr by 2055 (HVAC capex compounding) — expect insurance premiums to compound above CPI over the hold.
Questions for the listing agent
- It's been on market 80 days. Have you received any prior offers? Is the seller open to a 6% concession, seller financing, or rate buy-down credit?
- What's the actual annual flood-insurance premium (NFIP or private), and is the property in a SFHA with mandatory coverage?
- Why hasn't it sold? Are there any deal-killer items the seller is aware of (foundation, flood, title, zoning, code violations)?
- Is there a deadline driving the sale (1031 exchange, divorce, estate, relocation)? That informs how much negotiation room exists.
- Schools are F-rated, which usually means shorter tenancies and higher turnover. Who's the typical renter profile here, and what's been the actual vacancy rate?
- What's the average days-on-market for RENTAL listings here right now (not sales)? A rising rental-DOM trend means longer vacancies and softer asking-rent achievability than the comps imply.
- What's the recent tenant-quality profile in this submarket — average credit score on applications, eviction rate, late-payment / NSF rate, and stable-employment percentage? A property-management company in the area should have these aggregated.
- How much new for-sale + rental construction is in the pipeline within 1–3 miles? Heavy new supply typically softens prices + rents 12–24 months out; constrained supply supports both.
Investment metrics
- 1% rule
- 2.56% ✓
- Cap rate
- 22.30%
- Cash-on-cash
- 57.17%
- DSCR
- 3.54
- GRM
- 3.3
CMA / ARV
No comps found within radius.
Projected returns pro-forma
10.0% appreciation · 3.0% rent growth · sell at horizon
- IRR
- 58.7%
- Equity multiple
- 5.29×
- Total profit
- $168,195
- Equity at exit
- $126,033
- IRR
- 52.2%
- Equity multiple
- 11.82×
- Total profit
- $423,835
- Equity at exit
- $271,795
Cash invested: $39,172 (down + closing). Projections, not guarantees.
Landlord ↔ Tenant lean methodology
- Overall (STATE)
- 18 Strongly Tenant-Friendly
- State California
- 18 Strongly Tenant-Friendly · D+13
- County
- — inherits STATE
- City
- — inherits STATE
ZIP-level market 94511
- Home prices YoY
- 4.6%
- Active inventory
- 78
- Price-to-rent
- 3.3×
Monthly cashflow live
- Estimated rent
- $3,586 medium interval (Pro) →
- Mortgage (P&I)
- −$734
- Tax est. 1.5%
- −$175 /mo · $2,098/yr
- Insurance
- −$58
- Flood insurance flood zone
- −$427 /mo · $5,118/yr
- HOA
- −$0
- Vacancy / Maint / Mgmt
- −$753
- Net cashflow
- $1,440
Break-even live
UW: 25.0% down · 7.5% · 30yr · 1.5% tax · 5.0% vac · 8.0% maint · 8.0% mgmt
Financing live
Cash to close
- Down payment
- $34,975
- Closing costs
- $4,197
- Reserves months
- —
- Total cash needed
- —
Loan-product check · same deal, 3 products live
Conventional
25% down · 7.5% · 30yr
- Down + closing
- —
- Monthly P&I
- —
- Monthly cashflow
- —
- DSCR
- —
- Eligible?
- —
Personal DTI + credit; lowest rate.
DSCR
20% down · 8.5% · 30yr
- Down + closing
- —
- Monthly P&I
- —
- Monthly cashflow
- —
- DSCR
- —
- Eligible?
- —
No personal income docs; deal must DSCR.
Hard money
10% down · 12.0% · 12mo
- Down + closing
- —
- Monthly P&I
- —
- Monthly cashflow
- —
- DSCR
- —
- Eligible?
- —
Short-term bridge; refi at stabilization.
Listing history 26 events
-
2026-06-18days on market $139,900 Active 80 DOM
-
2026-06-17days on market $139,900 Active 79 DOM
-
2026-06-16days on market $139,900 Active 78 DOM
-
2026-06-15days on market $139,900 Active 77 DOM
-
2026-06-13days on market $139,900 Active 75 DOM
-
2026-06-13days on market $139,900 Active 74 DOM
-
2026-06-09days on market $139,900 Active 71 DOM
-
2026-06-08days on market $139,900 Active 70 DOM
-
2026-06-07pricedays on market $139,900 Active 69 DOM
-
2026-06-04days on market $150,000 Active 66 DOM
-
2026-06-03days on market $150,000 Active 65 DOM
-
2026-06-02days on market $150,000 Active 64 DOM
-
2026-06-01days on market $150,000 Active 63 DOM
-
2026-05-31days on market $150,000 Active 62 DOM
-
2026-04-21price $150,000
-
2026-03-30$165,000 Active
-
2024-04-26historical
-
2024-04-05price
-
2024-01-20Active
-
2010-12-05historical
-
2009-01-25historical
-
2009-01-08price
-
2008-12-27price
-
2008-12-12price
-
2008-11-13price
-
2008-09-13
ⓘ Source: listings_history table (triggers on properties + properties_extension) + one-shot
backfill from property_details.listing_events for pre-trigger history.
Climate risk First Street
- Flood 1/10 Low FEMA zone AE · 0% chance over 30 yrs
- Wildfire 4/10 Moderate
- Heat 6/10 Major 7 d/yr ≥101°F today · 14 d/yr by 30 yrs out
- Wind 1/10 Low
- Air quality 10/10 Extreme 21 unhealthy d/yr today · 23 by 30 yrs out
Nearby sold comps map
Loading sold comps map…
Walkable amenities ~0.75 mi
Loading nearby amenities…
Taxation est. · year 1
- Rental income
- $43,032
- − Mortgage interest
- −$7,837
- − Property taxes
- −$2,098
- − Insurance
- −$5,818
- − Repairs & maintenance
- −$3,443
- − Management
- −$3,443
- − Depreciation
- −$4,070
- Taxable income
- $16,324
- Est. tax owed @ 24.0%
- −$3,918
- After-tax cash flow
- $13,357/yr
For passive investors: Depreciation is non-cash, so a rental often shows a tax loss while cash-flowing — sheltering income. Rental losses are passive: they offset passive income freely, and up to $25,000/yr can offset ordinary (W-2) income if you actively participate and your MAGI is under $100k (phasing out to $0 by $150k); unused losses carry forward. On sale, claimed depreciation is recaptured at up to 25%, and gains may owe capital-gains tax (a 1031 exchange can defer both). Figures are a year-1 estimate at your 24.0% rate — not tax advice; consult a CPA.
Condition & rehab AI · 6 photos
This tastefully remodeled manufactured home in Bethal Island Estates is in good condition with a fresh paint job and updated kitchen. It's move-in ready and priced to sell!
Value-add opportunities
- Both Paint the exterior siding — Fresh paint can enhance curb appeal and home value.
- Resale Replace the kitchen faucet — A new faucet can improve the kitchen's aesthetic and functionality.
- Rental Install a smart thermostat — Smart thermostats can improve energy efficiency and attract tech-savvy renters.
Renovation cost estimate screening
Value-add ROI direction
- Both Paint the exterior siding — Fresh paint can enhance curb appeal and home value. ↑
- Resale Replace the kitchen faucet — A new faucet can improve the kitchen's aesthetic and functionality. ↑
- Rental Install a smart thermostat — Smart thermostats can improve energy efficiency and attract tech-savvy renters. ↑
ⓘ Cost ranges are severity-bucket heuristics (US national rule-of-thumb). Get contractor quotes + a written scope before underwriting a rehab budget.
Schools (NCES district)
- District
- Oakley Union Elementary
- NCES district ID
- 0628080
- Math proficiency
- 26% ▬ 0.00%
- Reading proficiency
- 40% ▲ 1.00%
- Median HH income
- $77,903
- Composite
- 34.04/100
- National rank
- #10301
- State rank
- #837 of 1400 in CA
Livability — Bethel Island
- Score
- 49/100
- State rank
- #1166
- US rank
- #25883
Category grades
Schools grade is shown separately in the Schools card above.
Census & demographics
- Census place
- Bethel Island, CA
- City population
- 2,144
- Population (ZIP)
- 2,144
Population outlook (Contra Costa County) Hauer SSP2
- Today (2025)
- 1,287,720 people
- By 2030
- 1,364,937 · +6.0%
- By 2040
- 1,506,209 · +17.0%
- By 2050
- 1,624,373 · +26.1%
- By 2075
- 1,853,193 · +43.9%
- By 2100
- 1,901,231 · +47.6%
Race, ethnicity, and origin ACS 2023
- Neighborhood character
- Predominantly White (67%)
- Race & ethnicity
- White 67% Hispanic / Latino 25% Asian 6% Two or more races 3% Pacific Islander 2%
- Hispanic origin (detail)
- Mexican 25%
- Common ancestry
- Slovak 5% Serbian 2% Portuguese 2%
- Foreign-born
- 27% · Canada, South Korea, China
- Languages at home
- 77% English-only · Spanish 20% Other Asian/Pacific 2% Chinese 1%
Political lean MEDSL · Contra Costa
- 2024 margin
- Solid D (+38.0) · D 67.3% · R 29.4% · Other 3.3%
- 2008→2024 swing
- +0.2pp no change · 2008: 37.8pp · 2024: 38.0pp
- All cycles
- 2024: D+38.0 2020: D+45.3 2016: D+43.5 2012: D+33.7 2008: D+37.8
Not yet ingested
- Civics
- —
Market trends
- HPI YoY
- ▲ 13.77%
- Current HPI
- 312.0698
- Rent YoY
- —
- Metro
- —
- State GDP YoY
- ▲ 3.21%
- F500 in state
- 116
Industry mix (Fortune 500 HQ in CA)
| Industry | F500 HQs | Revenue |
|---|---|---|
| Technology | 27 | $1,492B |
|
||
| Financial Services | 3 | $174B |
|
||
| Retail | 3 | $44B |
|
||
| Insurance | 3 | $26B |
|
||
| Media / Entertainment | 2 | $115B |
|
||
| Pharmaceuticals / Biotech | 2 | $62B |
|
||
Price history
-9.1% since first listed12 events — show timeline
- 2026-04-21 Price Changed $150,000 bridgeMLS, Bay East AOR, or Contra Costa AOR
- 2026-03-30 Listed $165,000 bridgeMLS, Bay East AOR, or Contra Costa AOR
- 2024-04-26 Listing Removed — bridgeMLS, Bay East AOR, or Contra Costa AOR
- 2024-04-05 Price Changed — bridgeMLS, Bay East AOR, or Contra Costa AOR
- 2024-01-20 Listed — bridgeMLS, Bay East AOR, or Contra Costa AOR
- 2010-12-05 Listing Removed — bridgeMLS, Bay East AOR, or Contra Costa AOR
- 2009-01-25 Listing Removed — bridgeMLS, Bay East AOR, or Contra Costa AOR
- 2009-01-08 Price Changed — bridgeMLS, Bay East AOR, or Contra Costa AOR
- 2008-12-27 Price Changed — bridgeMLS, Bay East AOR, or Contra Costa AOR
- 2008-12-12 Price Changed — bridgeMLS, Bay East AOR, or Contra Costa AOR
- 2008-11-13 Price Changed — bridgeMLS, Bay East AOR, or Contra Costa AOR
- 2008-09-13 Listed — bridgeMLS, Bay East AOR, or Contra Costa AOR
Cash-flow waterfall
monthlySold comps — $/sqft
last 12 mo · ≤1 miLoading sold comps…