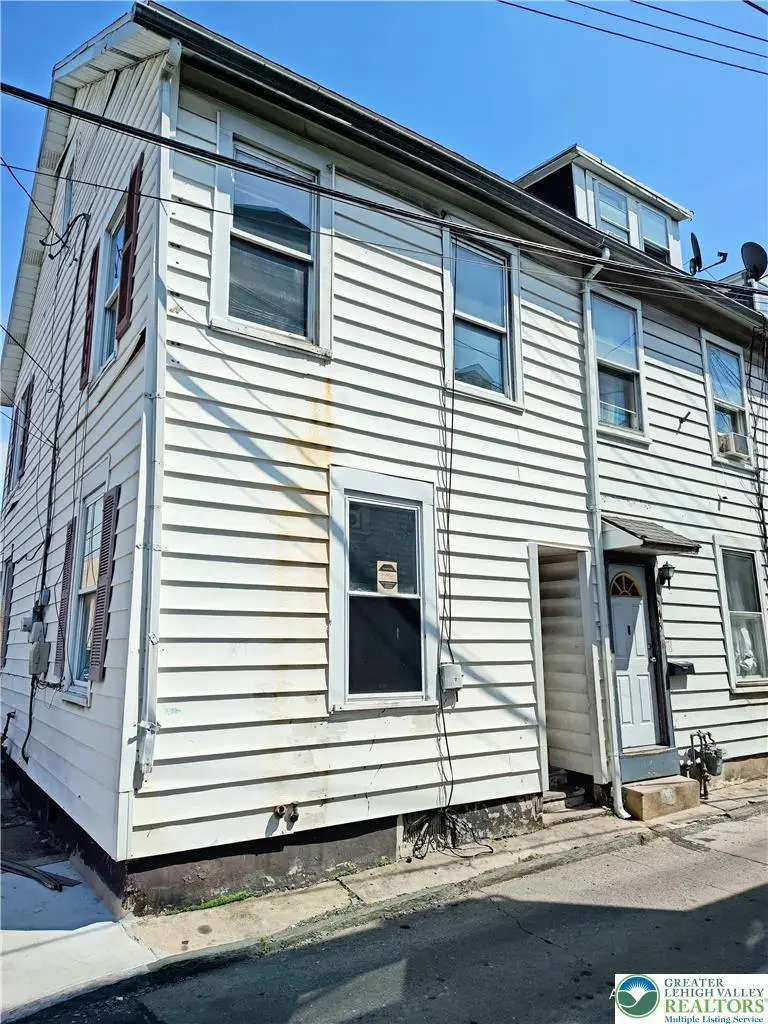
547 N Silk St · Allentown, PA
Flood risk 1/10 · Minimal
- FEMA flood zone
- X (unshaded)
- Chance of flooding over 30 yrs
- 0.0%
- Est. flood insurance / yr
- $473 – $860
Fire risk 1/10 · Minimal
- Est. fire insurance / yr
- $511 – $949
Heat risk 5/10 · Moderate
- Hot days now (above 99°F)
- 7 days/yr
- Hot days in 30 yrs
- 15 days/yr
Wind risk 4/10 · Minor
- Chance of severe wind over 30 yrs
- 15.0%
Air-quality risk 3/10 · Minor
- Unhealthy air days now
- 3 days/yr
- Unhealthy air days in 30 yrs
- 4 days/yr
Risk factors via First Street. Map © Google.
Why this score? — see what drove the B+ grade
The composite is a weighted blend of 9 inputs, each scored 0–100. Each bar is that input's sub-score; the figure is the points it added to the 100-point composite (weight × sub-score).
- Cash flow +30.0/30.0
- ARV discount +15.0/15.0
- 1% rule +10.0/10.0
- DSCR +10.0/10.0
- Livability +4.0/5.0
- Rent growth +3.9/5.0
- Condition / age +2.5/5.0
- Schools +1.2/10.0
- Appreciation +0.0/10.0
$109,900
🖨 Deal sheet 📄 Offer letter ✓ Due diligence
Listing remarks MLS
Allentown, Center City . . 1208 sf, end of row. Walk across W Allen St to Supremo Market. 3 bedroom, 1.5 bath. Spacious EIK and living room. NEEDS WORK. Buyer responsible for CO. INVESTORS WITH CASH (only), . (3rd bedroom may not have proper egress for the city to allow sleeping). 5k non refundable deposit and POF required. Cash OFFERS ONLY. Looking to settle May 2026.
Key facts
- Built 1878
- Listed 14 days
Property features AI
Exterior
- Home design: Townhouse
- Exterior features: Lot of approximately 933.8 (unit not specified)
Neighborhood map
What this means for you Summary
Snapshot
- This is a 3-bed/1.5-bath townhouse listed at $110k.
Deal economics
- At list price, monthly cash flow is $589 ($7k/yr) — positive.
- The deal already cash-flows at list — no discount required.
- Meets the 1% rule at list price ($2k rent vs $110k).
- Cap rate 12.7% vs local median 5.3% in Allentown — top-decile yield for the area; either an underpriced asset or a hidden risk that comps aren't pricing in. Stress-test before assuming the spread holds.
Location & tenants
- Location reads 81/100 on livability (#171 in PA, #1,440 nationally) — a professional / high-income tenant draw. Strengths: commute A+, cost of living A+, housing A+; Watch: schools D+, employment D.
- Allentown City SD (urban): math 10% / reading 20% proficiency, ranked #513 of 539 in PA (top 95%) — low school quality limits family demand, transient renter base, plan for 1-2y turnover; 73% free/reduced lunch — lower-income household profile, screen leases tightly.
- Market conditions: Rents rising fast (+5.5%/yr); 167 active listings in the ZIP; 40 comparable units currently listed for rent nearby; rentals at typical pace (median 21d on market — plan ~3-4 weeks tenant-placement turnaround); lower-income renter base — watch delinquency; 765 units permitted in Lehigh County in 2024 (286 in 5+ unit buildings).
- At $1,693/mo this rent would consume 47% of the median local household income ($43k/yr) (locally 4313% of renters already pay >50% of income on rent) — very limited rent-growth headroom before tenants either downsize or default.
Forward outlook
- Local home prices are declining (-3.0%/yr); year-one equity from $760 of loan paydown is wiped out by about $3k of value loss. Plan a longer hold.
- Lehigh County population projected at +21% by 2050 — long-run rental-demand tailwind backs the buy-and-hold thesis.
- At projected returns (-3.0% appreciation + 5.5% rent growth), your $31k cash investment doubles in ~5 years — after that, you're playing with house money.
Negotiation context
- Only 14 days on market — expect competitive offers; lowballing is unlikely to land.
- 8 sale attempts since 22y ago with the ask held roughly flat each time — persistent listings suggest the price (not the market) is what's stuck; bring a comps-based counter.
Risks & watch-outs
- Watch-outs: built in 1878 — expect roof / HVAC / electrical / plumbing capex.
- Climate carrying-cost: extreme-heat days projected 7→15/yr by 2055 (HVAC capex compounding) — expect insurance premiums to compound above CPI over the hold.
Questions for the listing agent
- Built in 1878 — when were the roof, HVAC, electrical panel, plumbing, and water heater last replaced?
- Is there a deadline driving the sale (1031 exchange, divorce, estate, relocation)? That informs how much negotiation room exists.
- Schools are D-rated, which usually means shorter tenancies and higher turnover. Who's the typical renter profile here, and what's been the actual vacancy rate?
- What's the average days-on-market for RENTAL listings here right now (not sales)? A rising rental-DOM trend means longer vacancies and softer asking-rent achievability than the comps imply.
- What's the recent tenant-quality profile in this submarket — average credit score on applications, eviction rate, late-payment / NSF rate, and stable-employment percentage? A property-management company in the area should have these aggregated.
- How much new for-sale + rental construction is in the pipeline within 1–3 miles? Heavy new supply typically softens prices + rents 12–24 months out; constrained supply supports both.
Investment metrics
- 1% rule
- 1.54% ✓
- Cap rate
- 12.72%
- Cash-on-cash
- 22.97%
- DSCR
- 2.02
- GRM
- 5.4
CMA / ARV
- ARV (median comp)
- $145,880
- List price
- $109,900
- Delta
- -24.66%
- Verdict
- UNDERPRICED
- Comps
- 20 within 1.0 mi
Show comp detail 12 sales within ~0.75 mi
| Address | Dist | Beds/Ba | Sqft | Sold | Price | $/sf | Match |
|---|---|---|---|---|---|---|---|
| 526 N Fountain St | 0.19mi | 4/1.0 (+1) | 1,186 (-2%) | 1mo | $175,000 | $148 | 81 |
| 242 Hall St | 0.32mi | 4/1.0 (+1) | 1,200 (-1%) | 3mo | $155,000 | $129 | 75 |
| 719 W Whitehall St | 0.41mi | 3/1.5 | 1,244 (+3%) | 2mo | $200,000 | $161 | 74 |
| 517 Elliger St | 0.46mi | 3/1.5 | 1,235 (+2%) | 2mo | $185,000 | $150 | 73 |
| 816 W Allen St | 0.07mi | 4/2.0 (+1) | 1,328 (+10%) | 0mo | $165,000 | $124 | 73 |
| 736 N Lumber St | 0.20mi | 4/1.0 (+1) | 1,330 (+10%) | 2mo | $196,000 | $147 | 65 |
| 732 N 10th St | 0.34mi | 4/1.5 (+1) | 1,310 (+8%) | 1mo | $245,000 | $187 | 64 |
| 384 W Gordon St | 0.52mi | 3/1.0 | 1,266 (+5%) | 2mo | $200,000 | $158 | 64 |
| 1234 W Tilghman St | 0.57mi | 3/1.0 | 1,288 (+7%) | 1mo | $245,000 | $190 | 59 |
| 616 N 12th St | 0.50mi | 3/2.0 | 1,380 (+14%) | 1mo | $230,000 | $167 | 50 |
| 737 N Jordan St | 0.53mi | 3/1.0 | 1,384 (+15%) | 3mo | $215,100 | $155 | 47 |
| 408 N 2nd St | 0.75mi | 4/1.5 (+1) | 1,380 (+14%) | 0mo | $202,500 | $147 | 36 |
Match score weights: distance 35% · size 25% · config 20% · recency 20%. Top-matched comps best support the ARV.
Projected returns pro-forma
-3.0% appreciation · 5.48% rent growth · sell at horizon
- IRR
- 18.7%
- Equity multiple
- 1.78×
- Total profit
- $24,056
- Equity at exit
- $16,386
- IRR
- 28.7%
- Equity multiple
- 3.86×
- Total profit
- $88,024
- Equity at exit
- $9,502
Cash invested: $30,772 (down + closing). Projections, not guarantees.
Landlord ↔ Tenant lean methodology
- Overall (STATE)
- 62 Landlord-Friendly
- State Pennsylvania
- 62 Landlord-Friendly · EVEN
- County
- — inherits STATE
- City
- — inherits STATE
ZIP-level market 18102
- Rents YoY
- 5.5%
- Active inventory
- 167
- Price-to-rent
- 5.4×
Monthly cashflow live
- Estimated rent
- $1,693 high interval (Pro) →
- Mortgage (P&I)
- −$576
- Tax from tax record
- −$126 /mo · $1,517/yr
- Insurance
- −$46
- HOA
- −$0
- Vacancy / Maint / Mgmt
- −$356
- Net cashflow
- $589
Break-even live
UW: 25.0% down · 7.5% · 30yr · 1.5% tax · 5.0% vac · 8.0% maint · 8.0% mgmt
Financing live
Cash to close
- Down payment
- $27,475
- Closing costs
- $3,297
- Reserves months
- —
- Total cash needed
- —
Loan-product check · same deal, 3 products live
Conventional
25% down · 7.5% · 30yr
- Down + closing
- —
- Monthly P&I
- —
- Monthly cashflow
- —
- DSCR
- —
- Eligible?
- —
Personal DTI + credit; lowest rate.
DSCR
20% down · 8.5% · 30yr
- Down + closing
- —
- Monthly P&I
- —
- Monthly cashflow
- —
- DSCR
- —
- Eligible?
- —
No personal income docs; deal must DSCR.
Hard money
10% down · 12.0% · 12mo
- Down + closing
- —
- Monthly P&I
- —
- Monthly cashflow
- —
- DSCR
- —
- Eligible?
- —
Short-term bridge; refi at stabilization.
Rent comps 40 comps
| Address | Beds | Baths | Sqft | Rent | $/sqft | DOM | Units | Dist |
|---|---|---|---|---|---|---|---|---|
| 511 N Lumber St Allentown, PA | 4.0 | 1.0 | 756 | $2,200 | $2.91 | 14d | 1 | 0.09mi |
| 635 N Lumber St Allentown, PA | 3.0 | 1.5 | 1117 | $1,750 | $1.57 | 2d | 1 | 0.11mi |
| 440 N Hall St Unit 2 Allentown, PA | 2.0 | 1.0 | 989 | $1,400 | $1.42 | 43d | 1 | 0.11mi |
| 528 N 6th St Allentown, PA | 3.0 | 1.0 | 967 | $1,700 | $1.76 | 14d | 1 | 0.18mi |
| 915 Tilghman St Apt 4 Allentown, PA | 3.0 | 1.0 | 1250 | $1,750 | $1.40 | 23d | 1 | 0.20mi |
| 706 N 6th St Unit 1 Allentown, PA | 2.0 | 1.0 | 800 | $1,395 | $1.74 | 14d | 1 | 0.21mi |
| 347 N 7th St Apt 3 Allentown, PA | 3.0 | 1.0 | 1200 | $1,500 | $1.25 | 43d | 1 | 0.22mi |
| 814 Washington St #2 Allentown, PA | 4.0 | 1.0 | 1200 | $1,600 | $1.33 | 2d | 1 | 0.22mi |
| 823 W Washington St Allentown, PA | 4.0 | 1.0 | 1400 | $1,950 | $1.39 | 14d | 1 | 0.25mi |
| 535 Tilghman St Unit 1ST Allentown, PA | 2.0 | 1.0 | 900 | $1,495 | $1.66 | 2d | 1 | 0.25mi |
| 535 Tilghman St Unit 2ND Allentown, PA | 4.0 | 2.0 | 1500 | $1,750 | $1.17 | 2d | 1 | 0.25mi |
| 432 N Law St Allentown, PA | 4.0 | 1.0 | 1328 | $1,500 | $1.13 | 14d | 1 | 0.27mi |
| 944 W Gordon St Allentown, PA | 3.0 | 1.5 | 1146 | $1,750 | $1.53 | 23d | 1 | 0.29mi |
| 427 N 5th St Unit 2 Allentown, PA | 2.0 | 1.0 | 800 | $1,400 | $1.75 | 14d | 1 | 0.33mi |
| 451 W Liberty St Allentown, PA | 2.0 | 1.0 | 1126 | $1,395 | $1.24 | 43d | 1 | 0.33mi |
| 622 W Chew St Unit 2 Allentown, PA | 3.0 | 1.0 | 1161 | $1,600 | $1.38 | 18d | 1 | 0.33mi |
| 209 N Eighth St Apt 2 Allentown, PA | 3.0 | 1.0 | 1430 | $1,550 | $1.08 | 43d | 1 | 0.37mi |
| 626 Oak St Allentown, PA | 3.0 | 1.0 | 1396 | $1,900 | $1.36 | 43d | 1 | 0.37mi |
| 218 N 6th St Apt 3 Allentown, PA | 3.0 | 1.0 | 750 | $1,600 | $2.13 | 23d | 1 | 0.40mi |
| 1106 Tilghman St Unit 1st floor Allentown, PA | 2.0 | 1.0 | 1000 | $1,250 | $1.25 | 43d | 1 | 0.40mi |
| 621 W Turner St Apt 14 Allentown, PA | 3.0 | 1.0 | 800 | $1,395 | $1.74 | 23d | 1 | 0.41mi |
| 144 N 7th St Allentown, PA | 2.0 | 1.0 | 850 | $1,595 | $1.88 | 23d | 1 | 0.41mi |
| 913 N 6th St Allentown, PA | 4.0 | 1.0 | 1476 | $1,698 | $1.15 | 14d | 1 | 0.42mi |
| 395 W Allen St Allentown, PA | 3.0 | 1.0 | 1344 | $1,800 | $1.34 | 23d | 1 | 0.44mi |
| 936 N 6th St Allentown, PA | 3.0 | 1.0 | 1014 | $1,700 | $1.68 | 23d | 1 | 0.45mi |
| 832 Chestnut St Allentown, PA | 3.0 | 1.0 | 1124 | $2,100 | $1.87 | 23d | 1 | 0.46mi |
| 408 Washington St Unit 2W Allentown, PA | 2.0 | 1.0 | 1200 | $1,395 | $1.16 | 2d | 1 | 0.47mi |
| 407 N 4th St Allentown, PA | 3.0 | 1.5 | 1321 | $1,550 | $1.17 | 23d | 1 | 0.47mi |
| 517 Elliger St Allentown, PA | 3.0 | 1.5 | 1235 | $1,700 | $1.38 | 23d | 1 | 0.47mi |
| 229 Peach St Allentown, PA | 3.0 | 2.0 | 882 | $1,800 | $2.04 | 14d | 1 | 0.47mi |
| 551 Sumner Ct Allentown, PA | 3.0 | 1.0 | 1270 | $1,700 | $1.34 | 2d | 1 | 0.48mi |
| 107 N 7th St Allentown, PA | 2.0 | 1.0–2.0 | 855 | $2,972 | $3.47 | 2d | 23 | 0.48mi |
| 827 Linden St Unit 829-1 Allentown, PA | 2.0 | 2.0 | 1200 | $1,495 | $1.25 | 21d | 1 | 0.49mi |
| 829 Linden St Apt 1 Rear Allentown, PA | 2.0 | 2.0 | 1200 | $1,495 | $1.25 | 23d | 1 | 0.49mi |
| 27 N 7th St Allentown, PA | 2.0 | 1.0–2.0 | 840 | $2,222 | $2.64 | 2d | 11 | 0.51mi |
| 26 N 6th St Allentown, PA | 1.0–2.0 | 1.0–2.0 | 953 | $2,224 | $2.33 | 2d | 9 | 0.54mi |
| 906 N 4th St Unit 2 Allentown, PA | 2.0 | 1.0 | 1077 | $1,300 | $1.21 | 23d | 1 | 0.55mi |
| 801 N Jordan St Unit 3 Allentown, PA | 2.0 | 1.0 | 935 | $1,350 | $1.44 | 43d | 1 | 0.56mi |
| 45 N 6th St Allentown, PA | 2.0 | 1.0–2.0 | 1002 | $3,616 | $3.61 | 2d | 13 | 0.56mi |
| 835 Hamilton St Unit 509 Allentown, PA | 2.0 | 2.0 | 1052 | $2,399 | $2.28 | 18d | 1 | 0.57mi |
Listing history 20 events
-
2026-06-18days on market $109,900 Active 14 DOM
-
2026-06-17remarks 429-char remark
-
2026-06-17statusdays on market $109,900 Active 13 DOM
-
2026-06-01statusdays on market $109,900 Pending 24 DOM
Show marketing remark (372 chars)
Allentown, Center City . . 1208 sf, end of row. Walk across W Allen St to Supremo Market. 3 bedroom, 1.5 bath. Spacious EIK and living room. NEEDS WORK. Buyer responsible for CO. INVESTORS WITH CASH (only), . (3rd bedroom may not have proper egress for the city to allow sleeping). 5k non refundable deposit and POF required. Cash OFFERS ONLY. Looking to settle May 2026.
-
2026-05-31days on market $109,900 Active 23 DOM
-
2026-05-31days on market $109,900 Active 22 DOM
-
2026-05-11status Pending 372-char remark
Show marketing remark (372 chars)
Allentown, Center City . . 1208 sf, end of row. Walk across W Allen St to Supremo Market. 3 bedroom, 1.5 bath. Spacious EIK and living room. NEEDS WORK. Buyer responsible for CO. INVESTORS WITH CASH (only), . (3rd bedroom may not have proper egress for the city to allow sleeping). 5k non refundable deposit and POF required. Cash OFFERS ONLY. Looking to settle May 2026.
-
2026-04-24$99,900 Active 372-char remark
Show marketing remark (372 chars)
Allentown, Center City . . 1208 sf, end of row. Walk across W Allen St to Supremo Market. 3 bedroom, 1.5 bath. Spacious EIK and living room. NEEDS WORK. Buyer responsible for CO. INVESTORS WITH CASH (only), . (3rd bedroom may not have proper egress for the city to allow sleeping). 5k non refundable deposit and POF required. Cash OFFERS ONLY. Looking to settle May 2026.
-
2014-06-27soldstatus $18,000 122-char remark
Show marketing remark (122 chars)
3 bedroom home perfect for an owner occupant or investor. Features a low maintainance, fenced in yard and updated windows.
-
2014-04-08$31,900 122-char remark
Show marketing remark (122 chars)
3 bedroom home perfect for an owner occupant or investor. Features a low maintainance, fenced in yard and updated windows.
-
2014-04-07historical
-
2014-04-07historical
-
2013-11-04$31,900
-
2013-11-04$31,900
-
2005-10-17soldstatus $44,300
-
2005-05-26soldstatus $44,300
-
2005-01-17$46,900
-
2005-01-12historical
-
2004-06-17$49,900
-
1992-03-01soldstatus $46,500
ⓘ Source: listings_history table (triggers on properties + properties_extension) + one-shot
backfill from property_details.listing_events for pre-trigger history.
Tax reassessment forecast PA · Partial reset (capped growth)
- Current annual tax
- $1,517 · $126/mo
- Projected year-2 tax
- $1,627 · $136/mo
- Expected delta
- +$110/yr (+$9/mo · 7.2%)
ⓘ Screening estimate from a state-policy table — verify with the county assessor before closing.
Climate risk First Street
- Flood 1/10 Low FEMA zone X (unshaded) · 0% chance over 30 yrs
- Wildfire 1/10 Low
- Heat 5/10 Major 7 d/yr ≥99°F today · 15 d/yr by 30 yrs out
- Wind 4/10 Moderate 15% chance of damaging wind over 30 yrs
- Air quality 3/10 Moderate 3 unhealthy d/yr today · 4 by 30 yrs out
Nearby sold comps map
Loading sold comps map…
Walkable amenities ~0.75 mi
Loading nearby amenities…
Taxation est. · year 1
- Rental income
- $20,317
- − Mortgage interest
- −$6,156
- − Property taxes
- −$1,517
- − Insurance
- −$550
- − Repairs & maintenance
- −$1,625
- − Management
- −$1,625
- − Depreciation
- −$3,197
- Taxable income
- $5,647
- Est. tax owed @ 24.0%
- −$1,355
- After-tax cash flow
- $5,713/yr
For passive investors: Depreciation is non-cash, so a rental often shows a tax loss while cash-flowing — sheltering income. Rental losses are passive: they offset passive income freely, and up to $25,000/yr can offset ordinary (W-2) income if you actively participate and your MAGI is under $100k (phasing out to $0 by $150k); unused losses carry forward. On sale, claimed depreciation is recaptured at up to 25%, and gains may owe capital-gains tax (a 1031 exchange can defer both). Figures are a year-1 estimate at your 24.0% rate — not tax advice; consult a CPA.
Schools (NCES district)
- District
- Allentown City SD
- NCES district ID
- 4202280
- Math proficiency
- 10% ▼ -10.00%
- Reading proficiency
- 20% ▼ -15.00%
- Median HH income
- $36,337
- Composite
- 12.43/100
- National rank
- #9630
- State rank
- #513 of 539 in PA
Livability — Allentown
- Score
- 81/100
- State rank
- #171
- US rank
- #1440
Category grades
Schools grade is shown separately in the Schools card above.
Census & demographics
- Census place
- Allentown, PA
- County
- Lehigh County · 333,019 people
- City population
- 172,996
- Metro
- Allentown-Bethlehem-Easton, PA-NJ
- Population (ZIP)
- 51,001
- Household income
- $43,085
- Rent vs Own
- Severe rent burden
- 4313.0
Population outlook (Lehigh County) Hauer SSP2
- Today (2025)
- 392,957 people
- By 2030
- 408,319 · +3.9%
- By 2040
- 440,007 · +12.0%
- By 2050
- 475,940 · +21.1%
- By 2075
- 590,448 · +50.3%
- By 2100
- 690,314 · +75.7%
Race, ethnicity, and origin ACS 2023
- Neighborhood character
- Predominantly Hispanic (69%)
- Race & ethnicity
- Hispanic / Latino 69% Two or more races 28% White 18% Black 10%
- Hispanic origin (detail)
- Mexican 3% Puerto Rican 38% Dominican 22%
- Common ancestry
- Polish 1% Romanian 1% Hispanic 1%
- Foreign-born
- 22% · Canada, Jamaica
- Languages at home
- 45% English-only · Spanish 52% Arabic 2%
Political lean MEDSL · Lehigh
- 2024 margin
- Toss-up / Even · D 50.7% · R 48.0% · Other 1.2%
- 2008→2024 swing
- -12.9pp toward R · 2008: 15.6pp · 2024: 2.7pp
- All cycles
- 2024: D+2.7 2020: D+7.6 2016: D+4.4 2012: D+7.5 2008: D+15.6
Not yet ingested
- Civics
- —
Market trends
- HPI YoY
- ▼ -227.01%
- Current HPI
- 404.834
- Rent YoY
- ▲ 5.48%
- Metro
- Allentown-Bethlehem-Easton, PA-NJ
- State GDP YoY
- ▲ 1.68%
- F500 in state
- 34
Industry mix (Fortune 500 HQ in PA)
| Industry | F500 HQs | Revenue |
|---|---|---|
| Healthcare | 2 | $309B |
|
||
| Insurance | 2 | $27B |
|
||
| Telecommunications / Media | 1 | $124B |
|
||
| Industrial Distribution | 1 | $22B |
|
||
| Financial Services | 1 | $20B |
|
||
| Chemicals / Materials | 1 | $18B |
|
||
Price history
+143.0% since first listed19 events — show timeline
- 2026-06-16 Sold (MLS) $113,000 GLVRMLS
- 2026-06-04 Listed $109,900 ForSaleByOwner.com
- 2026-06-01 Pending — GLVRMLS
- 2026-05-25 Relisted — GLVRMLS
- 2026-05-11 Pending — GLVRMLS
- 2026-05-11 Price Changed $109,900 GLVRMLS
- 2026-04-24 Listed $99,900 GLVRMLS
- 2014-06-27 Sold (MLS) $18,000 GLVRMLS
- 2014-04-08 Listed $31,900 GLVRMLS
- 2014-04-07 Listing Removed — GLVRMLS
- 2014-04-07 Listing Removed — GLVRMLS
- 2013-11-04 Listed $31,900 GLVRMLS
- 2013-11-04 Listed $31,900 GLVRMLS
- 2005-10-17 Sold (Public Records) $44,300 Public Records
- 2005-05-26 Sold (MLS) $44,300 GLVRMLS
- 2005-01-17 Listed $46,900 GLVRMLS
- 2005-01-12 Listing Removed — GLVRMLS
- 2004-06-17 Listed $49,900 GLVRMLS
- 1992-03-01 Sold (Public Records) $46,500 Public Records
Property tax history
-2.0%/yrLatest (2026): $1,517 · +0.7% YoY. Source: county tax records.
Cash-flow waterfall
monthlySold comps — $/sqft
last 12 mo · ≤1 miLoading sold comps…