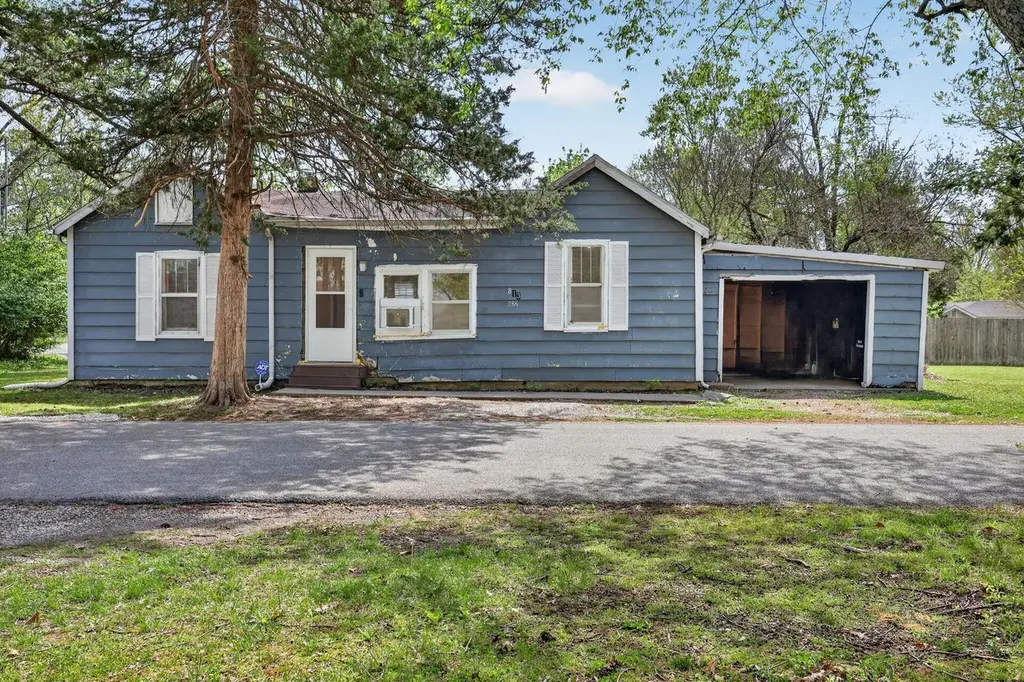
822 W Kennicott St · Carbondale, IL
Flood risk 1/10 · Minimal
- FEMA flood zone
- X (unshaded)
- Chance of flooding over 30 yrs
- 0.0%
- Est. flood insurance / yr
- $507 – $1,088
Fire risk 1/10 · Minimal
- Est. fire insurance / yr
- $804 – $1,492
Heat risk 5/10 · Moderate
- Hot days now (above 107°F)
- 7 days/yr
- Hot days in 30 yrs
- 21 days/yr
Wind risk 2/10 · Minimal
- Chance of severe wind over 30 yrs
- 3.0%
Air-quality risk 2/10 · Minimal
- Unhealthy air days now
- 0 days/yr
- Unhealthy air days in 30 yrs
- 1 days/yr
Risk factors via First Street. Map © Google.
Why this score? — see what drove the B- grade
The composite is a weighted blend of 9 inputs, each scored 0–100. Each bar is that input's sub-score; the figure is the points it added to the 100-point composite (weight × sub-score).
- Cash flow +30.0/30.0
- 1% rule +10.0/10.0
- DSCR +10.0/10.0
- ARV discount +7.5/15.0
- Rent growth +3.6/5.0
- Livability +3.5/5.0
- Condition / age +2.5/5.0
- Schools +2.4/10.0
- Appreciation +0.0/10.0
$46,900
🖨 Deal sheet 📄 Offer letter ✓ Due diligence
Listing remarks
Updated 3-bedroom home located in a convenient Carbondale neighborhood. This property features a spacious living area, updated kitchen with newer appliances, and a functional layout with good natural light throughout. Recent improvements include fresh interior paint and a newer stove, offering a strong starting point for a buyer looking to personalize or add value. The large backyard and detached garage provide additional space for storage, outdoor use, or future improvements. A good fit for buyers looking for an affordable home or investment opportunity. Conveniently located near local amenities, schools, and main roads.
Key facts
- Newer appliances
- Large backyard
- Updated kitchen
Tags
Property features AI
Finance
- HOA & community: No master association fee required
Exterior
- Parking: Attached garage (1 garage space; 1 total parking space)
- Utilities: Public water; Public sewer
- Home design: Detached single-family home; One-story layout; Fee simple ownership; Property built approximately 71–80 years ago; Property listed as built before 1978
- Construction: Asphalt roof; Concrete perimeter foundation; Other construction materials
- Exterior features: Other exterior features
Interior
- Kitchen: Main-level kitchen (about 11 x 13)
- Bedrooms: Master bedroom on the main level (approximately 11 x 13); Two additional bedrooms on the main level (about 11 x 11 and 11 x 9)
- Bathrooms: One full bathroom
- Heating & cooling: Natural gas forced air heat; Window air conditioning units
- Interior features: Seven total rooms; Unfinished full basement
- Laundry & utility: Main-level laundry room (about 7 x 9)
Neighborhood map
What this means for you Summary
Snapshot
- This is a 1-bed/1.0-bath single-family listed at $47k.
Deal economics
- At list price, monthly cash flow is $298 ($4k/yr) — positive.
- The deal already cash-flows at list — no discount required.
- Meets the 1% rule at list price ($814 rent vs $47k).
- Recommended offer: $44k (6.0% below list) — sets the bar for market timing.
- Cap rate 13.9% vs local median 4.9% in Carbondale — top-decile yield for the area; either an underpriced asset or a hidden risk that comps aren't pricing in. Stress-test before assuming the spread holds.
Location & tenants
- Location reads 70/100 on livability (#375 in IL) — a middle-class / working-renter tenant base. Strengths: amenities A+, commute A+, cost of living A+; Watch: housing C-, schools D+, crime F.
- Carbondale Chsd 165 (urban): math 26% / reading 35% proficiency, ranked #279 of 620 in IL (top 45%) — families likely to look elsewhere, expect single-tenant / working-renter base with shorter leases.
- Market conditions: Rents rising fast (+4.5%/yr); 202 active listings in the ZIP; lower-income renter base — watch delinquency; 5 units permitted in Jackson County in 2024 (0 in 5+ unit buildings).
Forward outlook
- Local home prices are declining (-3.0%/yr); year-one equity from $324 of loan paydown is wiped out by about $1k of value loss. Plan a longer hold.
- At projected returns (-3.0% appreciation + 4.5% rent growth), your $13k cash investment doubles in ~5 years — after that, you're playing with house money.
Negotiation context
- It's been on market 67 days — a 6% lower offer ($44k) is reasonable based on typical stale-listing flexibility.
- 7 sale attempts since 21y ago with the ask held roughly flat each time — persistent listings suggest the price (not the market) is what's stuck; bring a comps-based counter.
- Current owner paid $10k; list at $47k implies a 369% gain — meaningful room to come down on a strong offer.
Risks & watch-outs
- Watch-outs: built in 1948 — expect roof / HVAC / electrical / plumbing capex.
- Climate carrying-cost: extreme-heat days projected 7→21/yr by 2055 (HVAC capex compounding) — expect insurance premiums to compound above CPI over the hold.
Questions for the listing agent
- It's been on market 67 days. Have you received any prior offers? Is the seller open to a 6% concession, seller financing, or rate buy-down credit?
- Built in 1948 — when were the roof, HVAC, electrical panel, plumbing, and water heater last replaced?
- Why hasn't it sold? Are there any deal-killer items the seller is aware of (foundation, flood, title, zoning, code violations)?
- Is there a deadline driving the sale (1031 exchange, divorce, estate, relocation)? That informs how much negotiation room exists.
- Schools are D-rated, which usually means shorter tenancies and higher turnover. Who's the typical renter profile here, and what's been the actual vacancy rate?
- Crime grade is F in this area — have there been break-ins, vandalism, or insurance claims at this property in the last 3 years? What carrier currently insures it and at what premium?
- What's the average days-on-market for RENTAL listings here right now (not sales)? A rising rental-DOM trend means longer vacancies and softer asking-rent achievability than the comps imply.
- What's the recent tenant-quality profile in this submarket — average credit score on applications, eviction rate, late-payment / NSF rate, and stable-employment percentage? A property-management company in the area should have these aggregated.
- How much new for-sale + rental construction is in the pipeline within 1–3 miles? Heavy new supply typically softens prices + rents 12–24 months out; constrained supply supports both.
Investment metrics
- 1% rule
- 1.74% ✓
- Cap rate
- 13.92%
- Cash-on-cash
- 27.23%
- DSCR
- 2.21
- GRM
- 4.8
CMA / ARV
- ARV (on-the-fly)
- $104,760
- Comps found
- 12
Show comp detail 12 sales within ~0.75 mi
| Address | Dist | Beds/Ba | Sqft | Sold | Price | $/sf | Match |
|---|---|---|---|---|---|---|---|
| 603 N Allyn St | 0.23mi | 2/2.0 (+1) | 1,088 (+1%) | 2mo | $119,500 | $110 | 77 |
| 620 N Almond St | 0.19mi | 2/2.0 (+1) | 1,056 (-2%) | 5mo | $109,000 | $103 | 74 |
| 614 N Springer St | 0.18mi | 2/1.0 (+1) | 972 (-10%) | 0mo | $94,000 | $97 | 70 |
| 705 N Bridge St | 0.30mi | 2/1.0 (+1) | 960 (-11%) | 1mo | $99,395 | $104 | 62 |
| 517 N Michaels St | 0.46mi | 2/1.0 (+1) | 1,060 (-2%) | 13mo | $72,000 | $68 | 60 |
| 517 N Michaels St | 0.46mi | 2/1.0 (+1) | 1,060 (-2%) | 13mo | $72,000 | $68 | 60 |
| 300 N Oakland Ave | 0.51mi | 2/1.0 (+1) | 1,018 (-6%) | 4mo | $30,000 | $29 | 58 |
| 710 N Billy Bryan St | 0.39mi | 2/1.0 (+1) | 1,142 (+6%) | 11mo | $98,500 | $86 | 58 |
| 1007 W Willow St | 0.17mi | 2/1.5 (+1) | 925 (-14%) | 7mo | $98,580 | $107 | 56 |
| 1007 W Willow St | 0.17mi | 2/1.5 (+1) | 925 (-14%) | 7mo | $98,580 | $107 | 56 |
| 518 N Almond St | 0.30mi | 2/1.5 (+1) | 1,228 (+14%) | 10mo | $99,900 | $81 | 48 |
| 406 N Washington St | 0.68mi | 2/1.0 (+1) | 1,172 (+8%) | 8mo | $15,000 | $13 | 42 |
Match score weights: distance 35% · size 25% · config 20% · recency 20%. Top-matched comps best support the ARV.
Projected returns pro-forma
-3.0% appreciation · 4.51% rent growth · sell at horizon
- IRR
- 23.0%
- Equity multiple
- 1.96×
- Total profit
- $12,661
- Equity at exit
- $6,993
- IRR
- 32.0%
- Equity multiple
- 4.11×
- Total profit
- $40,879
- Equity at exit
- $4,055
Cash invested: $13,132 (down + closing). Projections, not guarantees.
Landlord ↔ Tenant lean methodology
- Overall (STATE)
- 43 Moderately Tenant-Leaning
- State Illinois
- 43 Moderately Tenant-Leaning · D+7
- County
- — inherits STATE
- City
- — inherits STATE
ZIP-level market 62901
- Rents YoY
- 4.5%
- Active inventory
- 202
- Price-to-rent
- 4.8×
Monthly cashflow live
- Estimated rent
- $814 medium interval (Pro) →
- Mortgage (P&I)
- −$246
- Tax from tax record
- −$80 /mo · $955/yr
- Insurance
- −$20
- HOA
- −$0
- Vacancy / Maint / Mgmt
- −$171
- Net cashflow
- $298
Break-even live
UW: 25.0% down · 7.5% · 30yr · 1.5% tax · 5.0% vac · 8.0% maint · 8.0% mgmt
Financing live
Cash to close
- Down payment
- $11,725
- Closing costs
- $1,407
- Reserves months
- —
- Total cash needed
- —
Loan-product check · same deal, 3 products live
Conventional
25% down · 7.5% · 30yr
- Down + closing
- —
- Monthly P&I
- —
- Monthly cashflow
- —
- DSCR
- —
- Eligible?
- —
Personal DTI + credit; lowest rate.
DSCR
20% down · 8.5% · 30yr
- Down + closing
- —
- Monthly P&I
- —
- Monthly cashflow
- —
- DSCR
- —
- Eligible?
- —
No personal income docs; deal must DSCR.
Hard money
10% down · 12.0% · 12mo
- Down + closing
- —
- Monthly P&I
- —
- Monthly cashflow
- —
- DSCR
- —
- Eligible?
- —
Short-term bridge; refi at stabilization.
Listing history 35 events
-
2026-06-19days on market $46,900 Active 67 DOM
-
2026-06-18days on market $46,900 Active 66 DOM
-
2026-06-17days on market $46,900 Active 65 DOM
-
2026-06-16days on market $46,900 Active 64 DOM
-
2026-06-15days on market $46,900 Active 63 DOM
-
2026-06-14days on market $46,900 Active 61 DOM
-
2026-06-13days on market $46,900 Active 60 DOM
-
2026-06-10days on market $46,900 Active 58 DOM
-
2026-06-09days on market $46,900 Active 57 DOM
-
2026-06-08days on market $46,900 Active 56 DOM
-
2026-06-07days on market $46,900 Active 55 DOM
-
2026-06-02days on market $46,900 Active 50 DOM
-
2026-06-01days on market $46,900 Active 49 DOM
-
2026-05-31days on market $46,900 Active 48 DOM
-
2026-05-30days on market $46,900 Active 47 DOM
-
2026-04-13$46,900 Active
-
2025-12-17historical
-
2025-07-09price
-
2025-06-29Active
-
2025-06-16historical
-
2025-06-16historical
-
2025-06-06price
-
2025-05-28price
-
2025-05-05Active
-
2021-08-06historical
-
2020-05-21soldstatus $10,000
-
2020-05-21soldstatus $10,000
-
2019-12-06$14,800
-
2019-12-06$14,800
-
2019-03-13historical
-
2007-04-27soldstatus $40,900
-
2007-04-27soldstatus $40,900
-
2007-04-01soldstatus $40,900
-
2005-10-12$42,900
-
2005-10-12$42,900
ⓘ Source: listings_history table (triggers on properties + properties_extension) + one-shot
backfill from property_details.listing_events for pre-trigger history.
Tax reassessment forecast IL · Partial reset (capped growth)
- Current annual tax
- $955 · $80/mo
- Projected year-2 tax
- $1,010 · $84/mo
- Expected delta
- +$55/yr (+$5/mo · 5.7%)
ⓘ Screening estimate from a state-policy table — verify with the county assessor before closing.
Climate risk First Street
- Flood 1/10 Low FEMA zone X (unshaded) · 0% chance over 30 yrs
- Wildfire 1/10 Low
- Heat 5/10 Major 7 d/yr ≥107°F today · 21 d/yr by 30 yrs out
- Wind 2/10 Low 3% chance of damaging wind over 30 yrs
- Air quality 2/10 Low 0 unhealthy d/yr today · 1 by 30 yrs out
Nearby sold comps map
Loading sold comps map…
Walkable amenities ~0.75 mi
Loading nearby amenities…
Taxation est. · year 1
- Rental income
- $9,768
- − Mortgage interest
- −$2,627
- − Property taxes
- −$955
- − Insurance
- −$234
- − Repairs & maintenance
- −$781
- − Management
- −$781
- − Depreciation
- −$1,364
- Taxable income
- $3,024
- Est. tax owed @ 24.0%
- −$726
- After-tax cash flow
- $2,850/yr
For passive investors: Depreciation is non-cash, so a rental often shows a tax loss while cash-flowing — sheltering income. Rental losses are passive: they offset passive income freely, and up to $25,000/yr can offset ordinary (W-2) income if you actively participate and your MAGI is under $100k (phasing out to $0 by $150k); unused losses carry forward. On sale, claimed depreciation is recaptured at up to 25%, and gains may owe capital-gains tax (a 1031 exchange can defer both). Figures are a year-1 estimate at your 24.0% rate — not tax advice; consult a CPA.
Schools (NCES district)
- District
- Carbondale Chsd 165
- NCES district ID
- 1708370
- Math proficiency
- 26% ▼ -10.00%
- Reading proficiency
- 35% ▼ -2.00%
- Median HH income
- $22,075
- Composite
- 23.92/100
- National rank
- #7787
- State rank
- #279 of 620 in IL
Livability — Carbondale
- Score
- 70/100
- State rank
- #375
- US rank
- #7806
Category grades
Schools grade is shown separately in the Schools card above.
Census & demographics
- Census place
- Carbondale, IL
- County
- Jackson County · 22,946 people
- City population
- 22,946
- Metro
- Carbondale-Marion, IL
- Population (ZIP)
- 22,946
- Household income
- $35,089
- Rent vs Own
- Severe rent burden
- 2038.0
Population outlook (Jackson County) Hauer SSP2
- Today (2025)
- 59,093 people
- By 2030
- 59,628 · +0.9%
- By 2040
- 59,495 · +0.7%
- By 2050
- 58,811 · -0.5%
- By 2075
- 57,683 · -2.4%
- By 2100
- 55,337 · -6.4%
Race, ethnicity, and origin ACS 2023
- Neighborhood character
- Diverse neighborhood (Simpson 0.58)
- Race & ethnicity
- White 59% Black 26% Asian 6% Hispanic / Latino 5% Two or more races 5%
- Hispanic origin (detail)
- Mexican 4%
- Common ancestry
- Romanian 2% Italian 2% Slovak 2%
- Foreign-born
- 9% · Canada, China, South Korea
- Languages at home
- 87% English-only · Other Indo-European 4% Spanish 4% Arabic 2%
Political lean MEDSL · Jackson
- 2024 margin
- Toss-up / Even · D 51.0% · R 47.5% · Other 1.4%
- 2008→2024 swing
- -18.3pp toward R · 2008: 21.8pp · 2024: 3.5pp
- All cycles
- 2024: D+3.5 2020: D+1.3 2016: D+3.0 2012: D+10.3 2008: D+21.8
Not yet ingested
- Civics
- —
Market trends
- HPI YoY
- ▼ -75.62%
- Current HPI
- 88.7209
- Rent YoY
- ▲ 4.51%
- Metro
- Carbondale-Marion, IL
- State GDP YoY
- ▲ 1.59%
- F500 in state
- 60
Industry mix (Fortune 500 HQ in IL)
| Industry | F500 HQs | Revenue |
|---|---|---|
| Insurance | 4 | $201B |
|
||
| Consumer Goods | 4 | $87B |
|
||
| Industrial Machinery | 3 | $64B |
|
||
| Healthcare | 2 | $55B |
|
||
| Retail / Pharmacy | 1 | $148B |
|
||
| Agriculture / Food | 1 | $86B |
|
||
Price history
+9.3% since first listed20 events — show timeline
- 2026-04-13 Listed $46,900 MRED as Distributed by MLS Grid
- 2025-12-17 Listing Removed — MRED as Distributed by MLS Grid
- 2025-07-09 Price Changed — RMLSA as Distributed by MLS Grid
- 2025-06-29 Listed — RMLSA as Distributed by MLS Grid
- 2025-06-16 Listing Removed — RMLSA as Distributed by MLS Grid
- 2025-06-16 Listing Removed — MRED as Distributed by MLS Grid
- 2025-06-06 Price Changed — RMLSA as Distributed by MLS Grid
- 2025-05-28 Price Changed — RMLSA as Distributed by MLS Grid
- 2025-05-05 Listed — RMLSA as Distributed by MLS Grid
- 2021-08-06 Listing Removed — RMLSA as Distributed by MLS Grid
- 2020-05-21 Sold (MLS) $10,000 MRED as Distributed by MLS Grid
- 2020-05-21 Sold (MLS) $10,000 RMLSA as Distributed by MLS Grid
- 2019-12-06 Listed $14,800 MRED as Distributed by MLS Grid
- 2019-12-06 Listed $14,800 RMLSA as Distributed by MLS Grid
- 2019-03-13 Listing Removed — MRED as Distributed by MLS Grid
- 2007-04-27 Sold (MLS) $40,900 RMLSA as Distributed by MLS Grid
- 2007-04-27 Sold (MLS) $40,900 MRED as Distributed by MLS Grid
- 2007-04-01 Sold (Public Records) $40,900 Public Records
- 2005-10-12 Listed $42,900 RMLSA as Distributed by MLS Grid
- 2005-10-12 Listed $42,900 MRED as Distributed by MLS Grid
Property tax history
-6.1%/yrLatest (2024): $955 · +6.4% YoY. Source: county tax records.
Cash-flow waterfall
monthlySold comps — $/sqft
last 12 mo · ≤1 miLoading sold comps…