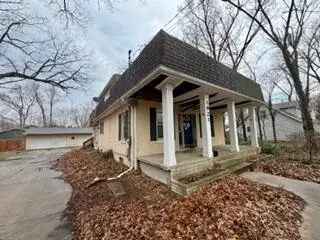
1921 E Coolspring Ave · Trail Creek, IN
Flood risk 3/10 · Minor
- FEMA flood zone
- X (unshaded)
- Chance of flooding over 30 yrs
- 0.2%
- Est. flood insurance / yr
- $473 – $860
Fire risk 1/10 · Minimal
- Est. fire insurance / yr
- $717 – $1,331
Heat risk 2/10 · Minimal
- Hot days now (above 100°F)
- 7 days/yr
- Hot days in 30 yrs
- 14 days/yr
Wind risk 2/10 · Minimal
- Chance of severe wind over 30 yrs
- —
Air-quality risk 3/10 · Minor
- Unhealthy air days now
- 2 days/yr
- Unhealthy air days in 30 yrs
- 3 days/yr
Risk factors via First Street. Map © Google.
Why this score? — see what drove the B- grade
The composite is a weighted blend of 9 inputs, each scored 0–100. Each bar is that input's sub-score; the figure is the points it added to the 100-point composite (weight × sub-score).
- Cash flow +26.0/30.0
- ARV discount +15.0/15.0
- DSCR +8.7/10.0
- 1% rule +6.8/10.0
- Rent growth +4.9/5.0
- Livability +3.7/5.0
- Condition / age +2.5/5.0
- Schools +2.2/10.0
- Appreciation +0.0/10.0
$139,900
🖨 Deal sheet 📄 Offer letter ✓ Due diligence
Listing remarks MLS
Trail Creek - This character-filled home waiting for the right vision. This spacious layout offers 4 bedrooms, 2.5 car garage, shed, a front porch, and generous outdoor living with two back decks. Bring your contractor or your design board: with a full unfinished basement, there's room to expand.
Key facts
- Two back decks
- Front porch
- 0.28 acre lot
Tags
Neighborhood map
What this means for you Summary
Snapshot
- This is a 4-bed/2.0-bath single-family listed at $140k.
Deal economics
- At list price, monthly cash flow is $346 ($4k/yr) — positive.
- The deal already cash-flows at list — no discount required.
- Meets the 1% rule at list price ($2k rent vs $140k).
- Recommended offer: $132k (6.0% below list) — sets the bar for market timing.
Location & tenants
- Location reads 74/100 on livability (#71 in IN, #4,553 nationally) — a middle-class / working-renter tenant base. Strengths: crime A+, cost of living A+, housing A+; Watch: schools D-, amenities F, commute F.
- Michigan City Area Schools (urban): math 23% / reading 28% proficiency, ranked #262 of 301 in IN (top 87%) — low school quality limits family demand, transient renter base, plan for 1-2y turnover; 68% free/reduced lunch — lower-income household profile, screen leases tightly.
- Market conditions: Rents rising fast (+9.7%/yr); 371 active listings in the ZIP; 2 comparable units currently listed for rent nearby; 216 units permitted in LaPorte County in 2024 (75 in 5+ unit buildings).
- This rent runs 34% of the median local income ($59k/yr) — at the standard rent-burdened threshold; future hikes will face affordability resistance.
Forward outlook
- Local home prices are declining (-3.0%/yr); year-one equity from $967 of loan paydown is wiped out by about $4k of value loss. Plan a longer hold.
- LaPorte County population projected to shrink 7% by 2050 — rents likely to lag national; underwrite the cash flow, not the appreciation.
- At projected returns (-3.0% appreciation + 8.0% rent growth), your $39k cash investment doubles in ~7 years — after that, you're playing with house money.
Negotiation context
- It's been on market 79 days — a 6% lower offer ($132k) is reasonable based on typical stale-listing flexibility.
- 4 sale attempts since 25y ago; this cycle's ask has dropped $10k (7%) from the opening price — seller is motivated, your offer sets the floor, not the list.
Risks & watch-outs
- Watch-outs: built in 1940 — expect roof / HVAC / electrical / plumbing capex.
Questions for the listing agent
- It's been on market 79 days. Have you received any prior offers? Is the seller open to a 6% concession, seller financing, or rate buy-down credit?
- Built in 1940 — when were the roof, HVAC, electrical panel, plumbing, and water heater last replaced?
- Why hasn't it sold? Are there any deal-killer items the seller is aware of (foundation, flood, title, zoning, code violations)?
- Is there a deadline driving the sale (1031 exchange, divorce, estate, relocation)? That informs how much negotiation room exists.
- Schools are D-rated, which usually means shorter tenancies and higher turnover. Who's the typical renter profile here, and what's been the actual vacancy rate?
- What's the average days-on-market for RENTAL listings here right now (not sales)? A rising rental-DOM trend means longer vacancies and softer asking-rent achievability than the comps imply.
- What's the recent tenant-quality profile in this submarket — average credit score on applications, eviction rate, late-payment / NSF rate, and stable-employment percentage? A property-management company in the area should have these aggregated.
- How much new for-sale + rental construction is in the pipeline within 1–3 miles? Heavy new supply typically softens prices + rents 12–24 months out; constrained supply supports both.
Investment metrics
- 1% rule
- 1.18% ✓
- Cap rate
- 9.26%
- Cash-on-cash
- 10.61%
- DSCR
- 1.47
- GRM
- 7.0
CMA / ARV
- ARV (median comp)
- $244,396
- List price
- $139,900
- Delta
- -42.76%
- Verdict
- UNDERPRICED
- Comps
- 20 within 1.0 mi
Show comp detail 12 sales within ~0.75 mi
| Address | Dist | Beds/Ba | Sqft | Sold | Price | $/sf | Match |
|---|---|---|---|---|---|---|---|
| 417 Laurel Dr | 0.41mi | 3/2.5 (-1) | 1,820 (-2%) | 1mo | $283,000 | $155 | 71 |
| 2118 Red Oak Dr | 0.29mi | 4/2.0 | 1,941 (+5%) | 10mo | $300,000 | $155 | 70 |
| 617 Black Oak Dr | 0.37mi | 4/2.0 | 1,761 (-5%) | 8mo | $225,000 | $128 | 68 |
| 2321 Greenwood Ave | 0.55mi | 4/2.0 | 1,872 (+1%) | 6mo | $225,000 | $120 | 68 |
| 613 Dogwood Dr | 0.38mi | 3/1.5 (-1) | 1,804 (-2%) | 5mo | $245,000 | $136 | 67 |
| 207 Meadowlark Dr | 0.47mi | 4/2.0 | 1,786 (-4%) | 7mo | $235,000 | $132 | 67 |
| 105 Starling Dr | 0.25mi | 4/2.0 | 2,090 (+13%) | 7mo | $289,950 | $139 | 61 |
| 302 Johnson Rd | 0.42mi | 3/2.0 (-1) | 1,762 (-5%) | 11mo | $240,000 | $136 | 58 |
| 314 White Oak Dr | 0.39mi | 3/2.0 (-1) | 1,707 (-8%) | 14mo | $268,000 | $157 | 52 |
| 1921 Welnetz Rd | 0.26mi | 3/2.0 (-1) | 1,572 (-15%) | 10mo | $275,000 | $175 | 49 |
| 419 Spruce Dr | 0.52mi | 3/2.0 (-1) | 1,643 (-11%) | 8mo | $245,000 | $149 | 46 |
| 403 Firefly Dr | 0.65mi | 3/1.5 (-1) | 2,100 (+14%) | 8mo | $292,500 | $139 | 33 |
Match score weights: distance 35% · size 25% · config 20% · recency 20%. Top-matched comps best support the ARV.
Projected returns pro-forma
-3.0% appreciation · 8.0% rent growth · sell at horizon
- IRR
- 5.1%
- Equity multiple
- 1.21×
- Total profit
- $8,166
- Equity at exit
- $20,860
- IRR
- 18.7%
- Equity multiple
- 2.93×
- Total profit
- $75,464
- Equity at exit
- $12,096
Cash invested: $39,172 (down + closing). Projections, not guarantees.
Landlord ↔ Tenant lean methodology
- Overall (STATE)
- 90 Strongly Landlord-Friendly
- State Indiana
- 90 Strongly Landlord-Friendly · R+11
- County
- — inherits STATE
- City
- — inherits STATE
ZIP-level market 46360
- Rents YoY
- 9.7%
- Active inventory
- 371
- Price-to-rent
- 7.0×
Monthly cashflow live
- Estimated rent
- $1,657 medium interval (Pro) →
- Mortgage (P&I)
- −$734
- Tax from tax record
- −$171 /mo · $2,052/yr
- Insurance
- −$58
- HOA
- −$0
- Vacancy / Maint / Mgmt
- −$348
- Net cashflow
- $346
Break-even live
UW: 25.0% down · 7.5% · 30yr · 1.5% tax · 5.0% vac · 8.0% maint · 8.0% mgmt
Financing live
Cash to close
- Down payment
- $34,975
- Closing costs
- $4,197
- Reserves months
- —
- Total cash needed
- —
Loan-product check · same deal, 3 products live
Conventional
25% down · 7.5% · 30yr
- Down + closing
- —
- Monthly P&I
- —
- Monthly cashflow
- —
- DSCR
- —
- Eligible?
- —
Personal DTI + credit; lowest rate.
DSCR
20% down · 8.5% · 30yr
- Down + closing
- —
- Monthly P&I
- —
- Monthly cashflow
- —
- DSCR
- —
- Eligible?
- —
No personal income docs; deal must DSCR.
Hard money
10% down · 12.0% · 12mo
- Down + closing
- —
- Monthly P&I
- —
- Monthly cashflow
- —
- DSCR
- —
- Eligible?
- —
Short-term bridge; refi at stabilization.
Rent comps 2 comps
| Address | Beds | Baths | Sqft | Rent | $/sqft | DOM | Units | Dist |
|---|---|---|---|---|---|---|---|---|
| 910 S Carroll Ave Michigan City, IN | 2.0–3.0 | 2.0 | 1187 | $1,600 | $1.35 | 43d | 3 | 0.50mi |
| 403 Herring Gull Ln Michigan City, IN | 1.0–4.0 | 1.0–2.0 | 1083 | $1,325 | $1.22 | 43d | 1 | 0.90mi |
Listing history 23 events
-
2026-06-19days on market $139,900 Active 79 DOM
-
2026-06-18days on market $139,900 Active 78 DOM
-
2026-06-17days on market $139,900 Active 77 DOM
-
2026-06-16days on market $139,900 Active 76 DOM
-
2026-06-15days on market $139,900 Active 75 DOM
-
2026-06-14days on market $139,900 Active 73 DOM
-
2026-06-13days on market $139,900 Active 72 DOM
-
2026-06-10days on market $139,900 Active 70 DOM
-
2026-06-09days on market $139,900 Active 69 DOM
-
2026-06-08days on market $139,900 Active 68 DOM
-
2026-06-07days on market $139,900 Active 67 DOM
-
2026-06-03days on market $139,900 Active 63 DOM
-
2026-06-02days on market $139,900 Active 62 DOM
-
2026-06-01days on market $139,900 Active 61 DOM
-
2026-05-31days on market $139,900 Active 60 DOM
-
2026-05-30days on market $139,900 Active 59 DOM
-
2026-05-07price $139,900 297-char remark
Show marketing remark (297 chars)
Trail Creek - This character-filled home waiting for the right vision. This spacious layout offers 4 bedrooms, 2.5 car garage, shed, a front porch, and generous outdoor living with two back decks. Bring your contractor or your design board: with a full unfinished basement, there's room to expand.
-
2026-03-30$149,900 Active 297-char remark
Show marketing remark (297 chars)
Trail Creek - This character-filled home waiting for the right vision. This spacious layout offers 4 bedrooms, 2.5 car garage, shed, a front porch, and generous outdoor living with two back decks. Bring your contractor or your design board: with a full unfinished basement, there's room to expand.
-
2018-07-25soldstatus $159,000 389-char remark
Show marketing remark (389 chars)
Charming 4 bedroom, 2 bath home in Trail Creek with beautiful yard and flowering gardens. Updated bathrooms, newer furnace and central a/c. Vinyl tilt-in windows, oak trim and stair railing. Gas log wall-flush fireplace and a roof top patio. Oversized 22 x 32 garage with plenty of off street parking. Home Warranty included. The listing information is deemed reliable, but not guaranteed.
-
2018-05-15$155,000 389-char remark
Show marketing remark (389 chars)
Charming 4 bedroom, 2 bath home in Trail Creek with beautiful yard and flowering gardens. Updated bathrooms, newer furnace and central a/c. Vinyl tilt-in windows, oak trim and stair railing. Gas log wall-flush fireplace and a roof top patio. Oversized 22 x 32 garage with plenty of off street parking. Home Warranty included. The listing information is deemed reliable, but not guaranteed.
-
2003-11-20historical
-
2002-02-28$109,900
-
2001-04-17$110,000
ⓘ Source: listings_history table (triggers on properties + properties_extension) + one-shot
backfill from property_details.listing_events for pre-trigger history.
Tax reassessment forecast IN · Partial reset (capped growth)
- Current annual tax
- $2,052 · $171/mo
- Projected year-2 tax
- $2,052 · $171/mo
- Expected delta
- $0/yr ($0/mo · 0.0%)
ⓘ Screening estimate from a state-policy table — verify with the county assessor before closing.
Climate risk First Street
- Flood 3/10 Moderate FEMA zone X (unshaded) · 20% chance over 30 yrs
- Wildfire 1/10 Low
- Heat 2/10 Low 7 d/yr ≥100°F today · 14 d/yr by 30 yrs out
- Wind 2/10 Low
- Air quality 3/10 Moderate 2 unhealthy d/yr today · 3 by 30 yrs out
Nearby sold comps map
Loading sold comps map…
Walkable amenities ~0.75 mi
Loading nearby amenities…
Taxation est. · year 1
- Rental income
- $19,887
- − Mortgage interest
- −$7,837
- − Property taxes
- −$2,052
- − Insurance
- −$700
- − Repairs & maintenance
- −$1,591
- − Management
- −$1,591
- − Depreciation
- −$4,070
- Taxable income
- $2,047
- Est. tax owed @ 24.0%
- −$491
- After-tax cash flow
- $3,664/yr
For passive investors: Depreciation is non-cash, so a rental often shows a tax loss while cash-flowing — sheltering income. Rental losses are passive: they offset passive income freely, and up to $25,000/yr can offset ordinary (W-2) income if you actively participate and your MAGI is under $100k (phasing out to $0 by $150k); unused losses carry forward. On sale, claimed depreciation is recaptured at up to 25%, and gains may owe capital-gains tax (a 1031 exchange can defer both). Figures are a year-1 estimate at your 24.0% rate — not tax advice; consult a CPA.
Schools (NCES district)
- District
- Michigan City Area Schools
- NCES district ID
- 1806570
- Math proficiency
- 23% ▼ -16.00%
- Reading proficiency
- 28% ▼ -10.00%
- Median HH income
- $42,629
- Composite
- 21.76/100
- National rank
- #8257
- State rank
- #262 of 301 in IN
Livability — Trail Creek
- Score
- 74/100
- State rank
- #71
- US rank
- #4553
Category grades
Schools grade is shown separately in the Schools card above.
Census & demographics
- Census place
- Trail Creek, IN
- County
- La Porte County · 88,580 people
- Metro
- Michigan City-La Porte, IN
- Population (ZIP)
- 43,817
- Household income
- $59,266
- Rent vs Own
- Severe rent burden
- 1152.0
Population outlook (LaPorte County) Hauer SSP2
- Today (2025)
- 109,757 people
- By 2030
- 108,288 · -1.3%
- By 2040
- 105,070 · -4.3%
- By 2050
- 102,330 · -6.8%
- By 2075
- 97,009 · -11.6%
- By 2100
- 86,459 · -21.2%
Race, ethnicity, and origin ACS 2023
- Neighborhood character
- Predominantly White (67%)
- Race & ethnicity
- White 67% Black 20% Hispanic / Latino 8% Two or more races 7%
- Hispanic origin (detail)
- Mexican 5%
- Common ancestry
- Romanian 11% Lithuanian 2% Iranian 1%
- Foreign-born
- 3% · Canada
- Languages at home
- 95% English-only · Spanish 3%
Political lean MEDSL · LaPorte
- 2024 margin
- R (+14.1) · D 42.1% · R 56.2% · Other 1.7%
- 2008→2024 swing
- -19.1pp toward R · 2008: 5.0pp · 2024: -14.1pp
- All cycles
- 2024: R+14.1 2020: R+7.2 2016: R+6.4 2012: D+12.6 2008: D+5.0
Not yet ingested
- Civics
- —
Market trends
- HPI YoY
- ▼ -210.27%
- Current HPI
- 206.0882
- Rent YoY
- ▲ 9.72%
- Metro
- Michigan City-La Porte, IN
- State GDP YoY
- ▲ 2.90%
- F500 in state
- 18
Industry mix (Fortune 500 HQ in IN)
| Industry | F500 HQs | Revenue |
|---|---|---|
| Industrial Machinery | 2 | $37B |
|
||
| Healthcare | 1 | $177B |
|
||
| Pharmaceuticals | 1 | $45B |
|
||
| Metals / Steel | 1 | $18B |
|
||
| Agriculture | 1 | $17B |
|
||
| Packaging | 1 | $12B |
|
||
Price history
+27.2% since first listed7 events — show timeline
- 2026-05-07 Price Changed $139,900 NIRA MLS as Distributed by MLS Grid
- 2026-03-30 Listed $149,900 NIRA MLS as Distributed by MLS Grid
- 2018-07-25 Sold (MLS) $159,000 NIRA MLS as Distributed by MLS Grid
- 2018-05-15 Listed $155,000 NIRA MLS as Distributed by MLS Grid
- 2003-11-20 Listing Removed — NIRA MLS as Distributed by MLS Grid
- 2002-02-28 Listed $109,900 NIRA MLS as Distributed by MLS Grid
- 2001-04-17 Listed $110,000 NIRA MLS as Distributed by MLS Grid
Property tax history
+5.6%/yrLatest (2024): $2,052 · +0.1% YoY. Source: county tax records.
Cash-flow waterfall
monthlySold comps — $/sqft
last 12 mo · ≤1 miLoading sold comps…