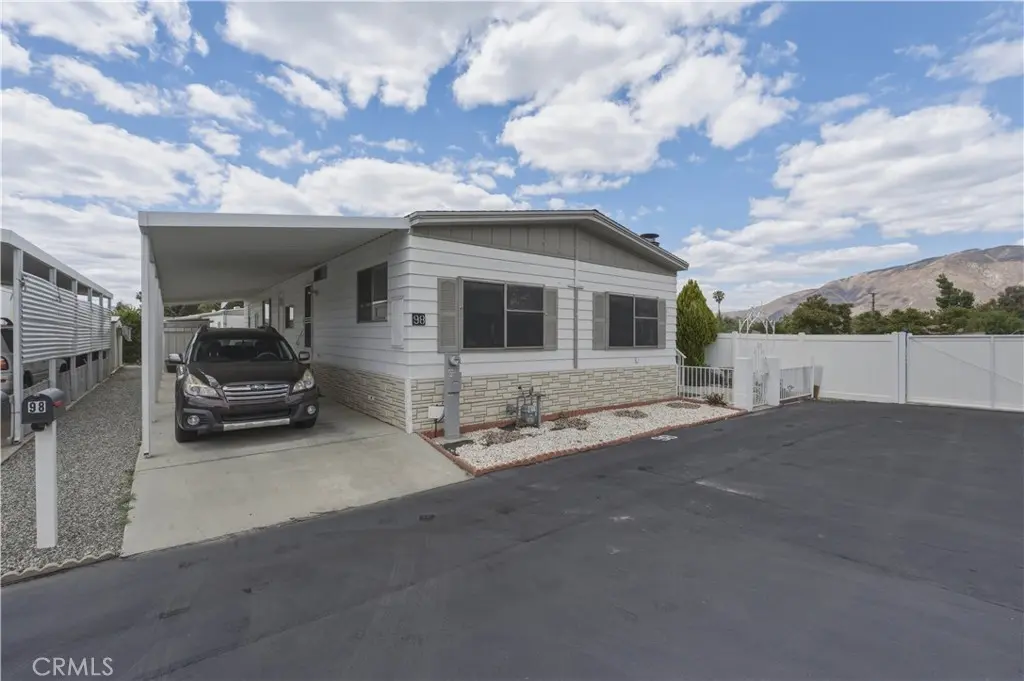
655 E Main #98 · San Jacinto, CA
Flood risk 1/10 · Minimal
- FEMA flood zone
- X
- Chance of flooding over 30 yrs
- 0.0%
- Est. flood insurance / yr
- $507 – $1,088
Fire risk 8/10 · Major
- Est. fire insurance / yr
- $659 – $1,223
Heat risk 8/10 · Major
- Hot days now (above 103°F)
- 6 days/yr
- Hot days in 30 yrs
- 17 days/yr
Wind risk 1/10 · Minimal
- Chance of severe wind over 30 yrs
- —
Air-quality risk 6/10 · Moderate
- Unhealthy air days now
- 11 days/yr
- Unhealthy air days in 30 yrs
- 13 days/yr
Risk factors via First Street. Map © Google.
Why this score? — see what drove the B+ grade
The composite is a weighted blend of 9 inputs, each scored 0–100. Each bar is that input's sub-score; the figure is the points it added to the 100-point composite (weight × sub-score).
- Cash flow +30.0/30.0
- ARV discount +15.0/15.0
- 1% rule +10.0/10.0
- DSCR +10.0/10.0
- Rent growth +3.2/5.0
- Livability +3.2/5.0
- Condition / age +2.5/5.0
- Schools +2.1/10.0
- Appreciation +0.0/10.0
$95,000
🖨 Deal sheet 📄 Offer letter ✓ Due diligence
Listing remarks MLS
HIDDEN TREASURE!!! COMPLETELY REMODELED TRIPLEWIDE!!! This home has composition roof, central air, fenced yard, TWO sheds, workshop, LOVELY VIEW OF MOUNTAINS FROM PATIO, living room has wood burning fireplace, kitchen with modern appliances, breakfast bar, formal dining room, den, HUGE master bedroom with walk-in closet, LARGE master bath with tub and separate shower, textured walls, and washer/dryer. Home is COMPLETELY FURNISHED. This home is located in a senior 55+ community. Potential buyer shall be park approved prior to submitting offer to seller for acceptance.
Key facts
- Breathtaking views
- Private patio
- Community pool
Tags
Property features AI
Finance
- Other: Living area source: assessor's data; Property parcel number 009718969; Located near Camino Los Banos (cross street)
- HOA & community: Senior community; Land lease payment of $670.82
Exterior
- Parking: Located in Caravana park
- Utilities: Public sewer; Water: see remarks
- Home design: Single-story property; Mobile home (29 ft x 64 ft) — mobile home remains
- Construction: Year built recorded by assessor; Total of 1 story
- Exterior features: Community pool; Back yard; Sidewalks
Interior
- Bathrooms: 2 full bathrooms
- Heating & cooling: Central furnace heating
- Interior features: One-level home; Entry on the first level
- Laundry & utility: Laundry inside
Neighborhood map
What this means for you Summary
Snapshot
- This is a 2-bed/2.0-bath manufactured listed at $95k.
Deal economics
- At list price, monthly cash flow is $2k ($18k/yr) — positive.
- The deal already cash-flows at list — no discount required.
- Meets the 1% rule at list price ($3k rent vs $95k).
- Recommended offer: $92k (3.0% below list) — sets the bar for market timing.
- Cap rate 25.3% vs local median 3.8% in San Jacinto — top-decile yield for the area; either an underpriced asset or a hidden risk that comps aren't pricing in. Stress-test before assuming the spread holds.
Location & tenants
- Location reads 63/100 on livability (#467 in CA) — a middle-class / working-renter tenant base. Strengths: housing A+; Watch: employment D+, schools D-, amenities F.
- San Jacinto Unified (suburban): math 13% / reading 36% proficiency, ranked #421 of 517 in CA (top 81%) — low school quality limits family demand, transient renter base, plan for 1-2y turnover; 68% free/reduced lunch — lower-income household profile, screen leases tightly.
- Market conditions: Rents rising (+2.6%/yr); 159 active listings in the ZIP; 10 comparable units currently listed for rent nearby; rentals at typical pace (median 15d on market — plan ~3-4 weeks tenant-placement turnaround); 9,195 units permitted in Riverside County in 2024 (1,512 in 5+ unit buildings).
- At $2,606/mo this rent would consume 46% of the median local household income ($68k/yr) (locally 747% of renters already pay >50% of income on rent) — very limited rent-growth headroom before tenants either downsize or default.
Forward outlook
- Local home prices are declining (-3.0%/yr); year-one equity from $657 of loan paydown is wiped out by about $3k of value loss. Plan a longer hold.
- Riverside County population projected at +22% by 2050 — long-run rental-demand tailwind backs the buy-and-hold thesis.
- At projected returns (-3.0% appreciation + 2.6% rent growth), your $27k cash investment doubles in ~2 years — after that, you're playing with house money.
Negotiation context
- It's been on market 49 days — a 3% lower offer ($92k) is reasonable based on typical stale-listing flexibility.
- 2 sale attempts since 5y ago with the ask held roughly flat each time — persistent listings suggest the price (not the market) is what's stuck; bring a comps-based counter.
- Current owner paid $60k; list at $95k implies a 58% gain — meaningful room to come down on a strong offer.
Risks & watch-outs
- Climate carrying-cost: severe wildfire risk; extreme-heat days projected 6→17/yr by 2055 (HVAC capex compounding) — expect insurance premiums to compound above CPI over the hold.
Questions for the listing agent
- It's been on market 49 days. Have you received any prior offers? Is the seller open to a 3% concession, seller financing, or rate buy-down credit?
- Built in 1976 — when were the roof, HVAC, electrical panel, plumbing, and water heater last replaced?
- Is there a deadline driving the sale (1031 exchange, divorce, estate, relocation)? That informs how much negotiation room exists.
- Schools are D-rated, which usually means shorter tenancies and higher turnover. Who's the typical renter profile here, and what's been the actual vacancy rate?
- What's the average days-on-market for RENTAL listings here right now (not sales)? A rising rental-DOM trend means longer vacancies and softer asking-rent achievability than the comps imply.
- What's the recent tenant-quality profile in this submarket — average credit score on applications, eviction rate, late-payment / NSF rate, and stable-employment percentage? A property-management company in the area should have these aggregated.
- How much new for-sale + rental construction is in the pipeline within 1–3 miles? Heavy new supply typically softens prices + rents 12–24 months out; constrained supply supports both.
Investment metrics
- 1% rule
- 2.74% ✓
- Cap rate
- 25.26%
- Cash-on-cash
- 67.74%
- DSCR
- 4.01
- GRM
- 3.0
CMA / ARV
- ARV (median comp)
- $119,231
- List price
- $95,000
- Delta
- -20.32%
- Verdict
- UNDERPRICED
- Comps
- 20 within 1.0 mi
Projected returns pro-forma
-3.0% appreciation · 2.61% rent growth · sell at horizon
- IRR
- 66.7%
- Equity multiple
- 3.98×
- Total profit
- $79,206
- Equity at exit
- $14,165
- IRR
- 70.8%
- Equity multiple
- 8.06×
- Total profit
- $187,887
- Equity at exit
- $8,214
Cash invested: $26,600 (down + closing). Projections, not guarantees.
Landlord ↔ Tenant lean methodology
- Overall (STATE)
- 18 Strongly Tenant-Friendly
- State California
- 18 Strongly Tenant-Friendly · D+13
- County
- — inherits STATE
- City
- — inherits STATE
ZIP-level market 92583
- Home prices YoY
- -14.8%
- Rents YoY
- 2.6%
- Active inventory
- 159
- Price-to-rent
- 3.0×
Monthly cashflow live
- Estimated rent
- $2,606 high interval (Pro) →
- Mortgage (P&I)
- −$498
- Tax from tax record
- −$20 /mo · $237/yr
- Insurance
- −$40
- HOA
- −$0
- Vacancy / Maint / Mgmt
- −$547
- Net cashflow
- $1,502
Break-even live
UW: 25.0% down · 7.5% · 30yr · 1.5% tax · 5.0% vac · 8.0% maint · 8.0% mgmt
Financing live
Cash to close
- Down payment
- $23,750
- Closing costs
- $2,850
- Reserves months
- —
- Total cash needed
- —
Loan-product check · same deal, 3 products live
Conventional
25% down · 7.5% · 30yr
- Down + closing
- —
- Monthly P&I
- —
- Monthly cashflow
- —
- DSCR
- —
- Eligible?
- —
Personal DTI + credit; lowest rate.
DSCR
20% down · 8.5% · 30yr
- Down + closing
- —
- Monthly P&I
- —
- Monthly cashflow
- —
- DSCR
- —
- Eligible?
- —
No personal income docs; deal must DSCR.
Hard money
10% down · 12.0% · 12mo
- Down + closing
- —
- Monthly P&I
- —
- Monthly cashflow
- —
- DSCR
- —
- Eligible?
- —
Short-term bridge; refi at stabilization.
Rent comps 10 comps
| Address | Beds | Baths | Sqft | Rent | $/sqft | DOM | Units | Dist |
|---|---|---|---|---|---|---|---|---|
| 621 S Mistletoe Ave San Jacinto, CA | 2.0 | 2.0 | 1500 | $2,000 | $1.33 | 43d | 1 | 0.38mi |
| 492 Foursquare Pl San Jacinto, CA | 3.0 | 2.0 | 1573 | $3,500 | $2.23 | 1d | 1 | 0.39mi |
| 646 Field Maple Pl GLMN HOT SPGS, CA | 3.0–4.0 | 2.0–3.0 | 1825 | $2,850 | $1.56 | 1d | 9 | 0.59mi |
| 1129 Osprey St San Jacinto, CA | 3.0 | 2.0 | 1582 | $2,700 | $1.71 | 43d | 1 | 0.60mi |
| 289 Brown St San Jacinto, CA | 2.0 | 1.0 | 1400 | $2,300 | $1.64 | 43d | 1 | 1.00mi |
| 904 Bergamo Ave San Jacinto, CA | 2.0 | 2.0 | 1596 | $2,600 | $1.63 | 10d | 1 | 1.19mi |
| 165 Tiger Ln San Jacinto, CA | 2.0 | 2.0 | 1339 | $2,150 | $1.61 | 3d | 1 | 1.22mi |
| 643 Laxford Rd San Jacinto, CA | 3.0 | 2.5 | 1967 | $2,600 | $1.32 | 15d | 1 | 1.27mi |
| 905 Verona Ave San Jacinto, CA | 2.0 | 2.0 | 1417 | $2,300 | $1.62 | 17d | 1 | 1.34mi |
| 1775 S Santa Fe Ave San Jacinto, CA | 3.0 | 2.0 | 1300 | $2,850 | $2.19 | 1d | 1 | 1.41mi |
Listing history 18 events
-
2026-06-18days on market $95,000 Active 49 DOM
-
2026-06-17days on market $95,000 Active 48 DOM
-
2026-06-16days on market $95,000 Active 47 DOM
-
2026-06-15days on market $95,000 Active 46 DOM
-
2026-06-13days on market $95,000 Active 44 DOM
-
2026-06-13days on market $95,000 Active 43 DOM
-
2026-06-09days on market $95,000 Active 40 DOM
-
2026-06-08days on market $95,000 Active 39 DOM
-
2026-06-07days on market $95,000 Active 38 DOM
-
2026-06-04days on market $95,000 Active 35 DOM
-
2026-06-03days on market $95,000 Active 34 DOM
-
2026-06-02days on market $95,000 Active 33 DOM
-
2026-06-01days on market $95,000 Active 32 DOM
-
2026-05-31days on market $95,000 Active 31 DOM
-
2026-04-30$95,000 Active 1161-char remark
-
2022-01-25soldstatus $60,000 Closed Sale 575-char remark
Show marketing remark (575 chars)
HIDDEN TREASURE!!! COMPLETELY REMODELED TRIPLEWIDE!!! This home has composition roof, central air, fenced yard, TWO sheds, workshop, LOVELY VIEW OF MOUNTAINS FROM PATIO, living room has wood burning fireplace, kitchen with modern appliances, breakfast bar, formal dining room, den, HUGE master bedroom with walk-in closet, LARGE master bath with tub and separate shower, textured walls, and washer/dryer. Home is COMPLETELY FURNISHED. This home is located in a senior 55+ community. Potential buyer shall be park approved prior to submitting offer to seller for acceptance.
-
2021-11-30status Pending Sale 575-char remark
Show marketing remark (575 chars)
HIDDEN TREASURE!!! COMPLETELY REMODELED TRIPLEWIDE!!! This home has composition roof, central air, fenced yard, TWO sheds, workshop, LOVELY VIEW OF MOUNTAINS FROM PATIO, living room has wood burning fireplace, kitchen with modern appliances, breakfast bar, formal dining room, den, HUGE master bedroom with walk-in closet, LARGE master bath with tub and separate shower, textured walls, and washer/dryer. Home is COMPLETELY FURNISHED. This home is located in a senior 55+ community. Potential buyer shall be park approved prior to submitting offer to seller for acceptance.
-
2021-10-18$63,900 Active 575-char remark
Show marketing remark (575 chars)
HIDDEN TREASURE!!! COMPLETELY REMODELED TRIPLEWIDE!!! This home has composition roof, central air, fenced yard, TWO sheds, workshop, LOVELY VIEW OF MOUNTAINS FROM PATIO, living room has wood burning fireplace, kitchen with modern appliances, breakfast bar, formal dining room, den, HUGE master bedroom with walk-in closet, LARGE master bath with tub and separate shower, textured walls, and washer/dryer. Home is COMPLETELY FURNISHED. This home is located in a senior 55+ community. Potential buyer shall be park approved prior to submitting offer to seller for acceptance.
ⓘ Source: listings_history table (triggers on properties + properties_extension) + one-shot
backfill from property_details.listing_events for pre-trigger history.
Tax reassessment forecast CA · Resets to sale price
- Current annual tax
- $237 · $20/mo
- Projected year-2 tax
- $722 · $60/mo
- Expected delta
- +$485/yr (+$40/mo · 205.1%)
ⓘ Screening estimate from a state-policy table — verify with the county assessor before closing.
Climate risk First Street
- Flood 1/10 Low FEMA zone X · 0% chance over 30 yrs
- Wildfire 8/10 Severe
- Heat 8/10 Severe 6 d/yr ≥103°F today · 17 d/yr by 30 yrs out
- Wind 1/10 Low
- Air quality 6/10 Major 11 unhealthy d/yr today · 13 by 30 yrs out
Nearby sold comps map
Loading sold comps map…
Walkable amenities ~0.75 mi
Loading nearby amenities…
Taxation est. · year 1
- Rental income
- $31,278
- − Mortgage interest
- −$5,321
- − Property taxes
- −$237
- − Insurance
- −$475
- − Repairs & maintenance
- −$2,502
- − Management
- −$2,502
- − Depreciation
- −$2,764
- Taxable income
- $17,477
- Est. tax owed @ 24.0%
- −$4,194
- After-tax cash flow
- $13,825/yr
For passive investors: Depreciation is non-cash, so a rental often shows a tax loss while cash-flowing — sheltering income. Rental losses are passive: they offset passive income freely, and up to $25,000/yr can offset ordinary (W-2) income if you actively participate and your MAGI is under $100k (phasing out to $0 by $150k); unused losses carry forward. On sale, claimed depreciation is recaptured at up to 25%, and gains may owe capital-gains tax (a 1031 exchange can defer both). Figures are a year-1 estimate at your 24.0% rate — not tax advice; consult a CPA.
Schools (NCES district)
- District
- San Jacinto Unified
- NCES district ID
- 0634440
- Math proficiency
- 13% ▼ -9.00%
- Reading proficiency
- 36% ▬ 0.00%
- Median HH income
- $43,560
- Composite
- 20.94/100
- National rank
- #8478
- State rank
- #421 of 517 in CA
Livability — San Jacinto
- Score
- 63/100
- State rank
- #467
- US rank
- #15889
Category grades
Schools grade is shown separately in the Schools card above.
Census & demographics
- Census place
- San Jacinto, CA
- County
- Riverside County · 2,287,001 people
- City population
- 33,778
- Metro
- Riverside-San Bernardino-Ontario, CA
- Population (ZIP)
- 33,778
- Household income
- $68,351
- Rent vs Own
- Severe rent burden
- 747.0
Population outlook (Riverside County) Hauer SSP2
- Today (2025)
- 2,664,475 people
- By 2030
- 2,802,692 · +5.2%
- By 2040
- 3,050,904 · +14.5%
- By 2050
- 3,256,783 · +22.2%
- By 2075
- 3,655,058 · +37.2%
- By 2100
- 3,766,594 · +41.4%
Race, ethnicity, and origin ACS 2023
- Neighborhood character
- Diverse neighborhood (Simpson 0.57)
- Race & ethnicity
- Hispanic / Latino 60% White 26% Two or more races 23% Black 5% Asian 3% Native American 3%
- Hispanic origin (detail)
- Mexican 52%
- Common ancestry
- Lithuanian 1% Iranian 1% Portuguese 1%
- Foreign-born
- 20% · Canada
- Languages at home
- 56% English-only · Spanish 40% Tagalog/Filipino 2% Other Asian/Pacific 1%
Political lean MEDSL · Riverside
- 2024 margin
- Toss-up / Even · D 48.0% · R 49.3% · Other 2.6%
- 2008→2024 swing
- -3.6pp toward R · 2008: 2.3pp · 2024: -1.3pp
- All cycles
- 2024: R+1.3 2020: D+8.0 2016: D+4.3 2012: R+0.4 2008: D+2.3
Not yet ingested
- Civics
- —
Market trends
- HPI YoY
- ▼ -71.15%
- Current HPI
- 407.8584
- Rent YoY
- ▲ 2.61%
- Metro
- Riverside-San Bernardino-Ontario, CA
- State GDP YoY
- ▲ 3.21%
- F500 in state
- 116
Industry mix (Fortune 500 HQ in CA)
| Industry | F500 HQs | Revenue |
|---|---|---|
| Technology | 27 | $1,492B |
|
||
| Financial Services | 3 | $174B |
|
||
| Retail | 3 | $44B |
|
||
| Insurance | 3 | $26B |
|
||
| Media / Entertainment | 2 | $115B |
|
||
| Pharmaceuticals / Biotech | 2 | $62B |
|
||
Price history
+48.7% since first listed4 events — show timeline
- 2026-04-30 Listed $95,000 CRMLS
- 2022-01-25 Sold (MLS) $60,000 CRMLS
- 2021-11-30 Pending — CRMLS
- 2021-10-18 Listed $63,900 CRMLS
Property tax history
-2.4%/yrLatest (2025): $237 · +7.2% YoY. Source: county tax records.
Cash-flow waterfall
monthlySold comps — $/sqft
last 12 mo · ≤1 miLoading sold comps…