4125 De George St · Houston, TX
Flood risk 4/10 · Minor
- FEMA flood zone
- X (unshaded)
- Chance of flooding over 30 yrs
- 0.22%
- Est. flood insurance / yr
- $507 – $1,088
Fire risk 1/10 · Minimal
- Est. fire insurance / yr
- $1,222 – $2,270
Heat risk 9/10 · Severe
- Hot days now (above 109°F)
- 7 days/yr
- Hot days in 30 yrs
- 22 days/yr
Wind risk 9/10 · Severe
- Chance of severe wind over 30 yrs
- 99.0%
Air-quality risk 3/10 · Minor
- Unhealthy air days now
- 2 days/yr
- Unhealthy air days in 30 yrs
- 3 days/yr
Risk factors via First Street. Map © Google.
Why this score? — see what drove the F grade
The composite is a weighted blend of 9 inputs, each scored 0–100. Each bar is that input's sub-score; the figure is the points it added to the 100-point composite (weight × sub-score).
- ARV discount +11.2/15.0
- Cash flow +6.2/30.0
- Livability +3.7/5.0
- Rent growth +2.7/5.0
- Schools +2.7/10.0
- Condition / age +2.5/5.0
- 1% rule +0.8/10.0
- DSCR +0.5/10.0
- Appreciation +0.0/10.0
$549,900
🖨 Deal sheet 📄 Offer letter ✓ Due diligence
Listing remarks MLS
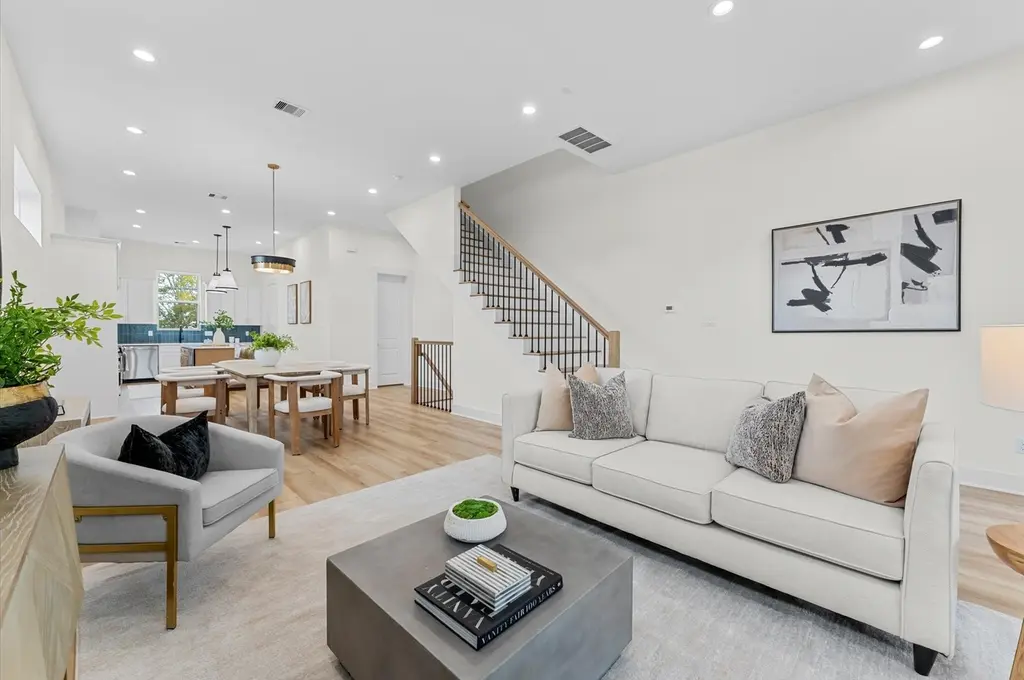
Welcome home to this beautiful new construction. This 3-bedroom, 3.5-bathroom plus a bonus room. This home offers a modern traditional living experience. From the attractive exterior to the open-concept layout with high ceilings and abundant natural light, every detail has been carefully crafted. The gourmet kitchen boasts with stainless steel appliances, custom cabinetry, and a stylish center island, while the primary bedroom suite provides a private retreat with a sophisticated en-suite bathroom with its own standing tub, double sinks, shower, and a large walk-in closet. With two additional spacious bedrooms, each with its own well-appointed bathroom, a convenient half bathroom on the entertainment level. This home with vinyl plank flooring throughout (no carpet) combines functionality and contemporary design seamlessly.
Key facts
- Custom cabinetry
- New construction
- Gourmet kitchen
Tags
Neighborhood map
What this means for you Summary
Snapshot
- This is a 3-bed/3.5-bath land listed at $550k.
Deal economics
- At list price, monthly cash flow is $-999 ($-12k/yr) — negative.
- To cash-flow at today's rent, offer at most $373k (32.1% below list).
- To meet the 1% rule (rent ≥ 1% of price), the offer needs to be $319k (42.0% below list).
- Recommended offer: $319k (42.0% below list) — sets the bar for 1% rule.
- Cap rate 4.1% vs local median 3.2% in Houston — top-decile yield for the area; either an underpriced asset or a hidden risk that comps aren't pricing in. Stress-test before assuming the spread holds.
Location & tenants
- Location reads 74/100 on livability (#184 in TX, #4,771 nationally) — a middle-class / working-renter tenant base. Strengths: amenities A+, cost of living A+, housing A+; Watch: schools D, crime F.
- Houston ISD (urban): math 27% / reading 35% proficiency, ranked #593 of 826 in TX (top 72%) — families likely to look elsewhere, expect single-tenant / working-renter base with shorter leases; 71% free/reduced lunch — lower-income household profile, screen leases tightly.
- Market conditions: Rents flat; 595 active listings in the ZIP; 20 comparable units currently listed for rent nearby; rentals lingering (median 44d on market — plan ~5-8 weeks vacancy on turnover, expect pricing pressure); 70% of comp listings sitting > 30 days — soft ceiling on asking rent; solid renter incomes; 29,883 units permitted in Harris County in 2024 (8,621 in 5+ unit buildings).
- At $3,188/mo this rent would consume 46% of the median local household income ($83k/yr) (locally 994% of renters already pay >50% of income on rent) — very limited rent-growth headroom before tenants either downsize or default.
Forward outlook
- Local home prices are declining (-3.0%/yr); year-one equity from $4k of loan paydown is wiped out by about $16k of value loss. Plan a longer hold.
- Harris County population projected at +47% by 2050 — long-run rental-demand tailwind backs the buy-and-hold thesis.
Negotiation context
- It's been on market 157 days — a 12% lower offer ($484k) is reasonable based on typical stale-listing flexibility.
Risks & watch-outs
- Climate carrying-cost: severe wind risk, 99% chance of damaging wind over 30y; extreme-heat days projected 7→22/yr by 2055 (HVAC capex compounding) — expect insurance premiums to compound above CPI over the hold.
Questions for the listing agent
- What do current leases actually rent for vs. the listed asking? Can we see a recent rent roll and the last 12 months of T-12 income?
- It's been on market 157 days. Have you received any prior offers? Is the seller open to a 42% concession, seller financing, or rate buy-down credit?
- What does the HOA fee cover, when was the last increase, and are there any pending special assessments or reserve-fund shortfalls?
- Why hasn't it sold? Are there any deal-killer items the seller is aware of (foundation, flood, title, zoning, code violations)?
- Is there a deadline driving the sale (1031 exchange, divorce, estate, relocation)? That informs how much negotiation room exists.
- Schools are D-rated, which usually means shorter tenancies and higher turnover. Who's the typical renter profile here, and what's been the actual vacancy rate?
- Crime grade is F in this area — have there been break-ins, vandalism, or insurance claims at this property in the last 3 years? What carrier currently insures it and at what premium?
- The area grade is low — what's the realistic commute time and amenity access for the typical tenant pool here? Any planned neighborhood developments (good or bad) we should know about?
- What's the average days-on-market for RENTAL listings here right now (not sales)? A rising rental-DOM trend means longer vacancies and softer asking-rent achievability than the comps imply.
- What's the recent tenant-quality profile in this submarket — average credit score on applications, eviction rate, late-payment / NSF rate, and stable-employment percentage? A property-management company in the area should have these aggregated.
- How much new for-sale + rental construction is in the pipeline within 1–3 miles? Heavy new supply typically softens prices + rents 12–24 months out; constrained supply supports both.
Investment metrics
- 1% rule
- 0.58% ✗
- Cap rate
- 4.11%
- Cash-on-cash
- -7.78%
- DSCR
- 0.65
- GRM
- 14.4
CMA / ARV
- ARV (median comp)
- $598,589
- List price
- $549,900
- Delta
- -8.13%
- Verdict
- FAIR
- Comps
- 20 within 1.0 mi
Projected returns pro-forma
-3.0% appreciation · 0.84% rent growth · sell at horizon
- IRR
- -32.1%
- Equity multiple
- -0.04×
- Total profit
- $-159,624
- Equity at exit
- $81,992
- IRR
- -50.1%
- Equity multiple
- -0.61×
- Total profit
- $-248,067
- Equity at exit
- $47,545
Cash invested: $153,972 (down + closing). Projections, not guarantees.
Landlord ↔ Tenant lean methodology
- Overall (STATE)
- 87 Strongly Landlord-Friendly
- State Texas
- 87 Strongly Landlord-Friendly · R+5
- County
- — inherits STATE
- City
- — inherits STATE
ZIP-level market 77009
- Rents YoY
- 0.8%
- Active inventory
- 595
- Price-to-rent
- 14.4×
Monthly cashflow live
- Estimated rent
- $3,188 high interval (Pro) →
- Mortgage (P&I)
- −$2,884
- Tax from tax record
- −$292 /mo · $3,510/yr
- Insurance
- −$229
- HOA
- −$112
- Vacancy / Maint / Mgmt
- −$670
- Net cashflow
- $-999
Break-even live
UW: 25.0% down · 7.5% · 30yr · 1.5% tax · 5.0% vac · 8.0% maint · 8.0% mgmt
Financing live
Cash to close
- Down payment
- $137,475
- Closing costs
- $16,497
- Reserves months
- —
- Total cash needed
- —
Loan-product check · same deal, 3 products live
Conventional
25% down · 7.5% · 30yr
- Down + closing
- —
- Monthly P&I
- —
- Monthly cashflow
- —
- DSCR
- —
- Eligible?
- —
Personal DTI + credit; lowest rate.
DSCR
20% down · 8.5% · 30yr
- Down + closing
- —
- Monthly P&I
- —
- Monthly cashflow
- —
- DSCR
- —
- Eligible?
- —
No personal income docs; deal must DSCR.
Hard money
10% down · 12.0% · 12mo
- Down + closing
- —
- Monthly P&I
- —
- Monthly cashflow
- —
- DSCR
- —
- Eligible?
- —
Short-term bridge; refi at stabilization.
Rent comps 20 comps
| Address | Beds | Baths | Sqft | Rent | $/sqft | DOM | Units | Dist |
|---|---|---|---|---|---|---|---|---|
| 401 Walton St Houston, TX | 3.0 | 2.0 | 2112 | $2,500 | $1.18 | 15d | 1 | 0.22mi |
| 4605 Fisk St Houston, TX | 3.0 | 2.0 | 1628 | $3,000 | $1.84 | 43d | 1 | 0.72mi |
| 1116 Woodland St Houston, TX | 3.0 | 2.0 | 2400 | $4,000 | $1.67 | 43d | 1 | 0.76mi |
| 1614 Northwood St Houston, TX | 3.0 | 3.5 | 2300 | $2,850 | $1.24 | 44d | 1 | 0.77mi |
| 4615 Indie Heights Ln Houston, TX | 2.0 | 2.0 | 1685 | $2,900 | $1.72 | 43d | 1 | 0.79mi |
| 604 E 17th St Houston, TX | 3.0 | 2.0 | 1724 | $3,500 | $2.03 | 43d | 1 | 0.82mi |
| 770 Strawberry Pines Ct Houston, TX | 2.0–3.0 | 2.5 | 1422 | $2,735 | $1.92 | 1d | 12 | 0.83mi |
| 1141 Louise St Houston, TX | 4.0 | 4.0 | 2228 | $4,000 | $1.80 | 43d | 1 | 0.84mi |
| 705 Link Rd Houston, TX | 3.0 | 3.5 | 1850 | $2,600 | $1.41 | 7d | 1 | 0.90mi |
| 1203 E 28th St Houston, TX | 3.0 | 3.5 | 2696 | $3,500 | $1.30 | 43d | 1 | 1.24mi |
| 1204 E 29th St Unit 1018984P Houston, TX | 3.0 | 2.5 | 2142 | $10,290 | $4.80 | 43d | 1 | 1.26mi |
| 1204 E 29th St Houston, TX | 3.0 | 2.5 | 2151 | $8,750 | $4.07 | 43d | 1 | 1.26mi |
| 2114 Sabine St Unit 1257735P Houston, TX | 3.0 | 3.5 | 2594 | $6,588 | $2.54 | 43d | 1 | 1.32mi |
| 2114 Sabine St Houston, TX | 3.0 | 4.0 | 2020 | $3,200 | $1.58 | 43d | 1 | 1.32mi |
| 2403 Everett St Unit A Houston, TX | 3.0 | 3.5 | 2093 | $2,800 | $1.34 | 43d | 1 | 1.32mi |
| 1039 Hillstar St Houston, TX | 3.0 | 2.5 | 1780 | $2,750 | $1.54 | 12d | 1 | 1.34mi |
| 1420 E 31st St Houston, TX | 3.0 | 2.5 | 1790 | $2,600 | $1.45 | 24d | 1 | 1.38mi |
| 1420 E 31st St Houston, TX | 3.0 | 2.5 | 1980 | $2,600 | $1.31 | 43d | 1 | 1.38mi |
| 2018 Crockett St Unit 1029793P Houston, TX | 3.0 | 3.5 | 2507 | $6,482 | $2.59 | 5d | 1 | 1.45mi |
| 2018 Crockett St Unit 2018 Houston, TX | 3.0 | 3.5 | 2514 | $8,000 | $3.18 | 43d | 1 | 1.45mi |
HOA detail
- Monthly dues
- $112 · $1,344/yr
Listing history 12 events
-
2026-06-18days on market $549,900 Active 157 DOM
-
2026-06-17days on market $549,900 Active 156 DOM
-
2026-06-16days on market $549,900 Active 155 DOM
-
2026-06-15days on market $549,900 Active 154 DOM
-
2026-06-13days on market $549,900 Active 152 DOM
-
2026-06-10days on market $549,900 Active 148 DOM
-
2026-06-08pricedays on market $549,900 Active 147 DOM
-
2026-06-07days on market $559,900 Active 146 DOM
-
2026-06-04days on market $559,900 Active 143 DOM
-
2026-06-01days on market $559,900 Active 140 DOM
-
2026-05-31days on market $559,900 Active 139 DOM
-
2026-01-12$559,900 Active 835-char remark
Show marketing remark (835 chars)
Welcome home to this beautiful new construction. This 3-bedroom, 3.5-bathroom plus a bonus room. This home offers a modern traditional living experience. From the attractive exterior to the open-concept layout with high ceilings and abundant natural light, every detail has been carefully crafted. The gourmet kitchen boasts with stainless steel appliances, custom cabinetry, and a stylish center island, while the primary bedroom suite provides a private retreat with a sophisticated en-suite bathroom with its own standing tub, double sinks, shower, and a large walk-in closet. With two additional spacious bedrooms, each with its own well-appointed bathroom, a convenient half bathroom on the entertainment level. This home with vinyl plank flooring throughout (no carpet) combines functionality and contemporary design seamlessly.
ⓘ Source: listings_history table (triggers on properties + properties_extension) + one-shot
backfill from property_details.listing_events for pre-trigger history.
Tax reassessment forecast TX · Resets to sale price
- Current annual tax
- $3,510 · $292/mo
- Projected year-2 tax
- $10,063 · $839/mo
- Expected delta
- +$6,553/yr (+$546/mo · 186.7%)
ⓘ Screening estimate from a state-policy table — verify with the county assessor before closing.
Climate risk First Street
- Flood 4/10 Moderate FEMA zone X (unshaded) · 22% chance over 30 yrs
- Wildfire 1/10 Low
- Heat 9/10 Extreme 7 d/yr ≥109°F today · 22 d/yr by 30 yrs out
- Wind 9/10 Extreme 99% chance of damaging wind over 30 yrs
- Air quality 3/10 Moderate 2 unhealthy d/yr today · 3 by 30 yrs out
Nearby sold comps map
Loading sold comps map…
Walkable amenities ~0.75 mi
Loading nearby amenities…
Taxation est. · year 1
- Rental income
- $38,258
- − Mortgage interest
- −$30,803
- − Property taxes
- −$3,510
- − Insurance
- −$2,750
- − Repairs & maintenance
- −$3,061
- − Management
- −$3,061
- − HOA
- −$1,344
- − Depreciation
- −$15,997
- Taxable loss
- −$22,267
- Est. tax savings @ 24.0%
- +$5,344
- After-tax cash flow
- $-6,640/yr
For passive investors: Depreciation is non-cash, so a rental often shows a tax loss while cash-flowing — sheltering income. Rental losses are passive: they offset passive income freely, and up to $25,000/yr can offset ordinary (W-2) income if you actively participate and your MAGI is under $100k (phasing out to $0 by $150k); unused losses carry forward. On sale, claimed depreciation is recaptured at up to 25%, and gains may owe capital-gains tax (a 1031 exchange can defer both). Figures are a year-1 estimate at your 24.0% rate — not tax advice; consult a CPA.
Schools (NCES district)
- District
- Houston ISD
- NCES district ID
- 4823640
- Math proficiency
- 27% ▼ -18.00%
- Reading proficiency
- 35% ▼ -6.00%
- Median HH income
- $46,054
- Composite
- 26.63/100
- National rank
- #7173
- State rank
- #593 of 826 in TX
Livability — Houston
- Score
- 74/100
- State rank
- #184
- US rank
- #4771
Category grades
Schools grade is shown separately in the Schools card above.
Census & demographics
- Census place
- Houston, TX
- County
- Harris County · 4,702,590 people
- City population
- 3,226,434
- Metro
- Houston-The Woodlands-Sugar Land, TX
- Population (ZIP)
- 35,769
- Household income
- $83,148
- Rent vs Own
- Severe rent burden
- 994.0
Population outlook (Harris County) Hauer SSP2
- Today (2025)
- 5,571,493 people
- By 2030
- 6,089,821 · +9.3%
- By 2040
- 7,142,806 · +28.2%
- By 2050
- 8,185,864 · +46.9%
- By 2075
- 10,574,329 · +89.8%
- By 2100
- 12,109,958 · +117.4%
Race, ethnicity, and origin ACS 2023
- Neighborhood character
- Diverse neighborhood (Simpson 0.60)
- Race & ethnicity
- Hispanic / Latino 53% White 33% Two or more races 22% Black 8% Asian 3%
- Hispanic origin (detail)
- Mexican 46%
- Common ancestry
- Italian 2% Lithuanian 2% Slovak 1%
- Foreign-born
- 20% · Canada
- Languages at home
- 55% English-only · Spanish 40% Other Indo-European 2% Other Asian/Pacific 1%
Political lean MEDSL · Harris
- 2024 margin
- Lean D (+5.5) · D 52.0% · R 46.4% · Other 1.6%
- 2008→2024 swing
- +3.9pp toward D · 2008: 1.6pp · 2024: 5.5pp
- All cycles
- 2024: D+5.5 2020: D+13.3 2016: D+12.4 2012: D+0.1 2008: D+1.6
Not yet ingested
- Civics
- —
Market trends
- HPI YoY
- ▼ -533.57%
- Current HPI
- 219.5037
- Rent YoY
- ▲ 0.84%
- Metro
- Houston-The Woodlands-Sugar Land, TX
- State GDP YoY
- ▲ 3.95%
- F500 in state
- 110
Industry mix (Fortune 500 HQ in TX)
| Industry | F500 HQs | Revenue |
|---|---|---|
| Energy | 16 | $1,198B |
|
||
| Technology | 5 | $198B |
|
||
| Engineering / Construction | 4 | $72B |
|
||
| Energy Services | 3 | $60B |
|
||
| Utilities | 3 | $41B |
|
||
| Healthcare | 2 | $330B |
|
||
Price history
1 event — show timeline
- 2026-01-12 Listed $559,900 HARMLS
Property tax history
-6.1%/yrLatest (2025): $3,510 · +21.9% YoY. Source: county tax records.
Cash-flow waterfall
monthlySold comps — $/sqft
last 12 mo · ≤1 miLoading sold comps…