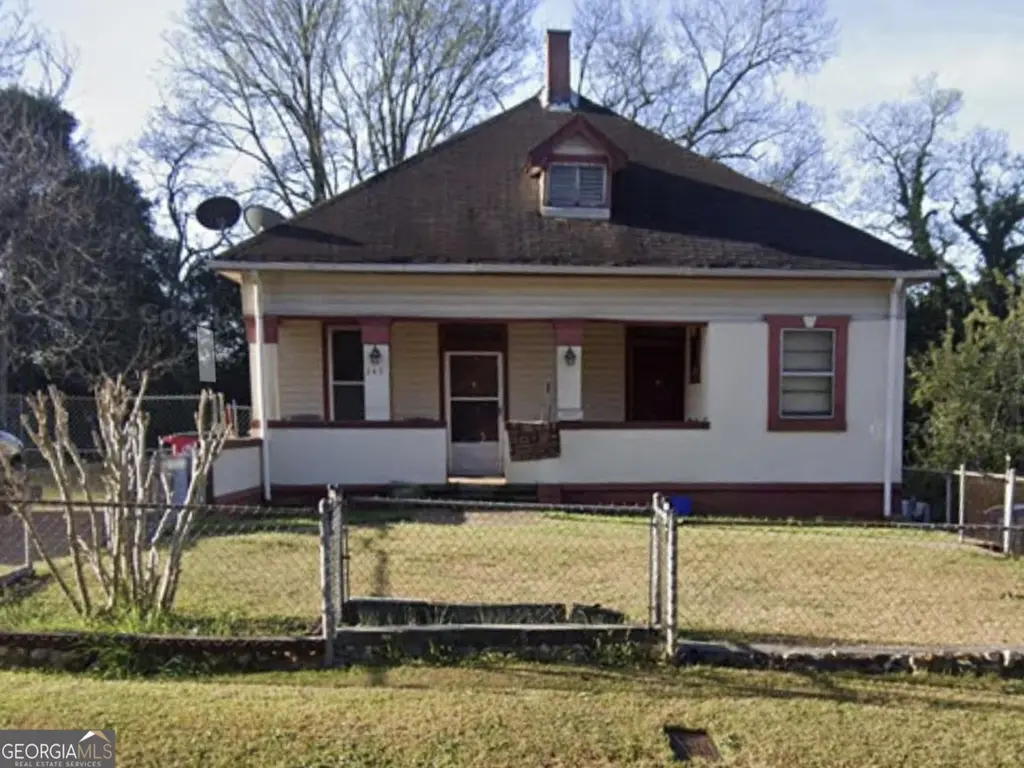
347 Woolfolk St · Macon-Bibb County, GA
Flood risk 1/10 · Minimal
- FEMA flood zone
- X (unshaded)
- Chance of flooding over 30 yrs
- 0.0%
- Est. flood insurance / yr
- $507 – $1,088
Fire risk 2/10 · Minimal
- Est. fire insurance / yr
- $963 – $1,789
Heat risk 7/10 · Major
- Hot days now (above 108°F)
- 7 days/yr
- Hot days in 30 yrs
- 17 days/yr
Wind risk 6/10 · Moderate
- Chance of severe wind over 30 yrs
- 65.0%
Air-quality risk 4/10 · Minor
- Unhealthy air days now
- 5 days/yr
- Unhealthy air days in 30 yrs
- 5 days/yr
Risk factors via First Street. Map © Google.
Why this score? — see what drove the B- grade
The composite is a weighted blend of 9 inputs, each scored 0–100. Each bar is that input's sub-score; the figure is the points it added to the 100-point composite (weight × sub-score).
- Cash flow +30.0/30.0
- 1% rule +10.0/10.0
- DSCR +10.0/10.0
- Appreciation +7.2/10.0
- Rent growth +5.0/5.0
- Livability +2.5/5.0
- Condition / age +2.5/5.0
- Schools +1.2/10.0
- ARV discount +0.0/15.0
$69,000
🖨 Deal sheet 📄 Offer letter ✓ Due diligence
Listing remarks
Investor special! R2-zoned opportunity with strong value-add potential. Property is ready for renovation. Zoned R2 (buyer to verify permitted uses), offering excellent potential for duplex or multi-family use. Sold AS-IS with seller having limited knowledge of property condition. Seller has never occupied the property. Buyer to conduct all due diligence and verify all information, including but not limited to square footage, utilities, zoning, and property condition. No blind offers. Proof of funds required with all offers.
Key facts
- Multi-family use
- R2-zoned opportunity
- Ready for renovation
Tags
Property features AI
Finance
- Other: Lot approximately 0.16 acres; Lot features: None
- HOA & community: No HOA
Exterior
- Parking: Off-street parking; Parking pad; Open parking
- Utilities: Public water; Public sewer; Electricity available; Cable available
- Home design: Single-family house; Residential property; Built in 1884; Condition: Fixer
- Construction: Construction materials listed as Other
- Exterior features: Block foundation; Roof listed as Other
Interior
- Kitchen: No appliances listed
- Bedrooms: 3 bedrooms (all on the main level)
- Flooring: Other flooring
- Bathrooms: 2 full bathrooms
- Heating & cooling: Heating present (type listed as Other); Cooling present (type listed as Other); No fireplaces
- Interior features: One-level living; Den; Family room; Foyer
- Laundry & utility: Laundry room
Neighborhood map
What this means for you Summary
Snapshot
- This is a 3-bed/2.0-bath single-family listed at $69k.
Deal economics
- At list price, monthly cash flow is $541 ($6k/yr) — positive.
- The deal already cash-flows at list — no discount required.
- Meets the 1% rule at list price ($1k rent vs $69k).
- Recommended offer: $67k (3.0% below list) — sets the bar for market timing.
- Cap rate 15.7% vs local median 5.4% in Macon-Bibb County — top-decile yield for the area; either an underpriced asset or a hidden risk that comps aren't pricing in. Stress-test before assuming the spread holds.
Location & tenants
- Location reads: area grade B — affects rentability + tenant quality, not the cash-flow math above.
- Bibb County (urban): math 11% / reading 18% proficiency, ranked #161 of 174 in GA (top 92%) — low school quality limits family demand, transient renter base, plan for 1-2y turnover; 75% free/reduced lunch — lower-income household profile, screen leases tightly.
- Zoned schools: Appling Middle School (math 7% / reading 14%, grade F, #429 of 470 statewide, top 91%, 648 students, 100% FRL); Northeast High School (math 2% / reading 5%, grade F, #413 of 424 statewide, top 99%, 742 students, 100% FRL) — zoned schools average 100% FRL vs 75% district-wide (25 pts higher); higher-poverty schools than district average — tighter screening recommended.
- Market conditions: Rents rising fast (+10.8%/yr); 122 active listings in the ZIP; 35 comparable units currently listed for rent nearby; rentals at typical pace (median 21d on market — plan ~3-4 weeks tenant-placement turnaround); 40% of comp listings sitting > 30 days — soft ceiling on asking rent; lower-income renter base — watch delinquency; 154 units permitted in Bibb County in 2024 (0 in 5+ unit buildings).
- This rent runs 33% of the median local income ($45k/yr) — at the standard rent-burdened threshold; future hikes will face affordability resistance.
Forward outlook
- In year one you build about $3k of equity ($477 loan paydown + $3k appreciation (4.3% local appreciation)).
- Bibb County population projected at -12% by 2050 — secular population decline; favor cash flow + early exit over multi-decade hold.
- At projected returns (4.3% appreciation + 8.0% rent growth), your $19k cash investment doubles in ~2 years — after that, you're playing with house money.
- By year 10, paydown + projected appreciation supports a ~$34k cash-out refi (75% LTV) — recoverable capital for the next deal without selling this one.
Negotiation context
- It's been on market 56 days — a 3% lower offer ($67k) is reasonable based on typical stale-listing flexibility.
Risks & watch-outs
- Watch-outs: built in 1884 — expect roof / HVAC / electrical / plumbing capex.
- Climate carrying-cost: major wind risk, 65% chance of damaging wind over 30y; extreme-heat days projected 7→17/yr by 2055 (HVAC capex compounding) — expect insurance premiums to compound above CPI over the hold.
Questions for the listing agent
- It's been on market 56 days. Have you received any prior offers? Is the seller open to a 3% concession, seller financing, or rate buy-down credit?
- Built in 1884 — when were the roof, HVAC, electrical panel, plumbing, and water heater last replaced?
- Is there a deadline driving the sale (1031 exchange, divorce, estate, relocation)? That informs how much negotiation room exists.
- What's the average days-on-market for RENTAL listings here right now (not sales)? A rising rental-DOM trend means longer vacancies and softer asking-rent achievability than the comps imply.
- What's the recent tenant-quality profile in this submarket — average credit score on applications, eviction rate, late-payment / NSF rate, and stable-employment percentage? A property-management company in the area should have these aggregated.
- How much new for-sale + rental construction is in the pipeline within 1–3 miles? Heavy new supply typically softens prices + rents 12–24 months out; constrained supply supports both.
Investment metrics
- 1% rule
- 1.81% ✓
- Cap rate
- 15.70%
- Cash-on-cash
- 33.61%
- DSCR
- 2.50
- GRM
- 4.6
CMA / ARV
- ARV (median comp)
- $54,219
- List price
- $69,000
- Delta
- 27.26%
- Verdict
- OVERPRICED
- Comps
- 20 within 1.0 mi
Show comp detail 12 sales within ~0.75 mi
| Address | Dist | Beds/Ba | Sqft | Sold | Price | $/sf | Match |
|---|---|---|---|---|---|---|---|
| 328 Woolfolk St | 0.05mi | 3/1.0 | 1,340 (-0%) | 13mo | $20,000 | $15 | 83 |
| 783 Boulevard | 0.38mi | 2/1.0 (-1) | 1,337 (-0%) | 9mo | $180,000 | $135 | 65 |
| 575 Cowan St | 0.29mi | 3/2.0 | 1,208 (-10%) | 10mo | $68,900 | $57 | 61 |
| 970 Emery Hwy | 0.67mi | 3/2.0 | 1,320 (-2%) | 12mo | $18,900 | $14 | 56 |
| 1010 Maynard St | 0.58mi | 3/2.0 | 1,254 (-7%) | 12mo | $140,000 | $112 | 52 |
| 833 Parkview Ct | 0.65mi | 3/2.5 | 1,522 (+13%) | 2mo | $200,000 | $131 | 44 |
| 1049 Boulevard | 0.61mi | 2/2.0 (-1) | 1,170 (-13%) | 1mo | $135,000 | $115 | 44 |
| 823 Applewood St | 0.72mi | 3/1.0 | 1,219 (-9%) | 5mo | $52,500 | $43 | 42 |
| 853 Parkview Dr | 0.71mi | 3/2.0 | 1,192 (-11%) | 8mo | $179,900 | $151 | 41 |
| 260 Balkcom Ave | 0.65mi | 3/2.0 | 1,180 (-12%) | 10mo | $97,000 | $82 | 41 |
| 795 Peachtree St | 0.65mi | 3/1.0 | 1,477 (+10%) | 12mo | $33,000 | $22 | 39 |
| 939 Boulevard | 0.70mi | 2/1.0 (-1) | 1,216 (-10%) | 5mo | $135,000 | $111 | 38 |
Match score weights: distance 35% · size 25% · config 20% · recency 20%. Top-matched comps best support the ARV.
Projected returns pro-forma
4.31% appreciation · 8.0% rent growth · sell at horizon
- IRR
- 45.3%
- Equity multiple
- 3.81×
- Total profit
- $54,287
- Equity at exit
- $36,250
- IRR
- 46.1%
- Equity multiple
- 8.84×
- Total profit
- $151,537
- Equity at exit
- $60,323
Cash invested: $19,320 (down + closing). Projections, not guarantees.
Landlord ↔ Tenant lean methodology
- Overall (STATE)
- 90 Strongly Landlord-Friendly
- State Georgia
- 90 Strongly Landlord-Friendly · R+3
- County
- — inherits STATE
- City
- — inherits STATE
ZIP-level market 31217
- Home prices YoY
- 2.1%
- Rents YoY
- 10.8%
- Active inventory
- 122
- Price-to-rent
- 4.6×
Monthly cashflow live
- Estimated rent
- $1,249 high interval (Pro) →
- Mortgage (P&I)
- −$362
- Tax from tax record
- −$55 /mo · $661/yr
- Insurance
- −$29
- HOA
- −$0
- Vacancy / Maint / Mgmt
- −$262
- Net cashflow
- $541
Break-even live
UW: 25.0% down · 7.5% · 30yr · 1.5% tax · 5.0% vac · 8.0% maint · 8.0% mgmt
Financing live
Cash to close
- Down payment
- $17,250
- Closing costs
- $2,070
- Reserves months
- —
- Total cash needed
- —
Loan-product check · same deal, 3 products live
Conventional
25% down · 7.5% · 30yr
- Down + closing
- —
- Monthly P&I
- —
- Monthly cashflow
- —
- DSCR
- —
- Eligible?
- —
Personal DTI + credit; lowest rate.
DSCR
20% down · 8.5% · 30yr
- Down + closing
- —
- Monthly P&I
- —
- Monthly cashflow
- —
- DSCR
- —
- Eligible?
- —
No personal income docs; deal must DSCR.
Hard money
10% down · 12.0% · 12mo
- Down + closing
- —
- Monthly P&I
- —
- Monthly cashflow
- —
- DSCR
- —
- Eligible?
- —
Short-term bridge; refi at stabilization.
Rent comps 35 comps
| Address | Beds | Baths | Sqft | Rent | $/sqft | DOM | Units | Dist |
|---|---|---|---|---|---|---|---|---|
| 378 Cowan St Unit 382 Macon, GA | 2.0 | 1.5 | 1166 | $900 | $0.77 | 21d | 1 | 0.18mi |
| 382 Cowan St Macon, GA | 2.0 | 1.5 | 1166 | $900 | $0.77 | 44d | 1 | 0.18mi |
| 390 Cowan St Unit 394 Macon, GA | 2.0 | 1.5 | 1166 | $900 | $0.77 | 21d | 1 | 0.19mi |
| 490 Hall St Macon, GA | 4.0 | 2.0 | 1596 | $1,850 | $1.16 | 44d | 1 | 0.34mi |
| 853 North Ave Macon, GA | 2.0 | 1.5 | 950 | $865 | $0.91 | 44d | 1 | 0.37mi |
| 1105 Boulevard Macon, GA | 3.0 | 1.0 | 1592 | $1,350 | $0.85 | 21d | 1 | 0.61mi |
| 1161 Boulevard Macon, GA | 2.0 | 1.5 | 1050 | $1,300 | $1.24 | 13d | 1 | 0.61mi |
| 1126 Boulevard Macon, GA | 4.0 | 1.5 | 1228 | $1,260 | $1.03 | 21d | 1 | 0.64mi |
| 850 Parkview Ct Macon, GA | 3.0 | 2.5 | 1520 | $1,700 | $1.12 | 21d | 1 | 0.64mi |
| 850 Parkview Ct Macon, GA | 3.0 | 2.5 | 1520 | $1,700 | $1.12 | 44d | 1 | 0.64mi |
| 892 Applewood St Macon, GA | 4.0 | 2.0 | 1250 | $850 | $0.68 | 44d | 1 | 0.73mi |
| 1143 Woolfolk St Unit 3 Macon, GA | 2.0 | 1.0 | 900 | $800 | $0.89 | 44d | 1 | 0.87mi |
| 147 Orange St Macon, GA | 3.0 | 2.0 | 1500 | $1,695 | $1.13 | 13d | 1 | 0.92mi |
| 218 Orange St Macon, GA | 2.0 | 1.0 | 1100 | $1,300 | $1.18 | 21d | 1 | 0.95mi |
| 952 Georgia Ave Macon, GA | 2.0 | 2.0 | 1115 | $1,295 | $1.16 | 44d | 1 | 0.99mi |
| 384 Spring St Unit 1 Macon, GA | 3.0 | 2.0 | 1200 | $1,250 | $1.04 | 44d | 1 | 1.00mi |
| 952 Georgia Ave Unit 3 Macon, GA | 2.0 | 1.0 | 900 | $950 | $1.06 | 13d | 1 | 1.01mi |
| 1224 Appling Ct Apt B Macon, GA | 2.0 | 1.0 | 1000 | $925 | $0.93 | 21d | 1 | 1.03mi |
| 462 Cherry St Macon, GA | 2.0 | 1.0–2.0 | 988 | $3,000 | $3.03 | 13d | 25 | 1.04mi |
| 854 Trinity Pl Macon, GA | 2.0 | 1.0 | 1260 | $875 | $0.69 | 44d | 1 | 1.06mi |
| 370 Cherry St Macon, GA | 2.0 | 2.0 | 1500 | $1,400 | $0.93 | 44d | 1 | 1.07mi |
| 484 1st St #300 Macon, GA | 2.0 | 1.0 | 1400 | $1,625 | $1.16 | 13d | 1 | 1.08mi |
| 476 3rd St Macon, GA | 2.0 | 1.0 | 942 | $1,850 | $1.96 | 13d | 8 | 1.11mi |
| 482 Poplar St Macon, GA | 1.0–2.0 | 1.0–2.0 | 850 | $1,425 | $1.68 | 21d | 4 | 1.15mi |
| 470 Poplar St Unit 202 Macon, GA | 2.0 | 2.0 | 1000 | $1,425 | $1.43 | 44d | 1 | 1.15mi |
| 347 College St Macon, GA | 2.0 | 1.0–2.0 | 725 | $2,600 | $3.59 | 13d | 4 | 1.15mi |
| 720 Baker St Macon, GA | 2.0 | 1.0 | 1020 | $900 | $0.88 | 44d | 1 | 1.19mi |
| 1417 Woodliff St Macon, GA | 3.0 | 1.0 | 908 | $1,100 | $1.21 | 21d | 1 | 1.19mi |
| 813 Forsyth St Unit C Macon, GA | 2.0 | 2.0 | 1105 | $1,400 | $1.27 | 13d | 1 | 1.26mi |
| 391 Madison St Macon, GA | 3.0 | 2.0 | 1236 | $1,350 | $1.09 | 13d | 1 | 1.27mi |
| 1636 Huntley Ridge Dr Macon, GA | 2.0 | 1.5 | 1100 | $950 | $0.86 | 13d | 1 | 1.39mi |
| 1634 Huntley Ridge Dr Macon, GA | 2.0 | 2.0 | 1100 | $950 | $0.86 | 13d | 1 | 1.39mi |
| 1930 Northbrook Ave Macon, GA | 3.0 | 1.0 | 1071 | $1,400 | $1.31 | 44d | 1 | 1.43mi |
| 1930 Northbrook Ave Macon, GA | 3.0 | 1.0 | 1071 | $1,400 | $1.31 | 13d | 1 | 1.43mi |
| 1143 Sunnydale Dr Macon, GA | 3.0 | 1.0 | 1053 | $975 | $0.93 | 44d | 1 | 1.47mi |
Listing history 17 events
-
2026-06-19days on market $69,000 Active 56 DOM
-
2026-06-18days on market $69,000 Active 55 DOM
-
2026-06-17days on market $69,000 Active 54 DOM
-
2026-06-16days on market $69,000 Active 53 DOM
-
2026-06-15days on market $69,000 Active 52 DOM
-
2026-06-14days on market $69,000 Active 50 DOM
-
2026-06-13days on market $69,000 Active 49 DOM
-
2026-06-10days on market $69,000 Active 47 DOM
-
2026-06-09days on market $69,000 Active 46 DOM
-
2026-06-09days on market $69,000 Active 45 DOM
-
2026-06-07days on market $69,000 Active 44 DOM
-
2026-06-03days on market $69,000 Active 40 DOM
-
2026-06-02days on market $69,000 Active 39 DOM
-
2026-06-01days on market $69,000 Active 38 DOM
-
2026-05-31days on market $69,000 Active 37 DOM
-
2026-05-30days on market $69,000 Active 36 DOM
-
2026-04-22$69,000 New 529-char remark
ⓘ Source: listings_history table (triggers on properties + properties_extension) + one-shot
backfill from property_details.listing_events for pre-trigger history.
Tax reassessment forecast GA · Resets to sale price
- Current annual tax
- $661 · $55/mo
- Projected year-2 tax
- $661 · $55/mo
- Expected delta
- $0/yr ($0/mo · 0.0%)
ⓘ Screening estimate from a state-policy table — verify with the county assessor before closing.
Climate risk First Street
- Flood 1/10 Low FEMA zone X (unshaded) · 0% chance over 30 yrs
- Wildfire 2/10 Low
- Heat 7/10 Severe 7 d/yr ≥108°F today · 17 d/yr by 30 yrs out
- Wind 6/10 Major 65% chance of damaging wind over 30 yrs
- Air quality 4/10 Moderate 5 unhealthy d/yr today · 5 by 30 yrs out
Nearby sold comps map
Loading sold comps map…
Walkable amenities ~0.75 mi
Loading nearby amenities…
Taxation est. · year 1
- Rental income
- $14,989
- − Mortgage interest
- −$3,865
- − Property taxes
- −$661
- − Insurance
- −$345
- − Repairs & maintenance
- −$1,199
- − Management
- −$1,199
- − Depreciation
- −$2,007
- Taxable income
- $5,712
- Est. tax owed @ 24.0%
- −$1,371
- After-tax cash flow
- $5,122/yr
For passive investors: Depreciation is non-cash, so a rental often shows a tax loss while cash-flowing — sheltering income. Rental losses are passive: they offset passive income freely, and up to $25,000/yr can offset ordinary (W-2) income if you actively participate and your MAGI is under $100k (phasing out to $0 by $150k); unused losses carry forward. On sale, claimed depreciation is recaptured at up to 25%, and gains may owe capital-gains tax (a 1031 exchange can defer both). Figures are a year-1 estimate at your 24.0% rate — not tax advice; consult a CPA.
Schools (NCES district)
- District
- Bibb County
- NCES district ID
- 1300420
- Math proficiency
- 11% ▼ -14.00%
- Reading proficiency
- 18% ▼ -11.00%
- Median HH income
- $37,426
- Composite
- 12.13/100
- National rank
- #9654
- State rank
- #161 of 174 in GA
Livability — Macon-Bibb County
No livability data for this city. (Only ~50 U.S. cities are tracked.)
Census & demographics
- Census place
- Macon-Bibb County, GA
- County
- Bibb County · 164,332 people
- City population
- 143,186
- Metro
- Macon-Bibb County, GA
- Population (ZIP)
- 17,732
- Household income
- $44,809
- Rent vs Own
- Severe rent burden
- 391.0
Population outlook (Bibb County) Hauer SSP2
- Today (2025)
- 148,772 people
- By 2030
- 145,904 · -1.9%
- By 2040
- 139,404 · -6.3%
- By 2050
- 131,603 · -11.5%
- By 2075
- 111,050 · -25.4%
- By 2100
- 83,346 · -44.0%
Race, ethnicity, and origin ACS 2023
- Neighborhood character
- Majority Black (57%)
- Race & ethnicity
- Black 57% White 38% Two or more races 4% Hispanic / Latino 2%
- Common ancestry
- Slovak 1% Italian 1%
- Foreign-born
- 1% · Canada
- Languages at home
- 98% English-only · Spanish 1%
Political lean MEDSL · Bibb
- 2024 margin
- Strong D (+22.4) · D 61.0% · R 38.5%
- 2008→2024 swing
- +4.4pp toward D · 2008: 18.0pp · 2024: 22.4pp
- All cycles
- 2024: D+22.4 2020: D+23.8 2016: D+20.2 2012: D+20.0 2008: D+18.0
Not yet ingested
- Civics
- —
Market trends
- HPI YoY
- ▲ 4.31%
- Current HPI
- 209.9166
- Rent YoY
- ▲ 10.85%
- Metro
- Macon-Bibb County, GA
- State GDP YoY
- ▲ 2.66%
- F500 in state
- 28
Industry mix (Fortune 500 HQ in GA)
| Industry | F500 HQs | Revenue |
|---|---|---|
| Paper / Packaging | 2 | $29B |
|
||
| Retail | 1 | $160B |
|
||
| Transportation / Logistics | 1 | $91B |
|
||
| Airlines | 1 | $62B |
|
||
| Consumer Goods | 1 | $47B |
|
||
| Utilities | 1 | $25B |
|
||
Price history
1 event — show timeline
- 2026-04-22 Listed $69,000 GAMLS
Property tax history
+41.1%/yrLatest (2025): $661 · +14.4% YoY. Source: county tax records.
Cash-flow waterfall
monthlySold comps — $/sqft
last 12 mo · ≤1 miLoading sold comps…