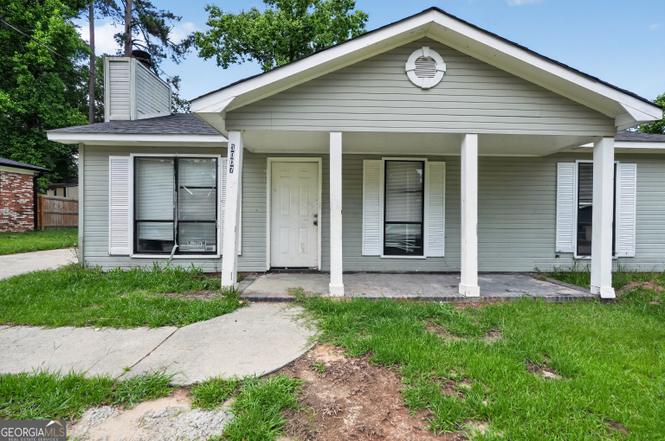
3007 Mistletoe Ave · Augusta-Richmond County consolidated government (balance), GA
Flood risk 6/10 · Moderate
- FEMA flood zone
- X (unshaded)
- Chance of flooding over 30 yrs
- 0.68%
- Est. flood insurance / yr
- $507 – $1,088
Fire risk 4/10 · Minor
- Est. fire insurance / yr
- $963 – $1,789
Heat risk 7/10 · Major
- Hot days now (above 106°F)
- 7 days/yr
- Hot days in 30 yrs
- 17 days/yr
Wind risk 6/10 · Moderate
- Chance of severe wind over 30 yrs
- 66.0%
Air-quality risk 3/10 · Minor
- Unhealthy air days now
- 3 days/yr
- Unhealthy air days in 30 yrs
- 3 days/yr
Risk factors via First Street. Map © Google.
Why this score? — see what drove the C+ grade
The composite is a weighted blend of 9 inputs, each scored 0–100. Each bar is that input's sub-score; the figure is the points it added to the 100-point composite (weight × sub-score).
- Cash flow +26.4/30.0
- ARV discount +10.9/15.0
- DSCR +9.0/10.0
- 1% rule +6.8/10.0
- Livability +2.5/5.0
- Condition / age +2.5/5.0
- Rent growth +2.3/5.0
- Schools +1.3/10.0
- Appreciation +0.0/10.0
$129,900
🖨 Deal sheet 📄 Offer letter ✓ Due diligence
Listing remarks MLS
Wonderfully redone home Freshly painted inside and out, updated Kitchen with new counter tops and new stainless steel appliances, updated bathrooms, New flooring throughout and a New Roof. One of the Owners is a licensed agent in the state of GA and SC. Call for a tour today.
Key facts
- 9,583 sq ft lot
- Parking
- Built 1985
Property features AI
Finance
- HOA & community: No HOA
Exterior
- Parking: Off-street parking with a parking pad (1 parking space)
- Utilities: Public water; Public sewer; Electricity available; Natural gas available
- Home design: Single-family residence (house); Resale property; Built in 1985
- Construction: Wood siding; Composition roof; Slab foundation
- Exterior features: Level lot
Interior
- Kitchen: Dishwasher; Microwave; Refrigerator
- Bedrooms: 3 bedrooms on the main level
- Flooring: Carpet; Other flooring
- Bathrooms: 2 full bathrooms on the main level
- Heating & cooling: Central heating with forced air; Central air conditioning
- Interior features: One-level layout; Fireplace in the family room; Other interior features
- Laundry & utility: Laundry features listed as other
Neighborhood map
What this means for you Summary
Snapshot
- This is a 3-bed/2.0-bath single-family listed at $130k.
Deal economics
- At list price, monthly cash flow is $341 ($4k/yr) — positive.
- The deal already cash-flows at list — no discount required.
- Meets the 1% rule at list price ($2k rent vs $130k).
- Cap rate 9.4% vs local median 5.3% in Augusta-Richmond County consolidated government (balance) — top-decile yield for the area; either an underpriced asset or a hidden risk that comps aren't pricing in. Stress-test before assuming the spread holds.
Location & tenants
- Location reads: area grade C — affects rentability + tenant quality, not the cash-flow math above.
- Richmond County (urban): math 12% / reading 20% proficiency, ranked #154 of 174 in GA (top 88%) — low school quality limits family demand, transient renter base, plan for 1-2y turnover; 72% free/reduced lunch — lower-income household profile, screen leases tightly.
- Zoned schools: Meadowbrook Elementary School (math 12% / reading 12%, grade F, #1,041 of 1,228 statewide, top 87%, 497 students, 98% FRL); Glenn Hills Middle School (math 2% / reading 6%, grade F, #467 of 470 statewide, top 99%, 762 students, 98% FRL); Glenn Hills High School (math 2% / reading 2%, grade F, #421 of 424 statewide, top 100%, 883 students, 98% FRL) — zoned schools average 98% FRL vs 72% district-wide (26 pts higher); higher-poverty schools than district average — tighter screening recommended.
- Market conditions: Rents soft (-0.7%/yr); 359 active listings in the ZIP; 23 comparable units currently listed for rent nearby; rentals at typical pace (median 23d on market — plan ~3-4 weeks tenant-placement turnaround); 48% of comp listings sitting > 30 days — soft ceiling on asking rent; 561 units permitted in Richmond County in 2024 (0 in 5+ unit buildings).
Forward outlook
- Local home prices are declining (-3.0%/yr); year-one equity from $898 of loan paydown is wiped out by about $4k of value loss. Plan a longer hold.
- Richmond County population projected to shrink 5% by 2050 — rents likely to lag national; underwrite the cash flow, not the appreciation.
Negotiation context
- Only 14 days on market — expect competitive offers; lowballing is unlikely to land.
- 7 sale attempts since 13y ago with the ask held roughly flat each time — persistent listings suggest the price (not the market) is what's stuck; bring a comps-based counter.
- Current owner paid $71k; list at $130k implies a 83% gain — meaningful room to come down on a strong offer.
Risks & watch-outs
- Climate carrying-cost: major flood risk; major wind risk, 66% chance of damaging wind over 30y; extreme-heat days projected 7→17/yr by 2055 (HVAC capex compounding) — expect insurance premiums to compound above CPI over the hold.
Questions for the listing agent
- Is there a deadline driving the sale (1031 exchange, divorce, estate, relocation)? That informs how much negotiation room exists.
- What's the average days-on-market for RENTAL listings here right now (not sales)? A rising rental-DOM trend means longer vacancies and softer asking-rent achievability than the comps imply.
- What's the recent tenant-quality profile in this submarket — average credit score on applications, eviction rate, late-payment / NSF rate, and stable-employment percentage? A property-management company in the area should have these aggregated.
- How much new for-sale + rental construction is in the pipeline within 1–3 miles? Heavy new supply typically softens prices + rents 12–24 months out; constrained supply supports both.
Investment metrics
- 1% rule
- 1.18% ✓
- Cap rate
- 9.44%
- Cash-on-cash
- 11.25%
- DSCR
- 1.50
- GRM
- 7.0
CMA / ARV
- ARV (on-the-fly)
- $140,562
- Comps found
- 12
Show comp detail 12 sales within ~0.75 mi
| Address | Dist | Beds/Ba | Sqft | Sold | Price | $/sf | Match |
|---|---|---|---|---|---|---|---|
| 3019 Mistletoe Ave | 0.10mi | 3/2.0 | 1,026 (0%) | 1mo | $180,000 | $175 | 94 |
| 3026 Mistletoe Ave | 0.12mi | 3/2.0 | 1,066 (+4%) | 7mo | $160,000 | $150 | 82 |
| 3004 Green Forest Dr | 0.07mi | 3/1.5 | 1,112 (+8%) | 0mo | $112,000 | $101 | 80 |
| 3016 Green Forest Drive Dr | 0.04mi | 3/2.0 | 999 (-3%) | 23mo | $120,900 | $121 | 74 |
| 2914 Butler Manor Dr | 0.17mi | 3/1.5 | 1,100 (+7%) | 6mo | $100,000 | $91 | 73 |
| 3516 Windermere Dr | 0.36mi | 3/1.5 | 1,093 (+6%) | 2mo | $150,000 | $137 | 69 |
| 2812 Bennington Dr | 0.62mi | 3/2.0 | 1,048 (+2%) | 2mo | $160,000 | $153 | 66 |
| 3524 Edgeworth Dr | 0.42mi | 3/2.0 | 1,100 (+7%) | 6mo | $165,000 | $150 | 63 |
| 3421 Morgan Rd | 0.19mi | 3/2.0 | 1,081 (+5%) | 22mo | $129,900 | $120 | 63 |
| 2838 Butler Manor Dr | 0.36mi | 3/1.5 | 1,136 (+11%) | 17mo | $155,000 | $136 | 50 |
| 2816 Cranbrook DR Dr | 0.66mi | 3/2.0 | 1,080 (+5%) | 17mo | $164,900 | $153 | 46 |
| 3003 Cromwell Ct | 0.57mi | 3/1.5 | 1,159 (+13%) | 22mo | $115,000 | $99 | 32 |
Match score weights: distance 35% · size 25% · config 20% · recency 20%. Top-matched comps best support the ARV.
Projected returns pro-forma
-3.0% appreciation · 0.0% rent growth · sell at horizon
- IRR
- -2.9%
- Equity multiple
- 0.89×
- Total profit
- $-3,825
- Equity at exit
- $19,369
- IRR
- 3.2%
- Equity multiple
- 1.20×
- Total profit
- $7,273
- Equity at exit
- $11,231
Cash invested: $36,372 (down + closing). Projections, not guarantees.
Landlord ↔ Tenant lean methodology
- Overall (STATE)
- 90 Strongly Landlord-Friendly
- State Georgia
- 90 Strongly Landlord-Friendly · R+3
- County
- — inherits STATE
- City
- — inherits STATE
ZIP-level market 30815
- Home prices YoY
- -24.2%
- Rents YoY
- -0.7%
- Active inventory
- 359
- Price-to-rent
- 7.0×
Monthly cashflow live
- Estimated rent
- $1,536 high interval (Pro) →
- Mortgage (P&I)
- −$681
- Tax from tax record
- −$137 /mo · $1,641/yr
- Insurance
- −$54
- HOA
- −$0
- Vacancy / Maint / Mgmt
- −$322
- Net cashflow
- $341
Break-even live
UW: 25.0% down · 7.5% · 30yr · 1.5% tax · 5.0% vac · 8.0% maint · 8.0% mgmt
Financing live
Cash to close
- Down payment
- $32,475
- Closing costs
- $3,897
- Reserves months
- —
- Total cash needed
- —
Loan-product check · same deal, 3 products live
Conventional
25% down · 7.5% · 30yr
- Down + closing
- —
- Monthly P&I
- —
- Monthly cashflow
- —
- DSCR
- —
- Eligible?
- —
Personal DTI + credit; lowest rate.
DSCR
20% down · 8.5% · 30yr
- Down + closing
- —
- Monthly P&I
- —
- Monthly cashflow
- —
- DSCR
- —
- Eligible?
- —
No personal income docs; deal must DSCR.
Hard money
10% down · 12.0% · 12mo
- Down + closing
- —
- Monthly P&I
- —
- Monthly cashflow
- —
- DSCR
- —
- Eligible?
- —
Short-term bridge; refi at stabilization.
Rent comps 23 comps
| Address | Beds | Baths | Sqft | Rent | $/sqft | DOM | Units | Dist |
|---|---|---|---|---|---|---|---|---|
| 2834 Brentway Dr Hephzibah, GA | 3.0 | 2.0 | 1475 | $1,600 | $1.08 | 43d | 1 | 0.30mi |
| 3524 Edgeworth Dr Hephzibah, GA | 3.0 | 2.0 | 1200 | $1,295 | $1.08 | 23d | 1 | 0.40mi |
| 2813 Leawood Ct Hephzibah, GA | 3.0 | 2.0 | 1377 | $1,250 | $0.91 | 43d | 1 | 0.49mi |
| 3543 Windermere Dr Hephzibah, GA | 4.0 | 2.0 | 1394 | $1,550 | $1.11 | 43d | 1 | 0.56mi |
| 3543 Windermere Dr Hephzibah, GA | 4.0 | 2.0 | 1394 | $1,550 | $1.11 | 23d | 1 | 0.56mi |
| 2727 Barclay St Hephzibah, GA | 4.0 | 2.0 | 1430 | $1,234 | $0.86 | 43d | 1 | 0.70mi |
| 3613 Alene Cir Augusta, GA | 3.0 | 2.0 | 1260 | $1,325 | $1.05 | 13d | 1 | 0.77mi |
| 2817 Ridgecrest Dr Hephzibah, GA | 4.0 | 2.0 | 1257 | $1,495 | $1.19 | 43d | 1 | 0.80mi |
| 3001 Alene Ct Augusta, GA | 4.0 | 2.0 | 1288 | $1,631 | $1.27 | 23d | 1 | 0.81mi |
| 1010 Horizon Ridge Dr Hephzibah, GA | 1.0–3.0 | 1.0–2.0 | 936 | $1,196 | $1.28 | 13d | 1 | 0.81mi |
| 2704 Cranbrook Dr Hephzibah, GA | 3.0 | 2.0 | 1377 | $1,650 | $1.20 | 43d | 1 | 0.85mi |
| 2631 Drayton Dr Augusta, GA | 3.0 | 2.0 | 1404 | $1,430 | $1.02 | 13d | 1 | 0.99mi |
| 2604 Edmonton Ct Hephzibah, GA | 3.0 | 2.0 | 1343 | $1,190 | $0.89 | 13d | 1 | 1.10mi |
| 2803 Ptarmigan Rd Hephzibah, GA | 3.0 | 2.0 | 1377 | $1,600 | $1.16 | 23d | 1 | 1.11mi |
| 2803 Ptarmigan Rd Hephzibah, GA | 3.0 | 2.0 | 1400 | $1,600 | $1.14 | 43d | 1 | 1.11mi |
| 2609 Dublin Dr Augusta, GA | 3.0 | 2.0 | 1400 | $1,395 | $1.00 | 13d | 1 | 1.12mi |
| 3532 Edmonton St Hephzibah, GA | 3.0 | 2.0 | 1377 | $1,425 | $1.03 | 43d | 1 | 1.17mi |
| 3532 Edmonton St Hephzibah, GA | 3.0 | 2.0 | 1377 | $1,425 | $1.03 | 23d | 1 | 1.17mi |
| 2808 Nighthawk Dr Augusta, GA | 3.0 | 2.0 | 1314 | $1,450 | $1.10 | 43d | 1 | 1.23mi |
| 2524 Drayton Dr Augusta, GA | 3.0 | 2.0 | 1404 | $1,700 | $1.21 | 43d | 1 | 1.27mi |
| 2941 Rollingwood Dr Augusta, GA | 3.0 | 2.0 | 1297 | $1,750 | $1.35 | 23d | 1 | 1.27mi |
| 3200 Deans Bridge Rd Augusta, GA | 1.0–4.0 | 1.0–1.5 | 1075 | $970 | $0.90 | 23d | 6 | 1.37mi |
| 2708 Blossom Dr Unit B Augusta, GA | 2.0 | 1.5 | 896 | $950 | $1.06 | 43d | 1 | 1.46mi |
Listing history 11 events
-
2026-06-18days on market $129,900 Active 14 DOM
-
2026-06-18status $129,900 Active 13 DOM
-
2026-06-17days on market $129,900 New 13 DOM
-
2026-06-16days on market $129,900 New 12 DOM
-
2026-06-15days on market $129,900 New 11 DOM
-
2026-06-14days on market $129,900 New 9 DOM
-
2026-06-10days on market $129,900 New 6 DOM
-
2026-06-09days on market $129,900 New 5 DOM
-
2026-06-08days on market $129,900 New 4 DOM
-
2026-06-07remarks 245-char remark
-
2026-06-07$129,900 New 3 DOM
ⓘ Source: listings_history table (triggers on properties + properties_extension) + one-shot
backfill from property_details.listing_events for pre-trigger history.
Tax reassessment forecast GA · Resets to sale price
- Current annual tax
- $1,641 · $137/mo
- Projected year-2 tax
- $1,641 · $137/mo
- Expected delta
- $0/yr ($0/mo · 0.0%)
ⓘ Screening estimate from a state-policy table — verify with the county assessor before closing.
Climate risk First Street
- Flood 6/10 Major FEMA zone X (unshaded) · 68% chance over 30 yrs
- Wildfire 4/10 Moderate
- Heat 7/10 Severe 7 d/yr ≥106°F today · 17 d/yr by 30 yrs out
- Wind 6/10 Major 66% chance of damaging wind over 30 yrs
- Air quality 3/10 Moderate 3 unhealthy d/yr today · 3 by 30 yrs out
Nearby sold comps map
Loading sold comps map…
Walkable amenities ~0.75 mi
Loading nearby amenities…
Taxation est. · year 1
- Rental income
- $18,427
- − Mortgage interest
- −$7,276
- − Property taxes
- −$1,641
- − Insurance
- −$650
- − Repairs & maintenance
- −$1,474
- − Management
- −$1,474
- − Depreciation
- −$3,779
- Taxable income
- $2,132
- Est. tax owed @ 24.0%
- −$512
- After-tax cash flow
- $3,580/yr
For passive investors: Depreciation is non-cash, so a rental often shows a tax loss while cash-flowing — sheltering income. Rental losses are passive: they offset passive income freely, and up to $25,000/yr can offset ordinary (W-2) income if you actively participate and your MAGI is under $100k (phasing out to $0 by $150k); unused losses carry forward. On sale, claimed depreciation is recaptured at up to 25%, and gains may owe capital-gains tax (a 1031 exchange can defer both). Figures are a year-1 estimate at your 24.0% rate — not tax advice; consult a CPA.
Schools (NCES district)
- District
- Richmond County
- NCES district ID
- 1304380
- Math proficiency
- 12% ▼ -9.00%
- Reading proficiency
- 20% ▼ -6.00%
- Median HH income
- $38,069
- Composite
- 13.43/100
- National rank
- #9524
- State rank
- #154 of 174 in GA
Livability — Augusta-Richmond County consolidated government (balance)
No livability data for this city. (Only ~50 U.S. cities are tracked.)
Census & demographics
- Census place
- Augusta-Richmond County consolidated government (balance), GA
- County
- Richmond County · 190,917 people
- City population
- 154,035
- Metro
- Augusta-Richmond County, GA-SC
- Population (ZIP)
- 44,109
- Household income
- $70,202
- Rent vs Own
- Severe rent burden
- 867.0
Population outlook (Richmond County) Hauer SSP2
- Today (2025)
- 200,753 people
- By 2030
- 200,232 · -0.3%
- By 2040
- 196,813 · -2.0%
- By 2050
- 190,347 · -5.2%
- By 2075
- 172,496 · -14.1%
- By 2100
- 146,284 · -27.1%
Race, ethnicity, and origin ACS 2023
- Neighborhood character
- Majority Black (62%)
- Race & ethnicity
- Black 62% White 27% Two or more races 5% Hispanic / Latino 4%
- Foreign-born
- 4% · Canada, South Korea
- Languages at home
- 93% English-only · Spanish 3% Other Indo-European 1% Korean 1%
Political lean MEDSL · Richmond
- 2024 margin
- Solid D (+36.1) · D 67.8% · R 31.7%
- 2008→2024 swing
- +4.3pp toward D · 2008: 31.8pp · 2024: 36.1pp
- All cycles
- 2024: D+36.1 2020: D+37.2 2016: D+32.4 2012: D+33.8 2008: D+31.8
Not yet ingested
- Civics
- —
Market trends
- HPI YoY
- ▼ -51.74%
- Current HPI
- 162.4074
- Rent YoY
- ▼ -0.71%
- Metro
- Augusta-Richmond County, GA-SC
- State GDP YoY
- ▲ 2.66%
- F500 in state
- 28
Industry mix (Fortune 500 HQ in GA)
| Industry | F500 HQs | Revenue |
|---|---|---|
| Paper / Packaging | 2 | $29B |
|
||
| Retail | 1 | $160B |
|
||
| Transportation / Logistics | 1 | $91B |
|
||
| Airlines | 1 | $62B |
|
||
| Consumer Goods | 1 | $47B |
|
||
| Utilities | 1 | $25B |
|
||
Price history
+182.4% since first listed15 events — show timeline
- 2026-06-04 Listed $129,900 GAMLS
- 2018-08-14 Sold (Public Records) $71,000 Public Records
- 2018-08-08 Sold (MLS) $71,000 Hive MLS
- 2018-08-08 Sold (MLS) $71,000 Hive MLS
- 2018-07-17 Listed $75,000 Hive MLS
- 2018-07-17 Listed $75,000 Hive MLS
- 2018-05-01 Sold (MLS) $25,000 Hive MLS
- 2018-05-01 Sold (MLS) $25,000 Hive MLS
- 2018-04-12 Listed $35,000 Hive MLS
- 2018-04-12 Listed $35,000 Hive MLS
- 2014-01-31 Sold (MLS) $29,000 Hive MLS
- 2014-01-31 Sold (MLS) $29,000 Hive MLS
- 2013-10-24 Listed $35,000 Hive MLS
- 2013-10-24 Listed $35,000 Hive MLS
- 2003-10-08 Sold (Public Records) $46,000 Public Records
Property tax history
+3.3%/yrLatest (2025): $1,641 · -8.3% YoY. Source: county tax records.
Cash-flow waterfall
monthlySold comps — $/sqft
last 12 mo · ≤1 miLoading sold comps…