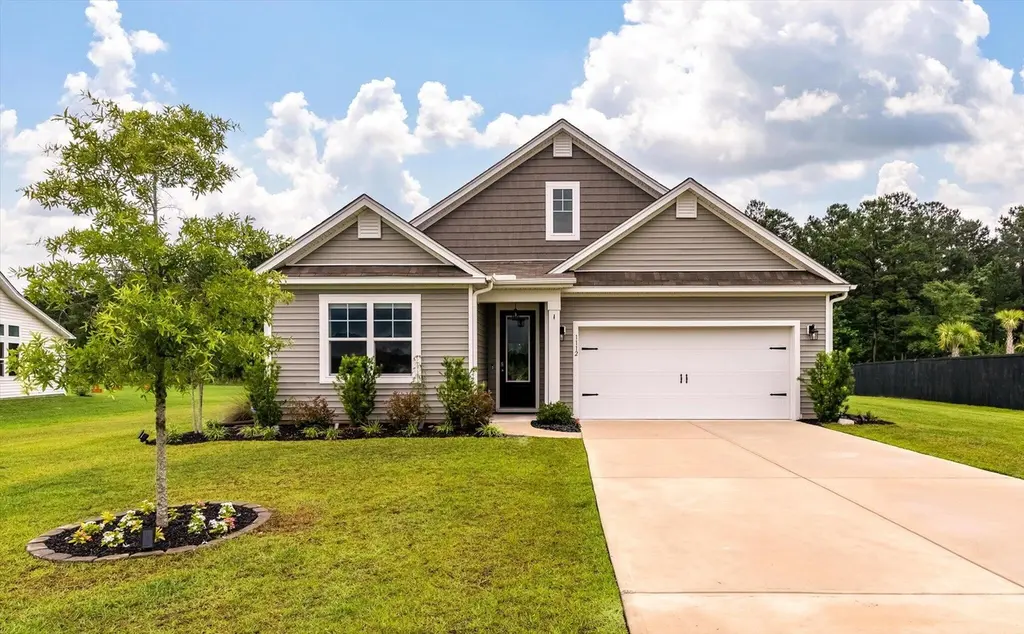
1112 Wading Point Blvd · Charleston, SC
Flood risk 1/10 · Minimal
- FEMA flood zone
- X (unshaded)
- Chance of flooding over 30 yrs
- 0.0%
- Est. flood insurance / yr
- $507 – $1,088
Fire risk 7/10 · Major
- Est. fire insurance / yr
- $783 – $1,453
Heat risk 9/10 · Severe
- Hot days now (above 108°F)
- 7 days/yr
- Hot days in 30 yrs
- 18 days/yr
Wind risk 8/10 · Major
- Chance of severe wind over 30 yrs
- 97.0%
Air-quality risk 3/10 · Minor
- Unhealthy air days now
- 3 days/yr
- Unhealthy air days in 30 yrs
- 4 days/yr
Risk factors via First Street. Map © Google.
Why this score? — see what drove the D- grade
The composite is a weighted blend of 9 inputs, each scored 0–100. Each bar is that input's sub-score; the figure is the points it added to the 100-point composite (weight × sub-score).
- ARV discount +12.4/15.0
- Cash flow +6.4/30.0
- Condition / age +4.8/5.0
- Appreciation +4.4/10.0
- Livability +3.8/5.0
- Schools +3.6/10.0
- Rent growth +2.5/5.0
- DSCR +0.7/10.0
- 1% rule +0.6/10.0
$535,000
🖨 Deal sheet 📄 Offer letter ✓ Due diligence
Listing remarks MLS
French Quarter Creek is the community you've been searching for. With stunning water views and the privacy of being tucked away in the Francis Marion National Forest, you are only 15 minutes from the bustle of Mount Pleasant and the beaches. Sprawling homesites afford homeowners the ability to make outdoor living their own. Homes in French Quarter Creek are under construction now with completion dates ranging from nearing completion to 6 months out. Appointed with the most sought-after finishes, you'll love what you find at French Quarter Creek. The Cantey floorplan features single-story living with a large great room and convenient flex space. The primary bedroom has two walk-in closets and a double bowl vanity. A secondary bedroom, bathroom, and laundry room complete the first-floor.
Key facts
- Tray ceiling
- Gas fireplace
- Unobstructed views
Tags
Property features AI
Finance
- HOA & community: Association fee $660 semi-annually; Community amenities include dock facilities, dog park, park, pool, and walk/jog trails
Exterior
- Parking: 2-car garage with garage door opener
- Utilities: Septic tank; BCW & SA water service; Berkeley Electric Co-Op power
- Home design: Residential single-family attached; One story; Fee simple ownership; Located in French Quarter Creek subdivision
- Construction: One-level construction
- Exterior features: Fiberglass roof; Pond site; Wooded setting; Shed(s)
Interior
- Kitchen: Dishwasher; Gas range; Microwave; Refrigerator
- Bedrooms: 3 bedrooms; Primary bedroom on lower level with ceiling fan and walk-in closet
- Flooring: Carpet; Ceramic tile; Luxury vinyl
- Bathrooms: 2 bathrooms
- Heating & cooling: Central air conditioning; Natural gas heating
- Interior features: Smooth ceilings; Tray ceilings; High ceilings; Kitchen island; Walk-in closets; Ceiling fans; Eat-in kitchen; Family room; Formal living room; Pantry
- Laundry & utility: Laundry room with washer and electric dryer hookups; Tankless water heater
Neighborhood map
What this means for you Summary
Snapshot
- This is a 3-bed/2.0-bath single-family listed at $535k. Condition is rated excellent.
Deal economics
- At list price, monthly cash flow is $-930 ($-11k/yr) — negative.
- To cash-flow at today's rent, offer at most $371k (30.7% below list).
- To meet the 1% rule (rent ≥ 1% of price), the offer needs to be $300k (44.0% below list).
- Recommended offer: $300k (44.0% below list) — sets the bar for 1% rule.
- Cap rate 4.2% vs local median 2.4% in Charleston — top-decile yield for the area; either an underpriced asset or a hidden risk that comps aren't pricing in. Stress-test before assuming the spread holds.
Location & tenants
- Location reads 76/100 on livability (#22 in SC, #3,336 nationally) — a middle-class / working-renter tenant base. Strengths: amenities A+, housing A+, health & safety A+; Watch: crime D+, commute F, cost of living D-.
- Berkeley 01 (suburban): math 35% / reading 48% proficiency, ranked #30 of 80 in SC (top 38%) — families likely to look elsewhere, expect single-tenant / working-renter base with shorter leases.
- Zoned schools: Cainhoy Elementary (math 2% / reading 12%, grade F, #594 of 597 statewide, top 100%, 154 students, 100% FRL); Philip Simmons Middle (math 31% / reading 48%, grade F, #82 of 229 statewide, top 37%, 428 students, 35% FRL); Philip Simmons High (math 42% / reading 92%, grade B, #73 of 196 statewide, top 41%, 771 students, 21% FRL) — zoned schools at 52% FRL track the district average.
- Market conditions: 69 active listings in the ZIP; 1 comparable units currently listed for rent nearby; 3,183 units permitted in Berkeley County in 2024 (580 in 5+ unit buildings).
Forward outlook
- Local home prices are declining (-1.1%/yr); year-one equity from $4k of loan paydown is wiped out by about $6k of value loss. Plan a longer hold.
- Berkeley County population projected at +48% by 2050 — long-run rental-demand tailwind backs the buy-and-hold thesis.
Negotiation context
- Only 13 days on market — expect competitive offers; lowballing is unlikely to land.
- 2 sale attempts since 4y ago with the ask held roughly flat each time — persistent listings suggest the price (not the market) is what's stuck; bring a comps-based counter.
Risks & watch-outs
- Climate carrying-cost: severe wind risk, 97% chance of damaging wind over 30y; major wildfire risk; extreme-heat days projected 7→18/yr by 2055 (HVAC capex compounding) — expect insurance premiums to compound above CPI over the hold.
Questions for the listing agent
- What do current leases actually rent for vs. the listed asking? Can we see a recent rent roll and the last 12 months of T-12 income?
- What does the HOA fee cover, when was the last increase, and are there any pending special assessments or reserve-fund shortfalls?
- Is there a deadline driving the sale (1031 exchange, divorce, estate, relocation)? That informs how much negotiation room exists.
- Schools are A-rated — typically a magnet for longer-tenancy family renters. What's the average tenant stay here, and is there a school-zone premium baked into asking?
- Crime grade is D in this area — have there been break-ins, vandalism, or insurance claims at this property in the last 3 years? What carrier currently insures it and at what premium?
- The area grade is low — what's the realistic commute time and amenity access for the typical tenant pool here? Any planned neighborhood developments (good or bad) we should know about?
- What's the average days-on-market for RENTAL listings here right now (not sales)? A rising rental-DOM trend means longer vacancies and softer asking-rent achievability than the comps imply.
- What's the recent tenant-quality profile in this submarket — average credit score on applications, eviction rate, late-payment / NSF rate, and stable-employment percentage? A property-management company in the area should have these aggregated.
- How much new for-sale + rental construction is in the pipeline within 1–3 miles? Heavy new supply typically softens prices + rents 12–24 months out; constrained supply supports both.
Investment metrics
- 1% rule
- 0.56% ✗
- Cap rate
- 4.21%
- Cash-on-cash
- -7.45%
- DSCR
- 0.67
- GRM
- 14.9
CMA / ARV
- ARV (on-the-fly)
- $600,644
- Comps found
- 12
Show comp detail 12 sales within ~0.75 mi
| Address | Dist | Beds/Ba | Sqft | Sold | Price | $/sf | Match |
|---|---|---|---|---|---|---|---|
| 1126 Wading Point Blvd | 0.11mi | 3/3.0 | 2,481 (-0%) | 10mo | $550,000 | $222 | 82 |
| 1181 Wading Point Blvd | 0.40mi | 3/3.0 | 2,482 (0%) | 3mo | $560,000 | $226 | 75 |
| 1144 Wading Point Blvd | 0.26mi | 3/2.5 | 2,188 (-12%) | 4mo | $525,000 | $240 | 63 |
| 732 Breakers Reef Ln | 0.64mi | 3/2.5 | 2,413 (-3%) | 13mo | $635,000 | $263 | 53 |
| 227 Huguenot Trl | 0.49mi | 4/2.0 (+1) | 2,704 (+9%) | 6mo | $656,510 | $243 | 52 |
| 246 Silver Creek Dr | 0.60mi | 3/2.5 | 2,207 (-11%) | 1mo | $535,000 | $242 | 51 |
| 105 Weston James | 0.66mi | 4/3.5 (+1) | 2,393 (-4%) | 7mo | $779,000 | $326 | 47 |
| 230 Huguenot Trl | 0.45mi | 4/3.5 (+1) | 2,732 (+10%) | 6mo | $641,804 | $235 | 46 |
| 242 Huguenot Trl | 0.45mi | 3/21.0 | 2,611 (+5%) | 5mo | $677,414 | $259 | 46 |
| 255 Huguenot Trl | 0.56mi | 4/3.5 (+1) | 2,732 (+10%) | 1mo | $656,990 | $240 | 45 |
| 727 Breakers Reef Ln | 0.71mi | 3/2.0 | 2,271 (-8%) | 12mo | $667,580 | $294 | 43 |
| 313 Cypress Branch Rd | 0.72mi | 3/2.5 | 2,190 (-12%) | 10mo | $515,000 | $235 | 37 |
Match score weights: distance 35% · size 25% · config 20% · recency 20%. Top-matched comps best support the ARV.
Projected returns pro-forma
-1.12% appreciation · 3.0% rent growth · sell at horizon
- IRR
- -16.3%
- Equity multiple
- 0.32×
- Total profit
- $-102,494
- Equity at exit
- $126,164
- IRR
- -9.6%
- Equity multiple
- 0.16×
- Total profit
- $-125,605
- Equity at exit
- $129,959
Cash invested: $149,800 (down + closing). Projections, not guarantees.
Landlord ↔ Tenant lean methodology
- Overall (STATE)
- 90 Strongly Landlord-Friendly
- State South Carolina
- 90 Strongly Landlord-Friendly · R+6
- County
- — inherits STATE
- City
- — inherits STATE
ZIP-level market 29450
- Home prices YoY
- -0.2%
- Active inventory
- 69
- Price-to-rent
- 14.9×
Monthly cashflow live
- Estimated rent
- $2,995 medium interval (Pro) →
- Mortgage (P&I)
- −$2,806
- Tax from tax record
- −$157 /mo · $1,886/yr
- Insurance
- −$223
- HOA
- −$110
- Vacancy / Maint / Mgmt
- −$629
- Net cashflow
- $-930
Break-even live
UW: 25.0% down · 7.5% · 30yr · 1.5% tax · 5.0% vac · 8.0% maint · 8.0% mgmt
Financing live
Cash to close
- Down payment
- $133,750
- Closing costs
- $16,050
- Reserves months
- —
- Total cash needed
- —
Loan-product check · same deal, 3 products live
Conventional
25% down · 7.5% · 30yr
- Down + closing
- —
- Monthly P&I
- —
- Monthly cashflow
- —
- DSCR
- —
- Eligible?
- —
Personal DTI + credit; lowest rate.
DSCR
20% down · 8.5% · 30yr
- Down + closing
- —
- Monthly P&I
- —
- Monthly cashflow
- —
- DSCR
- —
- Eligible?
- —
No personal income docs; deal must DSCR.
Hard money
10% down · 12.0% · 12mo
- Down + closing
- —
- Monthly P&I
- —
- Monthly cashflow
- —
- DSCR
- —
- Eligible?
- —
Short-term bridge; refi at stabilization.
Rent comps 1 comps
| Address | Beds | Baths | Sqft | Rent | $/sqft | DOM | Units | Dist |
|---|---|---|---|---|---|---|---|---|
| 1024 Wading Point Blvd Huger, SC | 4.0 | 2.0 | 1871 | $2,995 | $1.60 | 3d | 1 | 0.74mi |
HOA detail
- Monthly dues
- $110 · $1,320/yr
- Likely covers
- water
Listing history 11 events
-
2026-06-18days on market $535,000 Active 13 DOM
-
2026-06-17days on market $535,000 Active 12 DOM
-
2026-06-16days on market $535,000 Active 11 DOM
-
2026-06-15days on market $535,000 Active 10 DOM
-
2026-06-13days on market $535,000 Active 8 DOM
-
2026-06-13days on market $535,000 Active 7 DOM
-
2026-06-10days on market $535,000 Active 5 DOM
-
2026-06-09days on market $535,000 Active 4 DOM
-
2026-06-08days on market $535,000 Active 3 DOM
-
2026-06-07remarks 699-char remark
-
2026-06-07$535,000 Active 2 DOM
ⓘ Source: listings_history table (triggers on properties + properties_extension) + one-shot
backfill from property_details.listing_events for pre-trigger history.
Tax reassessment forecast SC · Resets to sale price
- Current annual tax
- $1,886 · $157/mo
- Projected year-2 tax
- $3,050 · $254/mo
- Expected delta
- +$1,163/yr (+$97/mo · 61.7%)
ⓘ Screening estimate from a state-policy table — verify with the county assessor before closing.
Climate risk First Street
- Flood 1/10 Low FEMA zone X (unshaded) · 0% chance over 30 yrs
- Wildfire 7/10 Severe
- Heat 9/10 Extreme 7 d/yr ≥108°F today · 18 d/yr by 30 yrs out
- Wind 8/10 Severe 97% chance of damaging wind over 30 yrs
- Air quality 3/10 Moderate 3 unhealthy d/yr today · 4 by 30 yrs out
Nearby sold comps map
Loading sold comps map…
Walkable amenities ~0.75 mi
Loading nearby amenities…
Taxation est. · year 1
- Rental income
- $35,940
- − Mortgage interest
- −$29,968
- − Property taxes
- −$1,886
- − Insurance
- −$2,675
- − Repairs & maintenance
- −$2,875
- − Management
- −$2,875
- − HOA
- −$1,320
- − Depreciation
- −$15,564
- Taxable loss
- −$21,223
- Est. tax savings @ 24.0%
- +$5,094
- After-tax cash flow
- $-6,062/yr
For passive investors: Depreciation is non-cash, so a rental often shows a tax loss while cash-flowing — sheltering income. Rental losses are passive: they offset passive income freely, and up to $25,000/yr can offset ordinary (W-2) income if you actively participate and your MAGI is under $100k (phasing out to $0 by $150k); unused losses carry forward. On sale, claimed depreciation is recaptured at up to 25%, and gains may owe capital-gains tax (a 1031 exchange can defer both). Figures are a year-1 estimate at your 24.0% rate — not tax advice; consult a CPA.
Condition & rehab AI · 12 photos
This single-family home in French Quarter Creek is in excellent condition with modern finishes and a well-maintained exterior. It offers a great value for both resale and rental due to its location and features.
Value-add opportunities
- Both landscaping — enhances curb appeal and outdoor living space
- Both smart home integration — increases home's value and convenience
Renovation cost estimate screening
Value-add ROI direction
- Both landscaping — enhances curb appeal and outdoor living space ↑
- Both smart home integration — increases home's value and convenience ↑
ⓘ Cost ranges are severity-bucket heuristics (US national rule-of-thumb). Get contractor quotes + a written scope before underwriting a rehab budget.
Schools (NCES district)
- District
- Berkeley 01
- NCES district ID
- 4501170
- Math proficiency
- 35% ▼ -8.00%
- Reading proficiency
- 48% ▼ -2.00%
- Median HH income
- $52,724
- Composite
- 35.95/100
- National rank
- #4799
- State rank
- #30 of 80 in SC
Livability — Charleston
- Score
- 76/100
- State rank
- #22
- US rank
- #3336
Category grades
Schools grade is shown separately in the Schools card above.
Census & demographics
- City population
- 200,573
- Population (ZIP)
- 3,124
Population outlook (Berkeley County) Hauer SSP2
- Today (2025)
- 254,184 people
- By 2030
- 279,677 · +10.0%
- By 2040
- 329,379 · +29.6%
- By 2050
- 375,557 · +47.8%
- By 2075
- 476,740 · +87.6%
- By 2100
- 535,945 · +110.8%
Race, ethnicity, and origin ACS 2023
- Neighborhood character
- Majority Black (64%)
- Race & ethnicity
- Black 64% White 25% Hispanic / Latino 9% Two or more races 4%
- Hispanic origin (detail)
- Mexican 6% Dominican 2%
- Common ancestry
- Serbian 7% Italian 1% Lithuanian 1%
- Foreign-born
- 2% · Canada
- Languages at home
- 96% English-only · Spanish 3%
Political lean MEDSL · Berkeley
- 2024 margin
- R (+16.3) · D 41.1% · R 57.4% · Other 1.4%
- 2008→2024 swing
- -3.2pp toward R · 2008: -13.1pp · 2024: -16.3pp
- All cycles
- 2024: R+16.3 2020: R+11.7 2016: R+17.4 2012: R+18.9 2008: R+13.1
Not yet ingested
- Civics
- —
Market trends
- HPI YoY
- ▼ -1.12%
- Current HPI
- 462.4619
- Rent YoY
- —
- Metro
- —
- State GDP YoY
- ▲ 4.51%
- F500 in state
- 2
Industry mix (Fortune 500 HQ in SC)
| Industry | F500 HQs | Revenue |
|---|---|---|
| Packaging | 1 | $7B |
|
||
Price history
-90.1% since first listed4 events — show timeline
- 2026-06-05 Listed $535,000 Charleston Trident MLS
- 2022-12-27 Listed $465,377 Charleston Trident MLS
- 2022-12-27 Sold (MLS) $465,377 Charleston Trident MLS
- 2022-05-27 Sold (Public Records) $5,379,392 Public Records
Property tax history
-7.3%/yrLatest (2025): $1,886 · -12.4% YoY. Source: county tax records.
Cash-flow waterfall
monthlySold comps — $/sqft
last 12 mo · ≤1 miLoading sold comps…