4684 Green Rd · Warrensville Heights, OH
Flood risk 5/10 · Moderate
- FEMA flood zone
- X (unshaded)
- Chance of flooding over 30 yrs
- 0.65%
- Est. flood insurance / yr
- $507 – $1,088
Fire risk 1/10 · Minimal
- Est. fire insurance / yr
- $713 – $1,323
Heat risk 2/10 · Minimal
- Hot days now (above 96°F)
- 7 days/yr
- Hot days in 30 yrs
- 17 days/yr
Wind risk 1/10 · Minimal
- Chance of severe wind over 30 yrs
- —
Air-quality risk 3/10 · Minor
- Unhealthy air days now
- 2 days/yr
- Unhealthy air days in 30 yrs
- 4 days/yr
Risk factors via First Street. Map © Google.
Why this score? — see what drove the D grade
The composite is a weighted blend of 9 inputs, each scored 0–100. Each bar is that input's sub-score; the figure is the points it added to the 100-point composite (weight × sub-score).
- Cash flow +14.8/30.0
- ARV discount +7.5/15.0
- Rent growth +5.0/5.0
- DSCR +4.5/10.0
- 1% rule +3.9/10.0
- Livability +3.7/5.0
- Condition / age +2.5/5.0
- Schools +2.1/10.0
- Appreciation +0.0/10.0
$144,900
🖨 Deal sheet (PDF) 📄 Offer letter ✓ Due diligence
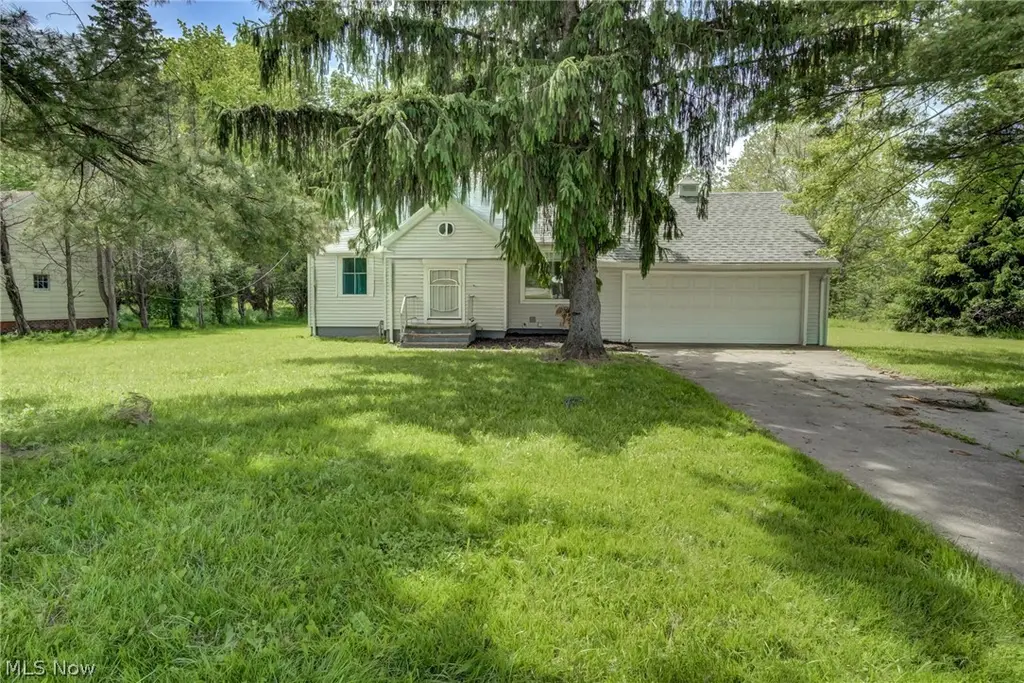
Listing remarks
Great opportunity to own this 3-bedroom bungalow in Warrensville Heights! Conveniently located near shopping, public transportation, and quick access to I-271 and I-480, this home offers both comfort and convenience. Whether you're searching for a starter home, downsizing, or adding to your investment portfolio, this property is full of potential. The home features a spacious backyard and an enclosed rear porch, perfect for relaxing or entertaining. Included in the sale is an additional parcel (Parcel No. 771-11-019) totaling 0.689 acres, providing extra outdoor space and added value. Updates include a newer furnace and a waterproofed basement completed in 2020, with foundation drains repla
Key facts
- Spacious backyard
- Newer furnace
- Enclosed rear porch
Tags
Property features AI
Finance
- Other: Home warranty included; Below-grade finished area of 696 (per assessor); Above-grade finished area of 1,028 (per owner)
Exterior
- Parking: Attached paved garage; 2 garage spaces
- Utilities: Public water; Public sewer
- Home design: 2-story home; Attached property
- Construction: Vinyl siding; Asphalt/fiberglass roof; Built in (year per public records)
- Exterior features: East-facing property; Lot approximately 79 x 140
Interior
- Kitchen: Dishwasher; Range
- Bedrooms: 2 main-level bedrooms
- Bathrooms: 1 full bathroom on the main level
- Heating & cooling: Central air conditioning; Forced-air gas heating
- Interior features: Partially finished basement with sump pump; Total of 5 rooms
Neighborhood map
What this means for you Summary
Snapshot
- This is a 3-bed/1.0-bath single-family listed at $145k.
Deal economics
- At list price, monthly cash flow is $40 ($476/yr) — positive.
- The deal already cash-flows at list — no discount required.
- To meet the 1% rule (rent ≥ 1% of price), the offer needs to be $129k (11.2% below list).
- Recommended offer: $129k (11.2% below list) — sets the bar for 1% rule.
Location & tenants
- Location reads 73/100 on livability (#316 in OH) — a middle-class / working-renter tenant base. Strengths: cost of living A+, housing A+; Watch: crime C-, health & safety D, commute D-.
- Warrensville Heights City (suburban): math 22% / reading 29% proficiency, ranked #604 of 656 in OH (top 92%) — low school quality limits family demand, transient renter base, plan for 1-2y turnover; 84% free/reduced lunch — lower-income household profile, screen leases tightly.
- Zoned schools: Warrensville Heights Elementary School (876 students, 0% FRL); Warrensville Heights Middle School (math 13% / reading 23%, grade F, #617 of 654 statewide, top 94%, 374 students, 0% FRL); Warrensville Heights High School (math 12% / reading 47%, grade F, #619 of 781 statewide, top 80%, 547 students, 0% FRL) — zoned schools average 0% FRL vs 84% district-wide (84 pts lower); this property's tenant base skews higher-income than the district average.
- Market conditions: Rents rising fast (+12.0%/yr); 32 active listings in the ZIP; 6 comparable units currently listed for rent nearby; rentals at typical pace (median 24d on market — plan ~3-4 weeks tenant-placement turnaround); lower-income renter base — watch delinquency; 1,441 units permitted in Cuyahoga County in 2024 (700 in 5+ unit buildings).
- This rent runs 35% of the median local income ($44k/yr) — at the standard rent-burdened threshold; future hikes will face affordability resistance.
Forward outlook
- Local home prices are declining (-3.0%/yr); year-one equity from $1k of loan paydown is wiped out by about $4k of value loss. Plan a longer hold.
- Cuyahoga County population projected to shrink 8% by 2050 — rents likely to lag national; underwrite the cash flow, not the appreciation.
Negotiation context
- Only 3 days on market — expect competitive offers; lowballing is unlikely to land.
- 6 sale attempts since 19y ago with the ask held roughly flat each time — persistent listings suggest the price (not the market) is what's stuck; bring a comps-based counter.
- Current owner paid $43k; list at $145k implies a 238% gain — meaningful room to come down on a strong offer.
Risks & watch-outs
- Watch-outs: built in 1956 — expect roof / HVAC / electrical / plumbing capex.
- Climate carrying-cost: moderate flood risk — expect insurance premiums to compound above CPI over the hold.
Questions for the listing agent
- Built in 1956 — when were the roof, HVAC, electrical panel, plumbing, and water heater last replaced?
- Is there a deadline driving the sale (1031 exchange, divorce, estate, relocation)? That informs how much negotiation room exists.
- The area grade is low — what's the realistic commute time and amenity access for the typical tenant pool here? Any planned neighborhood developments (good or bad) we should know about?
- What's the average days-on-market for RENTAL listings here right now (not sales)? A rising rental-DOM trend means longer vacancies and softer asking-rent achievability than the comps imply.
- What's the recent tenant-quality profile in this submarket — average credit score on applications, eviction rate, late-payment / NSF rate, and stable-employment percentage? A property-management company in the area should have these aggregated.
- How much new for-sale + rental construction is in the pipeline within 1–3 miles? Heavy new supply typically softens prices + rents 12–24 months out; constrained supply supports both.
Investment metrics
- 1% rule
- 0.89% ✗
- Cap rate
- 6.62%
- Cash-on-cash
- 1.17%
- DSCR
- 1.05
- GRM
- 9.4
CMA / ARV
No comps found within radius.
Projected returns pro-forma
-3.0% appreciation · 8.0% rent growth · sell at horizon
- IRR
- -9.1%
- Equity multiple
- 0.65×
- Total profit
- $-14,151
- Equity at exit
- $21,605
- IRR
- 6.0%
- Equity multiple
- 1.54×
- Total profit
- $21,892
- Equity at exit
- $12,528
Cash invested: $40,572 (down + closing). Projections, not guarantees.
Landlord ↔ Tenant lean methodology
- Overall (STATE)
- 73 Landlord-Friendly
- State Ohio
- 73 Landlord-Friendly · R+6
- County
- — inherits STATE
- City
- — inherits STATE
ZIP-level market 44128
- Rents YoY
- 12.0%
- Active inventory
- 32
- Price-to-rent
- 9.4×
Monthly cashflow live
- Estimated rent
- $1,287 high interval (Pro) →
- Mortgage (P&I)
- −$760
- Tax from tax record
- −$156 /mo · $1,877/yr
- Insurance
- −$60
- HOA
- −$0
- Vacancy / Maint / Mgmt
- −$270
- Net cashflow
- $40
Break-even live
Sensitivity live
| Price | -10% $122 | -5% $81 | +0% $40 | +5% $-1 | +10% $-42 |
|---|---|---|---|---|---|
| Rent | -10% $-62 | -5% $-11 | +0% $40 | +5% $90 | +10% $141 |
| Rate | -1.0pp $113 | -0.5pp $77 | base $40 | +0.5pp $2 | +1.0pp $-36 |
UW: 25.0% down · 7.5% · 30yr · 1.5% tax · 5.0% vac · 8.0% maint · 8.0% mgmt
Financing live
Cash to close
- Down payment
- $36,225
- Closing costs
- $4,347
- Reserves months
- —
- Total cash needed
- —
Loan-product check · same deal, 3 products live
Conventional
25% down · 7.5% · 30yr
- Down + closing
- —
- Monthly P&I
- —
- Monthly cashflow
- —
- DSCR
- —
- Eligible?
- —
Personal DTI + credit; lowest rate.
DSCR
20% down · 8.5% · 30yr
- Down + closing
- —
- Monthly P&I
- —
- Monthly cashflow
- —
- DSCR
- —
- Eligible?
- —
No personal income docs; deal must DSCR.
Hard money
10% down · 12.0% · 12mo
- Down + closing
- —
- Monthly P&I
- —
- Monthly cashflow
- —
- DSCR
- —
- Eligible?
- —
Short-term bridge; refi at stabilization.
Rent comps 6 comps
| Address | Beds | Baths | Sqft | Rent | $/sqft | DOM | Units | Dist |
|---|---|---|---|---|---|---|---|---|
| 4761 Walford Rd Cleveland, OH | 1.0–4.0 | 1.0–1.5 | 1021 | $1,200 | $1.17 | 0d | 176 | 0.41mi |
| 4340 Clarkwood Pkwy Cleveland, OH | 1.0–4.0 | 1.0–2.0 | 1007 | $1,108 | $1.10 | 0d | 483 | 0.67mi |
| 20859 Ellacott Pkwy Warrensville Heights, OH | 2.0 | 1.0 | 672 | $955 | $1.42 | 45d | 1 | 1.01mi |
| 20859 Ellacott Pkwy Warrensville Heights, OH | 2.0 | 1.0 | 672 | $955 | $1.42 | 23d | 1 | 1.01mi |
| 20763 Ellacott Pkwy Cleveland, OH | 2.0 | 1.0 | 672 | $955 | $1.42 | 45d | 1 | 1.03mi |
| 5303 Northfield Rd Bedford Heights, OH | 2.0 | 1.0–2.0 | 712 | $1,210 | $1.70 | 0d | 26 | 1.27mi |
Listing history 15 events
-
2026-05-31status $144,900 Pending 3 DOM
-
2026-05-28$144,900 Active
-
2023-05-10status Active
-
2023-04-27historical Contingent
-
2023-04-25$125,000 Active
-
2017-06-06historical
-
2017-05-03price $74,900
-
2017-03-21$79,000 Active
-
2011-10-07historical
-
2011-07-26$59,900
-
2007-10-26soldstatus $42,900
-
2007-09-20$44,900
-
2007-08-22soldstatus $36,667
-
2000-04-24soldstatus $59,000
-
1987-09-01soldstatus $62,900
ⓘ Source: listings_history table (triggers on properties + properties_extension) + one-shot
backfill from property_details.listing_events for pre-trigger history.
Tax reassessment forecast OH · Partial reset (capped growth)
- Current annual tax
- $1,877 · $156/mo
- Projected year-2 tax
- $2,069 · $172/mo
- Expected delta
- +$191/yr (+$16/mo · 10.2%)
ⓘ Screening estimate from a state-policy table — verify with the county assessor before closing.
Climate risk First Street
- Flood 5/10 Major FEMA zone X (unshaded) · 65% chance over 30 yrs
- Wildfire 1/10 Low
- Heat 2/10 Low 7 d/yr ≥96°F today · 17 d/yr by 30 yrs out
- Wind 1/10 Low
- Air quality 3/10 Moderate 2 unhealthy d/yr today · 4 by 30 yrs out
Nearby sold comps map
Loading sold comps map…
Walkable amenities ~0.75 mi
Loading nearby amenities…
Taxation est. · year 1
- Rental income
- $15,438
- − Mortgage interest
- −$8,117
- − Property taxes
- −$1,877
- − Insurance
- −$724
- − Repairs & maintenance
- −$1,235
- − Management
- −$1,235
- − Depreciation
- −$4,215
- Taxable loss
- −$1,966
- Est. tax savings @ 24.0%
- +$472
- After-tax cash flow
- $948/yr
For passive investors: Depreciation is non-cash, so a rental often shows a tax loss while cash-flowing — sheltering income. Rental losses are passive: they offset passive income freely, and up to $25,000/yr can offset ordinary (W-2) income if you actively participate and your MAGI is under $100k (phasing out to $0 by $150k); unused losses carry forward. On sale, claimed depreciation is recaptured at up to 25%, and gains may owe capital-gains tax (a 1031 exchange can defer both). Figures are a year-1 estimate at your 24.0% rate — not tax advice; consult a CPA.
Schools (NCES district)
- District
- Warrensville Heights City
- NCES district ID
- 3904500
- Math proficiency
- 22% ▼ -16.00%
- Reading proficiency
- 29% ▼ -15.00%
- Median HH income
- $34,622
- Composite
- 20.98/100
- National rank
- #8467
- State rank
- #604 of 656 in OH
Livability — Warrensville Heights
- Score
- 73/100
- State rank
- #316
- US rank
- #5173
Category grades
Schools grade is shown separately in the Schools card above.
Census & demographics
- Census place
- Warrensville Heights, OH
- County
- Cuyahoga County · 1,090,369 people
- City population
- 27,122
- Metro
- Cleveland-Elyria, OH
- Population (ZIP)
- 27,122
- Household income
- $43,993
- Rent vs Own
- Severe rent burden
- 2088.0
Population outlook (Cuyahoga County) Hauer SSP2
- Today (2025)
- 1,244,621 people
- By 2030
- 1,230,093 · -1.2%
- By 2040
- 1,189,108 · -4.5%
- By 2050
- 1,145,706 · -7.9%
- By 2075
- 1,076,557 · -13.5%
- By 2100
- 978,987 · -21.3%
Race, ethnicity, and origin ACS 2023
- Neighborhood character
- Predominantly Black (93%)
- Race & ethnicity
- Black 93% White 3% Two or more races 2% Hispanic / Latino 1%
- Common ancestry
- Romanian 1%
- Foreign-born
- 2% · Canada
- Languages at home
- 95% English-only · Spanish 4% French/Haitian/Cajun 1%
Political lean MEDSL · Cuyahoga
- 2024 margin
- Solid D (+31.5) · D 65.4% · R 33.9%
- 2008→2024 swing
- -7.4pp toward R · 2008: 38.9pp · 2024: 31.5pp
- All cycles
- 2024: D+31.5 2020: D+34.1 2016: D+35.0 2012: D+38.7 2008: D+38.9
Not yet ingested
- Civics
- —
Market trends
- HPI YoY
- ▼ -83.42%
- Current HPI
- 114.0877
- Rent YoY
- ▲ 11.96%
- Metro
- Cleveland-Elyria, OH
- State GDP YoY
- ▲ 1.98%
- F500 in state
- 48
Industry mix (Fortune 500 HQ in OH)
| Industry | F500 HQs | Revenue |
|---|---|---|
| Insurance | 3 | $145B |
|
||
| Industrial Machinery | 3 | $49B |
|
||
| Financial Services | 3 | $24B |
|
||
| Consumer Goods | 2 | $93B |
|
||
| Aerospace / Defense | 2 | $47B |
|
||
| Utilities | 2 | $33B |
|
||
Price history
+130.4% since first listed14 events — show timeline
- 2026-05-28 Listed $144,900 MLSNOW
- 2023-05-10 Relisted — MLSNOW
- 2023-04-27 Contingent — MLSNOW
- 2023-04-25 Listed $125,000 MLSNOW
- 2017-06-06 Listing Removed — MLSNOW
- 2017-05-03 Price Changed $74,900 MLSNOW
- 2017-03-21 Listed $79,000 MLSNOW
- 2011-10-07 Listing Removed — MLSNOW
- 2011-07-26 Listed $59,900 MLSNOW
- 2007-10-26 Sold (MLS) $42,900 MLSNOW
- 2007-09-20 Listed $44,900 MLSNOW
- 2007-08-22 Sold (Public Records) $36,667 Public Records
- 2000-04-24 Sold (Public Records) $59,000 Public Records
- 1987-09-01 Sold (Public Records) $62,900 Public Records
Property tax history
+6.6%/yrLatest (2025): $1,877 · -8.1% YoY. Source: county tax records.
Cash-flow waterfall
monthlySold comps — $/sqft
last 12 mo · ≤1 miLoading sold comps…