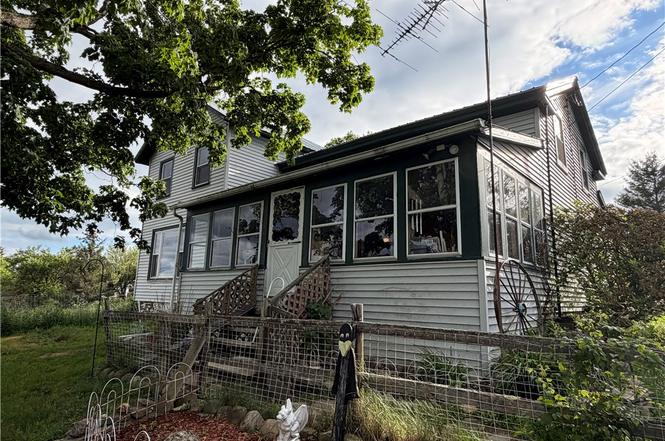
1211 Demunn Rd · Montour Falls, NY
Flood risk 1/10 · Minimal
- FEMA flood zone
- X
- Chance of flooding over 30 yrs
- 0.0%
- Est. flood insurance / yr
- $473 – $860
Fire risk 4/10 · Minor
- Est. fire insurance / yr
- $691 – $1,283
Heat risk 2/10 · Minimal
- Hot days now (above 93°F)
- 7 days/yr
- Hot days in 30 yrs
- 15 days/yr
Wind risk 1/10 · Minimal
- Chance of severe wind over 30 yrs
- 1.0%
Air-quality risk 1/10 · Minimal
- Unhealthy air days now
- 0 days/yr
- Unhealthy air days in 30 yrs
- 0 days/yr
Risk factors via First Street. Map © Google.
Why this score? — see what drove the D grade
The composite is a weighted blend of 9 inputs, each scored 0–100. Each bar is that input's sub-score; the figure is the points it added to the 100-point composite (weight × sub-score).
- Cash flow +9.6/30.0
- Appreciation +8.5/10.0
- ARV discount +7.5/15.0
- Schools +3.8/10.0
- Livability +3.2/5.0
- 1% rule +2.9/10.0
- DSCR +2.7/10.0
- Rent growth +2.5/5.0
- Condition / age +2.5/5.0
$149,900
🖨 Deal sheet 📄 Offer letter ✓ Due diligence
Listing remarks
This quintessential farmhouse has not been on the market for 50 years and is ready to raise its next family! The country kitchen is spacious and open to the dining room which features two large picture windows where you can watch the wildlife or enjoy the distant hillside views. There is also a good size living room, full bath, dedicated laundry room and bedroom/den on the first floor. Upstairs there are 3 bedrooms, two are quite large and the big landing could be made into office or craft space! There are two enclosed porches, front porch has lots of windows and is perfect for relaxing, the back porch is a good spot for extra storage. If you've always wanted chickens the coop is already th
Key facts
- Country kitchen
- Enclosed porches
- Mature fruit trees
Tags
Property features AI
Exterior
- Parking: No garage
- Utilities: Electricity connected; Cable available; High-speed internet available; Well water; Septic tank
- Home design: Two-story home; Existing (previously built) structure
- Construction: Cedar and wood siding; Metal and shingle roof; Stone foundation
- Exterior features: Partial fencing; Fence; Gravel driveway; Leased propane tank; Poultry coop
Interior
- Kitchen: Gas oven and gas range; Refrigerator
- Bedrooms: One bedroom on the main level
- Flooring: Hardwood; Carpet; Varies
- Bathrooms: One full bathroom (on main level)
- Heating & cooling: Gas forced-air heating
- Interior features: Separate/formal living room; Country-style kitchen; Partial basement
- Laundry & utility: Main level laundry
Neighborhood map
What this means for you Summary
Snapshot
- This is a 2-bed/1.0-bath single-family listed at $150k.
Deal economics
- At list price, monthly cash flow is $-101 ($-1k/yr) — negative.
- To cash-flow at today's rent, offer at most $132k (11.9% below list).
- To meet the 1% rule (rent ≥ 1% of price), the offer needs to be $118k (21.5% below list).
- Recommended offer: $118k (21.5% below list) — sets the bar for 1% rule.
Location & tenants
- Location reads 63/100 on livability (#786 in NY) — a middle-class / working-renter tenant base. Strengths: cost of living A+, crime A-, housing B+; Watch: health & safety D, schools F, amenities F.
- Watkins Glen Central School District (town): math 42% / reading 46% proficiency, ranked #472 of 590 in NY (top 80%) — families likely to look elsewhere, expect single-tenant / working-renter base with shorter leases.
- Market conditions: 16 active listings in the ZIP; 52 units permitted in Schuyler County in 2024 (0 in 5+ unit buildings).
Forward outlook
- In year one you build about $12k of equity ($1k loan paydown + $11k appreciation (7.0% local appreciation)).
- Schuyler County population projected at -15% by 2050 — secular population decline; favor cash flow + early exit over multi-decade hold.
- By year 4, paydown + projected appreciation supports a ~$40k cash-out refi (75% LTV) — recoverable capital for the next deal without selling this one.
Negotiation context
- Only 3 days on market — expect competitive offers; lowballing is unlikely to land.
Risks & watch-outs
- Watch-outs: built in 1850 — expect roof / HVAC / electrical / plumbing capex.
Questions for the listing agent
- What do current leases actually rent for vs. the listed asking? Can we see a recent rent roll and the last 12 months of T-12 income?
- Built in 1850 — when were the roof, HVAC, electrical panel, plumbing, and water heater last replaced?
- Is there a deadline driving the sale (1031 exchange, divorce, estate, relocation)? That informs how much negotiation room exists.
- Schools are F-rated, which usually means shorter tenancies and higher turnover. Who's the typical renter profile here, and what's been the actual vacancy rate?
- The area grade is low — what's the realistic commute time and amenity access for the typical tenant pool here? Any planned neighborhood developments (good or bad) we should know about?
- What's the average days-on-market for RENTAL listings here right now (not sales)? A rising rental-DOM trend means longer vacancies and softer asking-rent achievability than the comps imply.
- What's the recent tenant-quality profile in this submarket — average credit score on applications, eviction rate, late-payment / NSF rate, and stable-employment percentage? A property-management company in the area should have these aggregated.
- How much new for-sale + rental construction is in the pipeline within 1–3 miles? Heavy new supply typically softens prices + rents 12–24 months out; constrained supply supports both.
Investment metrics
- 1% rule
- 0.79% ✗
- Cap rate
- 5.48%
- Cash-on-cash
- -2.90%
- DSCR
- 0.87
- GRM
- 10.6
CMA / ARV
No comps found within radius.
Projected returns pro-forma
7.05% appreciation · 3.0% rent growth · sell at horizon
- IRR
- 15.6%
- Equity multiple
- 2.11×
- Total profit
- $46,389
- Equity at exit
- $104,392
- IRR
- 15.4%
- Equity multiple
- 4.33×
- Total profit
- $139,648
- Equity at exit
- $198,766
Cash invested: $41,972 (down + closing). Projections, not guarantees.
Landlord ↔ Tenant lean methodology
- Overall (STATE)
- 15 Strongly Tenant-Friendly
- State New York
- 15 Strongly Tenant-Friendly · D+10
- County
- — inherits STATE
- City
- — inherits STATE
ZIP-level market 14812
- Home prices YoY
- 2.6%
- Active inventory
- 16
- Price-to-rent
- 10.6×
Monthly cashflow live
- Estimated rent
- $1,177 medium interval (Pro) →
- Mortgage (P&I)
- −$786
- Tax from tax record
- −$183 /mo · $2,195/yr
- Insurance
- −$62
- HOA
- −$0
- Vacancy / Maint / Mgmt
- −$247
- Net cashflow
- $-101
Break-even live
UW: 25.0% down · 7.5% · 30yr · 1.5% tax · 5.0% vac · 8.0% maint · 8.0% mgmt
Financing live
Cash to close
- Down payment
- $37,475
- Closing costs
- $4,497
- Reserves months
- —
- Total cash needed
- —
Loan-product check · same deal, 3 products live
Conventional
25% down · 7.5% · 30yr
- Down + closing
- —
- Monthly P&I
- —
- Monthly cashflow
- —
- DSCR
- —
- Eligible?
- —
Personal DTI + credit; lowest rate.
DSCR
20% down · 8.5% · 30yr
- Down + closing
- —
- Monthly P&I
- —
- Monthly cashflow
- —
- DSCR
- —
- Eligible?
- —
No personal income docs; deal must DSCR.
Hard money
10% down · 12.0% · 12mo
- Down + closing
- —
- Monthly P&I
- —
- Monthly cashflow
- —
- DSCR
- —
- Eligible?
- —
Short-term bridge; refi at stabilization.
Listing history 4 events
-
2026-06-18days on market $149,900 Active 3 DOM
-
2026-06-17days on market $149,900 Active 2 DOM
-
2026-06-16remarks 699-char remark
-
2026-06-16$149,900 Active 1 DOM
ⓘ Source: listings_history table (triggers on properties + properties_extension) + one-shot
backfill from property_details.listing_events for pre-trigger history.
Tax reassessment forecast NY · Partial reset (capped growth)
- Current annual tax
- $2,195 · $183/mo
- Projected year-2 tax
- $2,364 · $197/mo
- Expected delta
- +$169/yr (+$14/mo · 7.7%)
ⓘ Screening estimate from a state-policy table — verify with the county assessor before closing.
Climate risk First Street
- Flood 1/10 Low FEMA zone X · 0% chance over 30 yrs
- Wildfire 4/10 Moderate
- Heat 2/10 Low 7 d/yr ≥93°F today · 15 d/yr by 30 yrs out
- Wind 1/10 Low 100% chance of damaging wind over 30 yrs
- Air quality 1/10 Low 0 unhealthy d/yr today · 0 by 30 yrs out
Nearby sold comps map
Loading sold comps map…
Walkable amenities ~0.75 mi
Loading nearby amenities…
Taxation est. · year 1
- Rental income
- $14,128
- − Mortgage interest
- −$8,397
- − Property taxes
- −$2,195
- − Insurance
- −$750
- − Repairs & maintenance
- −$1,130
- − Management
- −$1,130
- − Depreciation
- −$4,361
- Taxable loss
- −$3,834
- Est. tax savings @ 24.0%
- +$920
- After-tax cash flow
- $-296/yr
For passive investors: Depreciation is non-cash, so a rental often shows a tax loss while cash-flowing — sheltering income. Rental losses are passive: they offset passive income freely, and up to $25,000/yr can offset ordinary (W-2) income if you actively participate and your MAGI is under $100k (phasing out to $0 by $150k); unused losses carry forward. On sale, claimed depreciation is recaptured at up to 25%, and gains may owe capital-gains tax (a 1031 exchange can defer both). Figures are a year-1 estimate at your 24.0% rate — not tax advice; consult a CPA.
Schools (NCES district)
- District
- Watkins Glen Central School District
- NCES district ID
- 3630240
- Math proficiency
- 42% ▼ -6.00%
- Reading proficiency
- 46% ▼ -2.00%
- Median HH income
- $47,157
- Composite
- 37.53/100
- National rank
- #4395
- State rank
- #472 of 590 in NY
Livability — Montour Falls
- Score
- 63/100
- State rank
- #786
- US rank
- #15104
Category grades
Schools grade is shown separately in the Schools card above.
Census & demographics
- Population (ZIP)
- 2,961
Population outlook (Schuyler County) Hauer SSP2
- Today (2025)
- 17,999 people
- By 2030
- 17,676 · -1.8%
- By 2040
- 16,586 · -7.9%
- By 2050
- 15,322 · -14.9%
- By 2075
- 13,004 · -27.8%
- By 2100
- 10,752 · -40.3%
Race, ethnicity, and origin ACS 2023
- Neighborhood character
- Predominantly White (91%)
- Race & ethnicity
- White 91% Two or more races 4% Hispanic / Latino 4%
- Common ancestry
- Iranian 4% Romanian 3% Italian 2%
- Foreign-born
- 2% · Canada, Dominican Republic
- Languages at home
- 97% English-only · Spanish 2% German/W. Germanic 1%
Political lean MEDSL · Schuyler
- 2024 margin
- Strong R (+21.0) · D 39.5% · R 60.5%
- 2008→2024 swing
- -13.9pp toward R · 2008: -7.1pp · 2024: -21.0pp
- All cycles
- 2024: R+21.0 2020: R+17.6 2016: R+28.7 2012: R+7.9 2008: R+7.1
Not yet ingested
- Civics
- —
Market trends
- HPI YoY
- ▲ 7.05%
- Current HPI
- 276.1726
- Rent YoY
- —
- Metro
- —
- State GDP YoY
- ▲ 2.60%
- F500 in state
- 92
Industry mix (Fortune 500 HQ in NY)
| Industry | F500 HQs | Revenue |
|---|---|---|
| Financial Services | 10 | $950B |
|
||
| Consumer Goods | 9 | $162B |
|
||
| Insurance | 4 | $225B |
|
||
| Telecommunications | 2 | $144B |
|
||
| Pharmaceuticals | 2 | $112B |
|
||
| Media / Entertainment | 2 | $69B |
|
||
Price history
1 event — show timeline
- 2026-06-15 Listed $149,900 UNYREIS
Property tax history
+10.0%/yrLatest (2025): $2,195 · +1.8% YoY. Source: county tax records.
Cash-flow waterfall
monthlySold comps — $/sqft
last 12 mo · ≤1 miLoading sold comps…