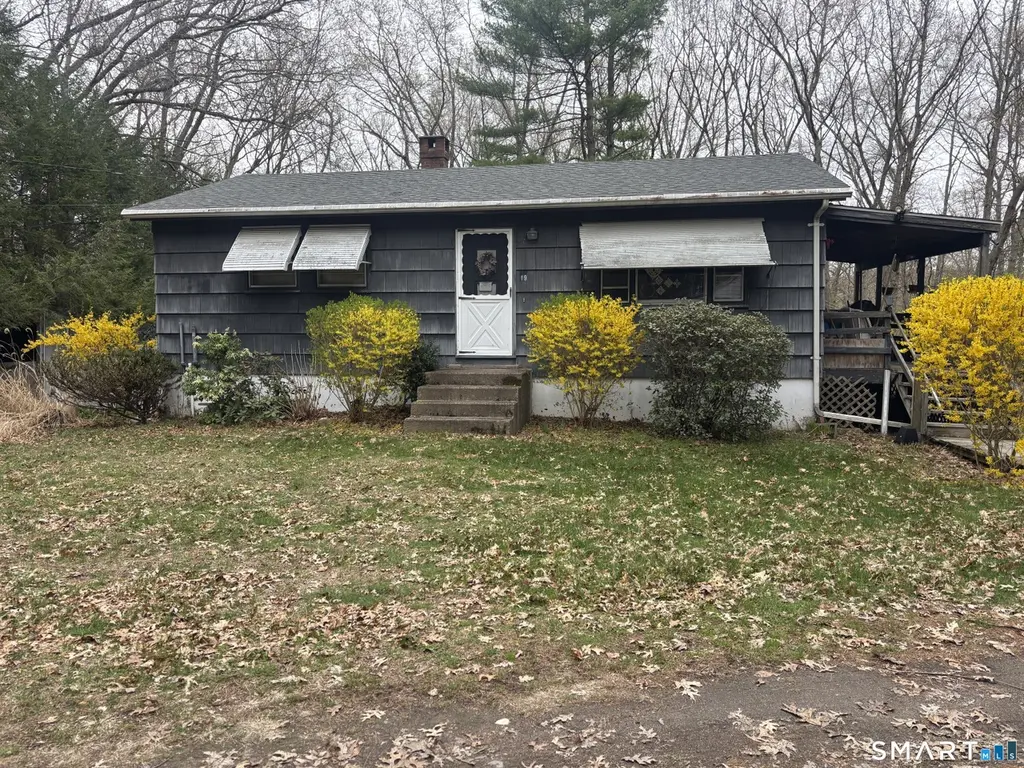
19 Henry Pl · Willimantic, CT
Flood risk 1/10 · Minimal
- FEMA flood zone
- X
- Chance of flooding over 30 yrs
- 0.0%
- Est. flood insurance / yr
- $473 – $860
Fire risk 2/10 · Minimal
- Est. fire insurance / yr
- $829 – $1,539
Heat risk 4/10 · Minor
- Hot days now (above 96°F)
- 7 days/yr
- Hot days in 30 yrs
- 14 days/yr
Wind risk 6/10 · Moderate
- Chance of severe wind over 30 yrs
- 53.0%
Air-quality risk 3/10 · Minor
- Unhealthy air days now
- 3 days/yr
- Unhealthy air days in 30 yrs
- 4 days/yr
Risk factors via First Street. Map © Google.
Why this score? — see what drove the C+ grade
The composite is a weighted blend of 9 inputs, each scored 0–100. Each bar is that input's sub-score; the figure is the points it added to the 100-point composite (weight × sub-score).
- Cash flow +23.3/30.0
- DSCR +7.5/10.0
- ARV discount +7.5/15.0
- 1% rule +7.3/10.0
- Appreciation +4.9/10.0
- Livability +4.2/5.0
- Rent growth +2.5/5.0
- Condition / age +2.5/5.0
- Schools +1.7/10.0
$135,000
🖨 Deal sheet 📄 Offer letter ✓ Due diligence
Listing remarks
Tucked at the very end of a dead-end road, this oversized 2+ acre property offers privacy, space, and serious potential. This 2-bedroom, 1-bath ranch is paired with a large 2-car garage (at one time converted to a living space) and is ready for someone with vision to bring it back to life. CASH BUYERS ONLY-this is a true handyman special. Roof was replaced on house and garage less than 3 years ago. Property will be conveyed with most of contents, including multiple metal trailers, sheds, and more. Any and all junk removal will convey to the buyer. A rare opportunity in an awesome location to create something special. Offers will be due Sunday 4/26 by 6pm.
Key facts
- 2.5 acre lot
- 2 garage spots
- Built 1968
Neighborhood map
What this means for you Summary
Snapshot
- This is a 2-bed/1.0-bath single-family listed at $135k.
Deal economics
- At list price, monthly cash flow is $246 ($3k/yr) — positive.
- The deal already cash-flows at list — no discount required.
- Meets the 1% rule at list price ($2k rent vs $135k).
- Cap rate 8.5% vs local median 4.6% in Willimantic — top-decile yield for the area; either an underpriced asset or a hidden risk that comps aren't pricing in. Stress-test before assuming the spread holds.
Location & tenants
- Location reads 85/100 on livability (#3 in CT, #487 nationally) — a professional / high-income tenant draw. Strengths: amenities A+, commute A+, cost of living A+; Watch: schools D+, employment F.
- Windham School District (town): math 15% / reading 25% proficiency, ranked #143 of 153 in CT (top 94%) — low school quality limits family demand, transient renter base, plan for 1-2y turnover; 68% free/reduced lunch — lower-income household profile, screen leases tightly.
- Market conditions: 18 active listings in the ZIP; 3 comparable units currently listed for rent nearby; rentals leasing fast (median 2d on market — plan ~1-2 weeks tenant-placement turnaround); 487 units permitted in Southeastern Connecticut Planning Region in 2024 (244 in 5+ unit buildings).
Forward outlook
- In year one you build about $737 of equity ($933 loan paydown + $-196 appreciation (-0.1% local appreciation)).
- At projected returns (-0.1% appreciation + 3.0% rent growth), your $38k cash investment doubles in ~8 years — after that, you're playing with house money.
Negotiation context
- Only 5 days on market — expect competitive offers; lowballing is unlikely to land.
Risks & watch-outs
- Watch-outs: property tax is 2.7% of price.
- Climate carrying-cost: major wind risk, 53% chance of damaging wind over 30y — expect insurance premiums to compound above CPI over the hold.
Questions for the listing agent
- Built in 1968 — when were the roof, HVAC, electrical panel, plumbing, and water heater last replaced?
- Property tax is high relative to price — has the assessment been appealed recently, and will the sale trigger a re-assessment?
- Is there a deadline driving the sale (1031 exchange, divorce, estate, relocation)? That informs how much negotiation room exists.
- Schools are D-rated, which usually means shorter tenancies and higher turnover. Who's the typical renter profile here, and what's been the actual vacancy rate?
- What's the average days-on-market for RENTAL listings here right now (not sales)? A rising rental-DOM trend means longer vacancies and softer asking-rent achievability than the comps imply.
- What's the recent tenant-quality profile in this submarket — average credit score on applications, eviction rate, late-payment / NSF rate, and stable-employment percentage? A property-management company in the area should have these aggregated.
- How much new for-sale + rental construction is in the pipeline within 1–3 miles? Heavy new supply typically softens prices + rents 12–24 months out; constrained supply supports both.
Investment metrics
- 1% rule
- 1.23% ✓
- Cap rate
- 8.48%
- Cash-on-cash
- 7.81%
- DSCR
- 1.35
- GRM
- 6.8
CMA / ARV
- ARV (on-the-fly)
- $60,480
- Comps found
- 9
Show comp detail 9 sales within ~0.75 mi
| Address | Dist | Beds/Ba | Sqft | Sold | Price | $/sf | Match |
|---|---|---|---|---|---|---|---|
| 19 Henry Pl | 0.00mi | 2/1.0 | 864 (0%) | 0mo | $166,000 | $192 | 100 |
| 17 Green Ln | 0.44mi | 2/1.0 | 924 (+7%) | 17mo | $15,500 | $17 | 54 |
| 337 Tuckie Rd | 0.33mi | 3/2.0 (+1) | 924 (+7%) | 13mo | $57,000 | $62 | 53 |
| 339 Tuckie Rd | 0.34mi | 2/1.0 | 956 (+11%) | 21mo | $50,000 | $52 | 49 |
| 9 Fairway Dr | 0.46mi | 2/2.0 | 924 (+7%) | 18mo | $65,000 | $70 | 48 |
| 363 Tuckie Rd | 0.43mi | 3/2.0 (+1) | 960 (+11%) | 8mo | $142,000 | $148 | 45 |
| 15 James Dr | 0.74mi | 2/1.0 | 924 (+7%) | 13mo | $79,000 | $85 | 43 |
| 381 Tuckie Rd | 0.50mi | 3/2.0 (+1) | 960 (+11%) | 22mo | $75,000 | $78 | 30 |
| 13 Stonegate Dr | 0.71mi | 3/1.5 (+1) | 924 (+7%) | 24mo | $60,000 | $65 | 29 |
Match score weights: distance 35% · size 25% · config 20% · recency 20%. Top-matched comps best support the ARV.
Projected returns pro-forma
-0.14% appreciation · 3.0% rent growth · sell at horizon
- IRR
- 6.1%
- Equity multiple
- 1.29×
- Total profit
- $10,901
- Equity at exit
- $38,224
- IRR
- 11.5%
- Equity multiple
- 2.24×
- Total profit
- $46,769
- Equity at exit
- $45,175
Cash invested: $37,800 (down + closing). Projections, not guarantees.
Landlord ↔ Tenant lean methodology
- Overall (STATE)
- 27 Tenant-Leaning
- State Connecticut
- 27 Tenant-Leaning · D+7
- County
- — inherits STATE
- City
- — inherits STATE
ZIP-level market 06256
- Home prices YoY
- -0.1%
- Active inventory
- 18
- Price-to-rent
- 6.8×
Monthly cashflow live
- Estimated rent
- $1,657 medium interval (Pro) →
- Mortgage (P&I)
- −$708
- Tax from tax record
- −$299 /mo · $3,585/yr
- Insurance
- −$56
- HOA
- −$0
- Vacancy / Maint / Mgmt
- −$348
- Net cashflow
- $246
Break-even live
UW: 25.0% down · 7.5% · 30yr · 1.5% tax · 5.0% vac · 8.0% maint · 8.0% mgmt
Financing live
Cash to close
- Down payment
- $33,750
- Closing costs
- $4,050
- Reserves months
- —
- Total cash needed
- —
Loan-product check · same deal, 3 products live
Conventional
25% down · 7.5% · 30yr
- Down + closing
- —
- Monthly P&I
- —
- Monthly cashflow
- —
- DSCR
- —
- Eligible?
- —
Personal DTI + credit; lowest rate.
DSCR
20% down · 8.5% · 30yr
- Down + closing
- —
- Monthly P&I
- —
- Monthly cashflow
- —
- DSCR
- —
- Eligible?
- —
No personal income docs; deal must DSCR.
Hard money
10% down · 12.0% · 12mo
- Down + closing
- —
- Monthly P&I
- —
- Monthly cashflow
- —
- DSCR
- —
- Eligible?
- —
Short-term bridge; refi at stabilization.
Rent comps 3 comps
| Address | Beds | Baths | Sqft | Rent | $/sqft | DOM | Units | Dist |
|---|---|---|---|---|---|---|---|---|
| 82 Boston Post Rd Unit A1 North Windham, CT | 1.0 | 1.0 | 700 | $1,600 | $2.29 | 14d | 1 | 0.82mi |
| 84 Ash St Willimantic, CT | 2.0 | 1.0 | 900 | $1,600 | $1.78 | 1d | 1 | 1.44mi |
| 145 Foster Dr Willimantic, CT | 2.0 | 1.0–1.5 | 687 | $1,830 | $2.66 | 1d | 1 | 1.46mi |
Listing history 4 events
-
2026-04-28status Under Contract
-
2026-04-24$135,000 Active
-
2026-04-18historical $135,000
-
1990-06-15soldstatus $128,500
ⓘ Source: listings_history table (triggers on properties + properties_extension) + one-shot
backfill from property_details.listing_events for pre-trigger history.
Tax reassessment forecast CT · Partial reset (capped growth)
- Current annual tax
- $3,585 · $299/mo
- Projected year-2 tax
- $3,585 · $299/mo
- Expected delta
- $0/yr ($0/mo · 0.0%)
ⓘ Screening estimate from a state-policy table — verify with the county assessor before closing.
Climate risk First Street
- Flood 1/10 Low FEMA zone X · 0% chance over 30 yrs
- Wildfire 2/10 Low
- Heat 4/10 Moderate 7 d/yr ≥96°F today · 14 d/yr by 30 yrs out
- Wind 6/10 Major 53% chance of damaging wind over 30 yrs
- Air quality 3/10 Moderate 3 unhealthy d/yr today · 4 by 30 yrs out
Nearby sold comps map
Loading sold comps map…
Walkable amenities ~0.75 mi
Loading nearby amenities…
Taxation est. · year 1
- Rental income
- $19,882
- − Mortgage interest
- −$7,562
- − Property taxes
- −$3,585
- − Insurance
- −$675
- − Repairs & maintenance
- −$1,591
- − Management
- −$1,591
- − Depreciation
- −$3,927
- Taxable income
- $951
- Est. tax owed @ 24.0%
- −$228
- After-tax cash flow
- $2,723/yr
For passive investors: Depreciation is non-cash, so a rental often shows a tax loss while cash-flowing — sheltering income. Rental losses are passive: they offset passive income freely, and up to $25,000/yr can offset ordinary (W-2) income if you actively participate and your MAGI is under $100k (phasing out to $0 by $150k); unused losses carry forward. On sale, claimed depreciation is recaptured at up to 25%, and gains may owe capital-gains tax (a 1031 exchange can defer both). Figures are a year-1 estimate at your 24.0% rate — not tax advice; consult a CPA.
Schools (NCES district)
- District
- Windham School District
- NCES district ID
- 0905190
- Math proficiency
- 15% ▼ -16.00%
- Reading proficiency
- 25% ▼ -12.00%
- Median HH income
- $40,956
- Composite
- 17.01/100
- National rank
- #9128
- State rank
- #143 of 153 in CT
Livability — Willimantic
- Score
- 85/100
- State rank
- #3
- US rank
- #487
Category grades
Schools grade is shown separately in the Schools card above.
Census & demographics
- City population
- 19,344
- Population (ZIP)
- 1,796
Population outlook (Southeastern Connecticut County) Hauer SSP2
- By 2040
- 293,442
Race, ethnicity, and origin ACS 2023
- Neighborhood character
- Predominantly White (82%)
- Race & ethnicity
- White 82% Hispanic / Latino 15% Two or more races 4% Black 1%
- Hispanic origin (detail)
- Mexican 9% Puerto Rican 5%
- Common ancestry
- Romanian 18% Lithuanian 11% Russian 2%
- Foreign-born
- 4% · Canada
- Languages at home
- 87% English-only · Spanish 10% German/W. Germanic 2%
Political lean MEDSL · Southeastern Connecticut
- 2024 margin
- D (+13.0) · D 55.6% · R 42.6% · Other 1.8%
- All cycles
- 2024: D+13.0
Not yet ingested
- Civics
- —
Market trends
- HPI YoY
- ▼ -0.14%
- Current HPI
- 269.7593
- Rent YoY
- —
- Metro
- —
- State GDP YoY
- ▲ 1.06%
- F500 in state
- 38
Industry mix (Fortune 500 HQ in CT)
| Industry | F500 HQs | Revenue |
|---|---|---|
| Industrial Machinery | 4 | $38B |
|
||
| Insurance | 3 | $71B |
|
||
| Financial Services | 2 | $25B |
|
||
| Transportation / Logistics | 2 | $18B |
|
||
| Healthcare | 1 | $247B |
|
||
| Telecommunications | 1 | $55B |
|
||
Price history
+5.1% since first listed4 events — show timeline
- 2026-04-28 Pending — Smart MLS
- 2026-04-24 Listed $135,000 Smart MLS
- 2026-04-18 Coming Soon $135,000 Smart MLS
- 1990-06-15 Sold (Public Records) $128,500 Public Records
Property tax history
+1.5%/yrLatest (2023): $3,585 · +2.6% YoY. Source: county tax records.
Cash-flow waterfall
monthlySold comps — $/sqft
last 12 mo · ≤1 miLoading sold comps…