8822 E Florida Ave Apt G07 · Four Square Mile, CO
Flood risk 1/10 · Minimal
- FEMA flood zone
- X (unshaded)
- Chance of flooding over 30 yrs
- 0.0%
- Est. flood insurance / yr
- $507 – $1,088
Fire risk 1/10 · Minimal
- Est. fire insurance / yr
- $939 – $1,743
Heat risk 3/10 · Minor
- Hot days now (above 93°F)
- 7 days/yr
- Hot days in 30 yrs
- 18 days/yr
Wind risk 2/10 · Minimal
- Chance of severe wind over 30 yrs
- —
Air-quality risk 4/10 · Minor
- Unhealthy air days now
- 4 days/yr
- Unhealthy air days in 30 yrs
- 6 days/yr
Risk factors via First Street. Map © Google.
Why this score? — see what drove the C grade
The composite is a weighted blend of 9 inputs, each scored 0–100. Each bar is that input's sub-score; the figure is the points it added to the 100-point composite (weight × sub-score).
- Cash flow +23.6/30.0
- 1% rule +9.1/10.0
- DSCR +7.6/10.0
- ARV discount +7.5/15.0
- Schools +4.4/10.0
- Livability +2.5/5.0
- Condition / age +2.5/5.0
- Rent growth +1.4/5.0
- Appreciation +0.0/10.0
$80,000
🖨 Deal sheet 📄 Offer letter ✓ Due diligence
Listing remarks
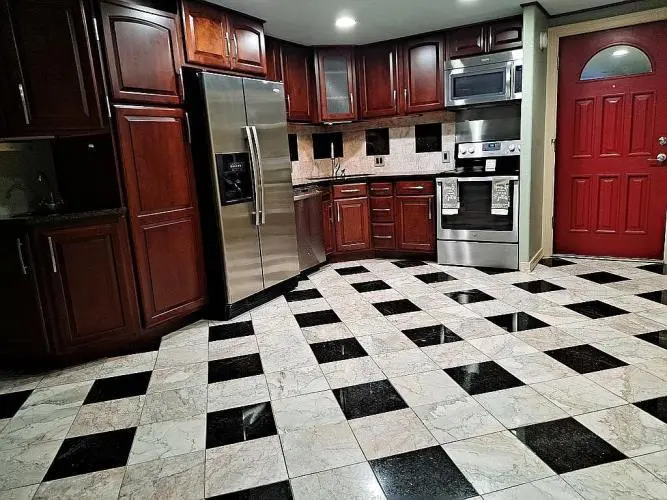
This Lovely Garden-Level Condo has been Extensively Upgraded. .. Everything NEW. .. Lusciously Appointed & amp; Luxuriously Upgraded!! All Counter Tops, Appliances, Back-Splashes, Tub Surround. .. Even the Window Sills. .. Are Either Granite, Marble, Stainless Steel Or Glass. This unit is just Soooooooo Much Nicer than Other Units in the complex. This Condo is Very Quiet and Comfortable. With all of the Hard Surfaces, it can be quickly and Easily Cleaned and Sterilized! It is Very Low Maintenance, Very Efficient and Very Environmentally Green. Utilities for this Condo are only about $40 per month. .. year round. .. and that& apos; s pretty darn cheap! The Condo Complex has the follo
Key facts
- Separate indoor pool
- Outdoor pool
- Hot tub
Tags
Neighborhood map
What this means for you Summary
Snapshot
- This is a 1-bed/1.0-bath condo listed at $80k.
Deal economics
- At list price, monthly cash flow is $150 ($2k/yr) — positive.
- The deal already cash-flows at list — no discount required.
- Meets the 1% rule at list price ($1k rent vs $80k).
- Recommended offer: $79k (1.5% below list) — sets the bar for market timing.
- Cap rate 8.5% vs local median 2.8% in Four Square Mile — top-decile yield for the area; either an underpriced asset or a hidden risk that comps aren't pricing in. Stress-test before assuming the spread holds.
Location & tenants
- Location reads: area grade C — affects rentability + tenant quality, not the cash-flow math above.
- Cherry Creek School District No. 5 In The County Of Arapah (urban): math 40% / reading 58% proficiency, ranked #11 of 86 in CO (top 13%) — families likely to look elsewhere, expect single-tenant / working-renter base with shorter leases.
- Market conditions: Rents falling (-4.4%/yr); 72 active listings in the ZIP; 35 comparable units currently listed for rent nearby; rentals leasing fast (median 3d on market — plan ~1-2 weeks tenant-placement turnaround); 3,927 units permitted in Arapahoe County in 2024 (1,525 in 5+ unit buildings).
Forward outlook
- Local home prices are declining (-3.0%/yr); year-one equity from $553 of loan paydown is wiped out by about $2k of value loss. Plan a longer hold.
- Arapahoe County population projected at +39% by 2050 — long-run rental-demand tailwind backs the buy-and-hold thesis.
Negotiation context
- It's been on market 19 days — a 2% lower offer ($79k) is reasonable based on typical stale-listing flexibility.
- 3 sale attempts with the ask held roughly flat each time — persistent listings suggest the price (not the market) is what's stuck; bring a comps-based counter.
Questions for the listing agent
- Built in 1973 — when were the roof, HVAC, electrical panel, plumbing, and water heater last replaced?
- What does the HOA fee cover, when was the last increase, and are there any pending special assessments or reserve-fund shortfalls?
- Any open or pending special assessments — roof, HVAC, plumbing, elevator, façade? What's the per-unit balance and payoff schedule, and is the seller paying it off at close or rolling it to the buyer?
- Is there a deadline driving the sale (1031 exchange, divorce, estate, relocation)? That informs how much negotiation room exists.
- What's the average days-on-market for RENTAL listings here right now (not sales)? A rising rental-DOM trend means longer vacancies and softer asking-rent achievability than the comps imply.
- What's the recent tenant-quality profile in this submarket — average credit score on applications, eviction rate, late-payment / NSF rate, and stable-employment percentage? A property-management company in the area should have these aggregated.
- How much new apartment / multifamily construction is in the pipeline within 1–3 miles? Heavy new supply (>2% of stock underway) typically softens rents 12–24 months out; light construction supports rent growth.
Investment metrics
- 1% rule
- 1.41% ✓
- Cap rate
- 8.55%
- Cash-on-cash
- 8.05%
- DSCR
- 1.36
- GRM
- 5.9
CMA / ARV
No comps found within radius.
Projected returns pro-forma
-3.0% appreciation · 0.0% rent growth · sell at horizon
- IRR
- -8.3%
- Equity multiple
- 0.71×
- Total profit
- $-6,569
- Equity at exit
- $11,928
- IRR
- -4.6%
- Equity multiple
- 0.75×
- Total profit
- $-5,644
- Equity at exit
- $6,917
Cash invested: $22,400 (down + closing). Projections, not guarantees.
Landlord ↔ Tenant lean methodology
- Overall (STATE)
- 38 Tenant-Leaning
- State Colorado
- 38 Tenant-Leaning · D+4
- County
- — inherits STATE
- City
- — inherits STATE
ZIP-level market 80247
- Home prices YoY
- -29.2%
- Rents YoY
- -4.4%
- Active inventory
- 72
- Price-to-rent
- 5.9×
Monthly cashflow live
- Estimated rent
- $1,129 high interval (Pro) →
- Mortgage (P&I)
- −$420
- Tax from tax record
- −$71 /mo · $849/yr
- Insurance
- −$33
- HOA est. from 2 same-building comps
- −$218
- Vacancy / Maint / Mgmt
- −$237
- Net cashflow
- $150
Break-even live
UW: 25.0% down · 7.5% · 30yr · 1.5% tax · 5.0% vac · 8.0% maint · 8.0% mgmt
Financing live
Cash to close
- Down payment
- $20,000
- Closing costs
- $2,400
- Reserves months
- —
- Total cash needed
- —
Loan-product check · same deal, 3 products live
Conventional
25% down · 7.5% · 30yr
- Down + closing
- —
- Monthly P&I
- —
- Monthly cashflow
- —
- DSCR
- —
- Eligible?
- —
Personal DTI + credit; lowest rate.
DSCR
20% down · 8.5% · 30yr
- Down + closing
- —
- Monthly P&I
- —
- Monthly cashflow
- —
- DSCR
- —
- Eligible?
- —
No personal income docs; deal must DSCR.
Hard money
10% down · 12.0% · 12mo
- Down + closing
- —
- Monthly P&I
- —
- Monthly cashflow
- —
- DSCR
- —
- Eligible?
- —
Short-term bridge; refi at stabilization.
Rent comps 35 comps
| Address | Beds | Baths | Sqft | Rent | $/sqft | DOM | Units | Dist |
|---|---|---|---|---|---|---|---|---|
| 8822 E Florida Ave Denver, CO | 1.0 | 1.0 | 598 | $1,048 | $1.75 | 5d | 2 | 0.01mi |
| 8822 E Florida Ave Denver, CO | 1.0 | 1.0 | 598 | $772 | $1.29 | 21d | 2 | 0.01mi |
| 8822 E Florida Ave #112 Denver, CO | 1.0 | 1.0 | 598 | $1,095 | $1.83 | 19d | 1 | 0.01mi |
| 8828 E Florida Ave #117 Denver, CO | 1.0 | 1.0 | 600 | $950 | $1.58 | 5d | 1 | 0.05mi |
| 8824 E Florida Ave Denver, CO | 1.0 | 1.0 | 599 | $972 | $1.62 | 2d | 4 | 0.06mi |
| 8826 E Florida Ave Denver, CO | 1.0–2.0 | 1.0–2.0 | 728 | $1,000 | $1.37 | 24d | 3 | 0.07mi |
| 8826 E Florida Ave #207 Denver, CO | 1.0 | 1.0 | 598 | $1,000 | $1.67 | 5d | 1 | 0.09mi |
| 9110 E Florida Ave Denver, CO | 1.0–3.0 | 1.0–2.0 | 940 | $1,385 | $1.47 | 1d | 63 | 0.22mi |
| 9510 E Florida Ave Unit 1 Denver, CO | 1.0 | 1.0 | 705 | $1,050 | $1.49 | 2d | 1 | 0.46mi |
| 1302 S Parker Rd Denver, CO | 1.0 | 1.0 | 615 | $1,075 | $1.75 | 24d | 3 | 0.50mi |
| 1302 S Parker Rd #128 Denver, CO | 1.0 | 1.0 | 600 | $950 | $1.58 | 14d | 1 | 0.50mi |
| 1304 S Parker Rd Denver, CO | 1.0 | 1.0 | 612 | $1,025 | $1.67 | 17d | 3 | 0.52mi |
| 1304 S Parker Rd Denver, CO | 1.0 | 1.0 | 612 | $1,025 | $1.67 | 5d | 3 | 0.52mi |
| 1306 S Parker Rd Denver, CO | 1.0 | 1.0 | 612 | $1,088 | $1.78 | 16d | 3 | 0.55mi |
| 1306 S Parker Rd #164 Denver, CO | 1.0 | 1.0 | 600 | $1,175 | $1.96 | 24d | 1 | 0.55mi |
| 1939 S Quebec Way Denver, CO | 1.0–2.0 | 1.0–2.0 | 843 | $1,274 | $1.51 | 1d | 24 | 0.62mi |
| 1749 S Dayton St Denver, CO | 1.0–3.0 | 1.0–2.0 | 876 | $1,251 | $1.43 | 2d | 6 | 0.62mi |
| 9900 E Florida Ave Aurora, CO | 1.0 | 1.0 | 560 | $1,095 | $1.96 | 2d | 9 | 0.67mi |
| 9767 E Colorado Ave Aurora, CO | 1.0–2.0 | 1.0–2.0 | 804 | $1,147 | $1.43 | 2d | 7 | 0.73mi |
| 1250 S Dayton Ct Aurora, CO | 1.0–3.0 | 1.0–2.0 | 1040 | $1,462 | $1.41 | 1d | 44 | 0.74mi |
| 9758 E Colorado Ave Aurora, CO | 1.0–2.0 | 1.0–1.5 | 858 | $1,200 | $1.40 | 3d | 12 | 0.76mi |
| 7575 E Arkansas Ave Denver, CO | 1.0–2.0 | 1.0–2.0 | 812 | $950 | $1.17 | 1d | 31 | 0.82mi |
| 1503 S Galena Way Aurora, CO | 1.0–2.0 | 1.0–2.0 | 850 | $1,289 | $1.52 | 2d | 31 | 0.87mi |
| 1355 S Galena St Aurora, CO | 1.0–2.0 | 1.0–2.0 | 762 | $1,078 | $1.41 | 2d | 62 | 0.90mi |
| 1039 S Parker Rd Denver, CO | 2.0 | 1.0–2.0 | 687 | $1,208 | $1.76 | 3d | 43 | 1.00mi |
| 9601 E Iliff Ave Denver, CO | 1.0–3.0 | 1.0–2.0 | 1099 | $1,570 | $1.43 | 2d | 40 | 1.03mi |
| 2234 S Trenton Way Denver, CO | 1.0–3.0 | 1.0–2.0 | 967 | $1,550 | $1.60 | 1d | 34 | 1.03mi |
| 1470 S Havana St Aurora, CO | 1.0–2.0 | 1.0–2.0 | 925 | $1,850 | $2.00 | 5d | 16 | 1.22mi |
| 10603 E Jewell Ave Aurora, CO | 1.0 | 1.0 | 653 | $1,288 | $1.97 | 1d | 3 | 1.24mi |
| 7100 E Evans Ave Denver, CO | 1.0–2.0 | 1.0 | 803 | $902 | $1.12 | 1d | 38 | 1.31mi |
| 10901 E Garden Dr Aurora, CO | 1.0–3.0 | 1.0–2.0 | 1013 | $1,398 | $1.38 | 2d | 24 | 1.34mi |
| 8375 E Yale Ave Denver, CO | 1.0–2.0 | 1.0–2.0 | 911 | $1,635 | $1.79 | 2d | 10 | 1.36mi |
| 1005 S Jamaica St Aurora, CO | 1.0 | 1.0 | 550 | $995 | $1.81 | 21d | 5 | 1.38mi |
| 2575 S Syracuse Way Denver, CO | 1.0–2.0 | 1.0–2.0 | 852 | $1,330 | $1.56 | 3d | 5 | 1.45mi |
| 2470 S Quebec St Denver, CO | 2.0 | 1.0–2.0 | 996 | $1,662 | $1.67 | 1d | 42 | 1.46mi |
HOA detail condo
- Monthly dues
- $0 · $0/yr
- Assessments
- None detected in remarks — confirm with the listing agent.
Listing history 13 events
-
2026-06-18days on market $80,000 Active 19 DOM
-
2026-06-17days on market $80,000 Active 18 DOM
-
2026-06-16days on market $80,000 Active 17 DOM
-
2026-06-15days on market $80,000 Active 16 DOM
-
2026-06-13days on market $80,000 Active 14 DOM
-
2026-06-13days on market $80,000 Active 13 DOM
-
2026-06-10days on market $80,000 Active 10 DOM
-
2026-06-08days on market $80,000 Active 9 DOM
-
2026-06-07days on market $80,000 Active 8 DOM
-
2026-06-04days on market $80,000 Active 5 DOM
-
2026-06-03days on market $80,000 Active 4 DOM
-
2026-06-02days on market $80,000 Active 3 DOM
-
2026-06-01days on market $80,000 Active 2 DOM
ⓘ Source: listings_history table (triggers on properties + properties_extension) + one-shot
backfill from property_details.listing_events for pre-trigger history.
Tax reassessment forecast CO · Resets to sale price
- Current annual tax
- $849 · $71/mo
- Projected year-2 tax
- $849 · $71/mo
- Expected delta
- $0/yr ($0/mo · 0.0%)
ⓘ Screening estimate from a state-policy table — verify with the county assessor before closing.
Climate risk First Street
- Flood 1/10 Low FEMA zone X (unshaded) · 0% chance over 30 yrs
- Wildfire 1/10 Low
- Heat 3/10 Moderate 7 d/yr ≥93°F today · 18 d/yr by 30 yrs out
- Wind 2/10 Low
- Air quality 4/10 Moderate 4 unhealthy d/yr today · 6 by 30 yrs out
Nearby sold comps map
Loading sold comps map…
Walkable amenities ~0.75 mi
Loading nearby amenities…
Taxation est. · year 1
- Rental income
- $13,548
- − Mortgage interest
- −$4,481
- − Property taxes
- −$849
- − Insurance
- −$400
- − Repairs & maintenance
- −$1,084
- − Management
- −$1,084
- − HOA
- −$2,616
- − Depreciation
- −$2,327
- Taxable income
- $706
- Est. tax owed @ 24.0%
- −$170
- After-tax cash flow
- $1,634/yr
For passive investors: Depreciation is non-cash, so a rental often shows a tax loss while cash-flowing — sheltering income. Rental losses are passive: they offset passive income freely, and up to $25,000/yr can offset ordinary (W-2) income if you actively participate and your MAGI is under $100k (phasing out to $0 by $150k); unused losses carry forward. On sale, claimed depreciation is recaptured at up to 25%, and gains may owe capital-gains tax (a 1031 exchange can defer both). Figures are a year-1 estimate at your 24.0% rate — not tax advice; consult a CPA.
Schools (NCES district)
- District
- Cherry Creek School District No. 5 In The County Of Arapah
- NCES district ID
- 0802910
- Math proficiency
- 40% ▼ -4.00%
- Reading proficiency
- 58% ▲ 5.00%
- Median HH income
- $73,326
- Composite
- 44.12/100
- National rank
- #2866
- State rank
- #11 of 86 in CO
Livability — Four Square Mile
No livability data for this city. (Only ~50 U.S. cities are tracked.)
Census & demographics
- Census place
- Four Square Mile, CO
- County
- Denver County · 709,470 people
- City population
- 35,297
- Metro
- Denver-Aurora-Lakewood, CO
- Population (ZIP)
- 29,760
- Household income
- $64,498
- Rent vs Own
- Severe rent burden
- 2359.0
Population outlook (Arapahoe County) Hauer SSP2
- Today (2025)
- 757,407 people
- By 2030
- 819,724 · +8.2%
- By 2040
- 940,367 · +24.2%
- By 2050
- 1,053,720 · +39.1%
- By 2075
- 1,297,693 · +71.3%
- By 2100
- 1,412,796 · +86.5%
Race, ethnicity, and origin ACS 2023
- Neighborhood character
- Highly diverse neighborhood (Simpson 0.71)
- Race & ethnicity
- White 44% Black 23% Hispanic / Latino 20% Two or more races 11% Asian 5%
- Hispanic origin (detail)
- Mexican 15%
- Common ancestry
- Slovak 2% Lithuanian 2% Romanian 2%
- Foreign-born
- 23% · Canada, South Korea, China
- Languages at home
- 70% English-only · Spanish 13% Arabic 4% Russian/Polish/Slavic 3%
Political lean MEDSL · Arapahoe
- 2024 margin
- Strong D (+20.1) · D 58.6% · R 38.5% · Other 2.9%
- 2008→2024 swing
- +7.2pp toward D · 2008: 12.9pp · 2024: 20.1pp
- All cycles
- 2024: D+20.1 2020: D+24.6 2016: D+13.8 2012: D+8.3 2008: D+12.9
Not yet ingested
- Civics
- —
Market trends
- HPI YoY
- ▼ -91.38%
- Current HPI
- 221.202
- Rent YoY
- ▼ -4.39%
- Metro
- Denver-Aurora-Lakewood, CO
- State GDP YoY
- ▲ 1.95%
- F500 in state
- 14
Industry mix (Fortune 500 HQ in CO)
| Industry | F500 HQs | Revenue |
|---|---|---|
| Technology Distribution | 1 | $31B |
|
||
| Food / Agriculture | 1 | $18B |
|
||
| Packaging | 1 | $14B |
|
||
| Healthcare | 1 | $13B |
|
||
| Energy | 1 | $10B |
|
||
| Technology | 1 | $4B |
|
||
Price history
+138.1% since first listed8 events — show timeline
- 2026-05-28 Listed $80,000 Fizber.com
- 2025-05-19 Listing Removed — IRES
- 2025-05-19 Listing Removed — REColorado as Distributed by MLS Grid
- 2025-03-10 Listed $160,000 IRES
- 2025-03-10 Listed $160,000 REColorado as Distributed by MLS Grid
- 2004-04-28 Sold (Public Records) $71,000 Public Records
- 1992-12-21 Sold (Public Records) $14,500 Public Records
- 1983-01-01 Sold (Public Records) $33,600 Public Records
Property tax history
+7.8%/yrLatest (2025): $849 · +72.4% YoY. Source: county tax records.
Cash-flow waterfall
monthlySold comps — $/sqft
last 12 mo · ≤1 miLoading sold comps…