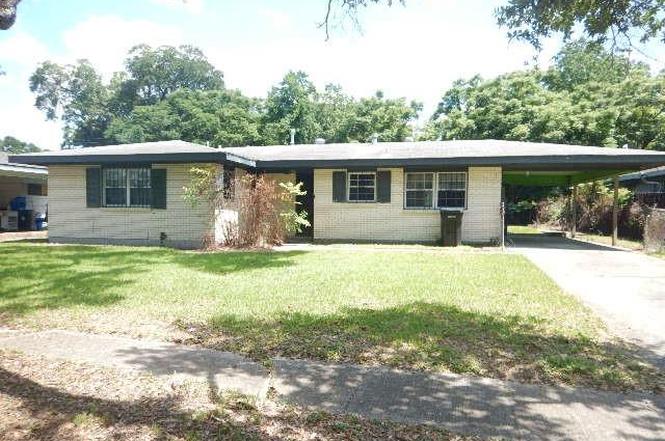
6100 Stratford Pl · New Orleans, LA
Flood risk 8/10 · Major
- FEMA flood zone
- X
- Chance of flooding over 30 yrs
- 0.6%
- Est. flood insurance / yr
- $507 – $1,088
Fire risk 3/10 · Minor
- Est. fire insurance / yr
- $1,269 – $2,357
Heat risk 10/10 · Severe
- Hot days now (above 108°F)
- 7 days/yr
- Hot days in 30 yrs
- 21 days/yr
Wind risk 10/10 · Severe
- Chance of severe wind over 30 yrs
- 99.0%
Air-quality risk 2/10 · Minimal
- Unhealthy air days now
- 2 days/yr
- Unhealthy air days in 30 yrs
- 2 days/yr
Risk factors via First Street. Map © Google.
Why this score? — see what drove the B- grade
The composite is a weighted blend of 9 inputs, each scored 0–100. Each bar is that input's sub-score; the figure is the points it added to the 100-point composite (weight × sub-score).
- Cash flow +30.0/30.0
- 1% rule +10.0/10.0
- DSCR +10.0/10.0
- ARV discount +7.5/15.0
- Livability +4.0/5.0
- Condition / age +2.5/5.0
- Schools +1.6/10.0
- Rent growth +0.2/5.0
- Appreciation +0.0/10.0
$65,000
🖨 Deal sheet 📄 Offer letter ✓ Due diligence
Listing remarks MLS
CASH ONLY! Solid home in need of overhaul in demand area. 3 bedrooms 1.5 baths, X flood zone.
Key facts
- Parking
- Built 1960
Property features AI
Exterior
- Parking: Covered parking
- Utilities: Public water; Public sewer; Electric service (standard)
- Home design: Single-story; Average condition
- Construction: Brick and wood siding construction; Asphalt shingle roof; Slab foundation
- Exterior features: City lot; Rectangular lot; Lot dimensions approximately 67 x 120
Interior
- Kitchen: Oven; Range
- Bedrooms: 3 total rooms (includes bedrooms and living areas)
- Bathrooms: 1 full bathroom; 1 half bathroom
- Heating & cooling: Central heating
- Interior features: Accessible features present
Neighborhood map
What this means for you Summary
Snapshot
- This is a 3-bed/2.0-bath single-family listed at $65k.
Deal economics
- At list price, monthly cash flow is $732 ($9k/yr) — positive.
- The deal already cash-flows at list — no discount required.
- Meets the 1% rule at list price ($2k rent vs $65k).
- Cap rate 21.0% vs local median 4.4% in New Orleans — top-decile yield for the area; either an underpriced asset or a hidden risk that comps aren't pricing in. Stress-test before assuming the spread holds.
Location & tenants
- Location reads 81/100 on livability (#3 in LA, #1,383 nationally) — a professional / high-income tenant draw. Strengths: amenities A+, commute A+, health & safety A+; Watch: crime C-, employment D.
- Orleans Parish (urban): math 11% / reading 27% proficiency, ranked #69 of 98 in LA (top 70%) — low school quality limits family demand, transient renter base, plan for 1-2y turnover; 68% free/reduced lunch — lower-income household profile, screen leases tightly.
- Market conditions: Rents falling (-9.2%/yr); 274 active listings in the ZIP; 22 comparable units currently listed for rent nearby; rentals at typical pace (median 21d on market — plan ~3-4 weeks tenant-placement turnaround); 710 units permitted in Orleans Parish in 2024 (244 in 5+ unit buildings).
- This rent runs 30% of the median local income ($62k/yr) — at the standard rent-burdened threshold; future hikes will face affordability resistance.
Forward outlook
- Local home prices are declining (-3.0%/yr); year-one equity from $449 of loan paydown is wiped out by about $2k of value loss. Plan a longer hold.
- Orleans County population projected at +61% by 2050 — long-run rental-demand tailwind backs the buy-and-hold thesis.
- At projected returns (-3.0% appreciation + 0.0% rent growth), your $18k cash investment doubles in ~3 years — after that, you're playing with house money.
Negotiation context
- Only 1 days on market — expect competitive offers; lowballing is unlikely to land.
- 2 sale attempts with the ask held roughly flat each time — persistent listings suggest the price (not the market) is what's stuck; bring a comps-based counter.
- Current owner paid $50k; 30% above their basis — modest negotiation headroom, anchor on the comps not their cost.
Risks & watch-outs
- Watch-outs: flood insurance adds $66/mo.
- Climate carrying-cost: severe flood risk; severe wind risk, 99% chance of damaging wind over 30y; extreme-heat days projected 7→21/yr by 2055 (HVAC capex compounding) — expect insurance premiums to compound above CPI over the hold.
Questions for the listing agent
- Built in 1960 — when were the roof, HVAC, electrical panel, plumbing, and water heater last replaced?
- What's the actual annual flood-insurance premium (NFIP or private), and is the property in a SFHA with mandatory coverage?
- Is there a deadline driving the sale (1031 exchange, divorce, estate, relocation)? That informs how much negotiation room exists.
- What's the average days-on-market for RENTAL listings here right now (not sales)? A rising rental-DOM trend means longer vacancies and softer asking-rent achievability than the comps imply.
- What's the recent tenant-quality profile in this submarket — average credit score on applications, eviction rate, late-payment / NSF rate, and stable-employment percentage? A property-management company in the area should have these aggregated.
- How much new for-sale + rental construction is in the pipeline within 1–3 miles? Heavy new supply typically softens prices + rents 12–24 months out; constrained supply supports both.
Investment metrics
- 1% rule
- 2.43% ✓
- Cap rate
- 21.03%
- Cash-on-cash
- 52.63%
- DSCR
- 3.34
- GRM
- 3.4
CMA / ARV
- ARV (on-the-fly)
- $157,605
- Comps found
- 9
Show comp detail 9 sales within ~0.75 mi
| Address | Dist | Beds/Ba | Sqft | Sold | Price | $/sf | Match |
|---|---|---|---|---|---|---|---|
| 6131 Stratford Pl | 0.04mi | 3/2.0 | 1,208 (+2%) | 16mo | $175,000 | $145 | 81 |
| 3211 Sullen Pl | 0.57mi | 3/1.5 | 1,153 (-3%) | 3mo | $159,900 | $139 | 65 |
| 3300 Mansfield Ave | 0.68mi | 3/2.0 | 1,200 (+1%) | 7mo | $129,900 | $108 | 60 |
| 3540 Preston Pl | 0.49mi | 3/1.5 | 1,100 (-7%) | 9mo | $130,000 | $118 | 56 |
| 7054 Tullis Dr | 0.72mi | 3/2.0 | 1,290 (+9%) | 4mo | $75,000 | $58 | 48 |
| 2941 Kent St | 0.68mi | 3/2.0 | 1,350 (+14%) | 2mo | $180,000 | $133 | 43 |
| 3500 Pittari Pl | 0.69mi | 3/1.0 | 1,286 (+8%) | 20mo | $90,000 | $70 | 33 |
| 3651 Tasha Pl | 0.67mi | 3/2.0 | 1,350 (+14%) | 16mo | $186,345 | $138 | 32 |
| 217 Rhodes Ave | 0.59mi | 3/1.0 | 1,030 (-13%) | 18mo | $160,000 | $155 | 32 |
Match score weights: distance 35% · size 25% · config 20% · recency 20%. Top-matched comps best support the ARV.
Projected returns pro-forma
-3.0% appreciation · 0.0% rent growth · sell at horizon
- IRR
- 42.1%
- Equity multiple
- 2.73×
- Total profit
- $31,515
- Equity at exit
- $9,692
- IRR
- 46.8%
- Equity multiple
- 4.84×
- Total profit
- $69,841
- Equity at exit
- $5,620
Cash invested: $18,200 (down + closing). Projections, not guarantees.
Landlord ↔ Tenant lean methodology
- Overall (STATE)
- 90 Strongly Landlord-Friendly
- State Louisiana
- 90 Strongly Landlord-Friendly · R+12
- County
- — inherits STATE
- City
- — inherits STATE
ZIP-level market 70131
- Home prices YoY
- -12.0%
- Rents YoY
- -9.2%
- Active inventory
- 274
- Price-to-rent
- 3.4×
Monthly cashflow live
- Estimated rent
- $1,579 high interval (Pro) →
- Mortgage (P&I)
- −$341
- Tax est. 1.5%
- −$81 /mo · $975/yr
- Insurance
- −$27
- Flood insurance flood zone
- −$66 /mo · $798/yr
- HOA
- −$0
- Vacancy / Maint / Mgmt
- −$332
- Net cashflow
- $732
Break-even live
UW: 25.0% down · 7.5% · 30yr · 1.5% tax · 5.0% vac · 8.0% maint · 8.0% mgmt
Financing live
Cash to close
- Down payment
- $16,250
- Closing costs
- $1,950
- Reserves months
- —
- Total cash needed
- —
Loan-product check · same deal, 3 products live
Conventional
25% down · 7.5% · 30yr
- Down + closing
- —
- Monthly P&I
- —
- Monthly cashflow
- —
- DSCR
- —
- Eligible?
- —
Personal DTI + credit; lowest rate.
DSCR
20% down · 8.5% · 30yr
- Down + closing
- —
- Monthly P&I
- —
- Monthly cashflow
- —
- DSCR
- —
- Eligible?
- —
No personal income docs; deal must DSCR.
Hard money
10% down · 12.0% · 12mo
- Down + closing
- —
- Monthly P&I
- —
- Monthly cashflow
- —
- DSCR
- —
- Eligible?
- —
Short-term bridge; refi at stabilization.
Rent comps 22 comps
| Address | Beds | Baths | Sqft | Rent | $/sqft | DOM | Units | Dist |
|---|---|---|---|---|---|---|---|---|
| 6121 Stratford Pl New Orleans, LA | 3.0 | 2.0 | 1225 | $1,800 | $1.47 | 16d | 1 | 0.05mi |
| 4254 Maple Leaf Dr New Orleans, LA | 1.0–3.0 | 1.0–2.5 | 1354 | $1,687 | $1.25 | 1d | 8 | 0.17mi |
| 4020 Sullen Pl New Orleans, LA | 4.0 | 2.5 | 1280 | $1,400 | $1.09 | 3d | 1 | 0.23mi |
| 5997 Tullis Dr Unit B New Orleans, LA | 3.0 | 2.0 | 1003 | $1,250 | $1.25 | 14d | 1 | 0.50mi |
| 5997 Tullis Dr Unit B New Orleans, LA | 3.0 | 2.0 | 1003 | $1,250 | $1.25 | 23d | 1 | 0.50mi |
| 5987 Tullis Dr New Orleans, LA | 2.0 | 1.5 | 1179 | $1,150 | $0.98 | 17d | 1 | 0.50mi |
| 5987 Tullis Dr New Orleans, LA | 2.0 | 1.5 | 1179 | $1,100 | $0.93 | 3d | 1 | 0.50mi |
| 5400 Lacour Monique St New Orleans, LA | 2.0 | 1.0 | 750 | $1,650 | $2.20 | 3d | 1 | 0.56mi |
| 4479 Woodland Dr Unit A New Orleans, LA | 2.0 | 2.5 | 1300 | $1,500 | $1.15 | 23d | 1 | 0.56mi |
| 5797 Tullis Dr New Orleans, LA | 3.0 | 1.5 | 1240 | $1,600 | $1.29 | 23d | 1 | 0.68mi |
| 5000 Woodland Dr New Orleans, LA | 2.0 | 1.0–2.5 | 943 | $1,457 | $1.55 | 23d | 1 | 0.75mi |
| 3531 Adrian St New Orleans, LA | 3.0 | 2.0 | 1292 | $1,895 | $1.47 | 16d | 1 | 0.83mi |
| 130 Cypress Grove Ct #92 New Orleans, LA | 2.0 | 1.5 | 1381 | $1,550 | $1.12 | 16d | 1 | 0.90mi |
| 3151 Plymouth Pl New Orleans, LA | 3.0 | 1.0 | 1470 | $1,700 | $1.16 | 23d | 1 | 0.92mi |
| 5501 Tullis Dr New Orleans, LA | 1.0–2.0 | 1.0–2.0 | 792 | $1,575 | $1.99 | 23d | 1 | 0.97mi |
| 3320 Kabel Dr Unit C New Orleans, LA | 3.0 | 2.0 | 999 | $1,100 | $1.10 | 3d | 1 | 1.18mi |
| 3362 Kabel Dr New Orleans, LA | 3.0 | 2.0 | 1000 | $1,250 | $1.25 | 23d | 1 | 1.19mi |
| 3252 Kabel Dr New Orleans, LA | 2.0 | 1.5 | 1080 | $1,300 | $1.20 | 20d | 1 | 1.20mi |
| 601 Huntlee Dr New Orleans, LA | 3.0 | 1.0 | 874 | $1,450 | $1.66 | 23d | 1 | 1.22mi |
| 3317 Kabel Dr New Orleans, LA | 2.0 | 1.5 | 975 | $1,350 | $1.38 | 23d | 1 | 1.23mi |
| 3315 Kabel Dr New Orleans, LA | 2.0 | 1.5 | 975 | $1,350 | $1.38 | 23d | 1 | 1.23mi |
| 3307 Kabel Dr New Orleans, LA | 2.0 | 1.5 | 1000 | $1,250 | $1.25 | 3d | 1 | 1.24mi |
Listing history 2 events
-
2026-06-17remarks 94-char remark
-
2026-06-17$65,000 Active 1 DOM
ⓘ Source: listings_history table (triggers on properties + properties_extension) + one-shot
backfill from property_details.listing_events for pre-trigger history.
Climate risk First Street
- Flood 8/10 Severe FEMA zone X · 60% chance over 30 yrs
- Wildfire 3/10 Moderate
- Heat 10/10 Extreme 7 d/yr ≥108°F today · 21 d/yr by 30 yrs out
- Wind 10/10 Extreme 99% chance of damaging wind over 30 yrs
- Air quality 2/10 Low 2 unhealthy d/yr today · 2 by 30 yrs out
Nearby sold comps map
Loading sold comps map…
Walkable amenities ~0.75 mi
Loading nearby amenities…
Taxation est. · year 1
- Rental income
- $18,949
- − Mortgage interest
- −$3,641
- − Property taxes
- −$975
- − Insurance
- −$1,122
- − Repairs & maintenance
- −$1,516
- − Management
- −$1,516
- − Depreciation
- −$1,891
- Taxable income
- $8,288
- Est. tax owed @ 24.0%
- −$1,989
- After-tax cash flow
- $6,793/yr
For passive investors: Depreciation is non-cash, so a rental often shows a tax loss while cash-flowing — sheltering income. Rental losses are passive: they offset passive income freely, and up to $25,000/yr can offset ordinary (W-2) income if you actively participate and your MAGI is under $100k (phasing out to $0 by $150k); unused losses carry forward. On sale, claimed depreciation is recaptured at up to 25%, and gains may owe capital-gains tax (a 1031 exchange can defer both). Figures are a year-1 estimate at your 24.0% rate — not tax advice; consult a CPA.
Schools (NCES district)
- District
- Orleans Parish
- NCES district ID
- 2201170
- Math proficiency
- 11% ▼ -52.00%
- Reading proficiency
- 27% ▼ -46.00%
- Median HH income
- $37,011
- Composite
- 15.78/100
- National rank
- #9271
- State rank
- #69 of 98 in LA
Livability — New Orleans
- Score
- 81/100
- State rank
- #3
- US rank
- #1383
Category grades
Schools grade is shown separately in the Schools card above.
Census & demographics
- Census place
- New Orleans, LA
- County
- Orleans Parish · 338,817 people
- City population
- 338,817
- Metro
- New Orleans-Metairie, LA
- Population (ZIP)
- 25,151
- Household income
- $62,389
- Rent vs Own
- Severe rent burden
- 707.0
Population outlook (Orleans County) Hauer SSP2
- Today (2025)
- 513,025 people
- By 2030
- 575,781 · +12.2%
- By 2040
- 700,174 · +36.5%
- By 2050
- 826,541 · +61.1%
- By 2075
- 1,123,374 · +119.0%
- By 2100
- 1,355,609 · +164.2%
Race, ethnicity, and origin ACS 2023
- Neighborhood character
- Diverse neighborhood (Simpson 0.57)
- Race & ethnicity
- Black 62% White 20% Hispanic / Latino 11% Two or more races 6% Asian 4%
- Hispanic origin (detail)
- Mexican 2% Dominican 2%
- Common ancestry
- Lithuanian 4% Hispanic 1%
- Foreign-born
- 8% · Canada, Vietnam, China
- Languages at home
- 86% English-only · Spanish 9% Vietnamese 2% French/Haitian/Cajun 1%
Political lean MEDSL · Orleans
- 2024 margin
- Solid D (+67.0) · D 82.2% · R 15.2% · Other 2.7%
- 2008→2024 swing
- +6.7pp toward D · 2008: 60.3pp · 2024: 67.0pp
- All cycles
- 2024: D+67.0 2020: D+68.2 2016: D+66.2 2012: D+62.5 2008: D+60.3
Not yet ingested
- Civics
- —
Market trends
- HPI YoY
- ▼ -28.08%
- Current HPI
- 206.7552
- Rent YoY
- ▼ -9.23%
- Metro
- New Orleans-Metairie, LA
- State GDP YoY
- ▲ 3.29%
- F500 in state
- 10
Industry mix (Fortune 500 HQ in LA)
| Industry | F500 HQs | Revenue |
|---|---|---|
| Telecommunications | 2 | $23B |
|
||
| Utilities | 1 | $12B |
|
||
| Wholesale / Distribution | 1 | $5B |
|
||
| Advertising | 1 | $2B |
|
||
Price history
+30.0% since first listed3 events — show timeline
- 2026-06-16 Listed $65,000 AcadianaMLS
- 2026-06-16 Listed $65,000 GSREIN
- 1994-01-18 Sold (Public Records) $50,000 Public Records
Property tax history
-19.2%/yrLatest (2026): $75 · +0.0% YoY. Source: county tax records.
Cash-flow waterfall
monthlySold comps — $/sqft
last 12 mo · ≤1 miLoading sold comps…