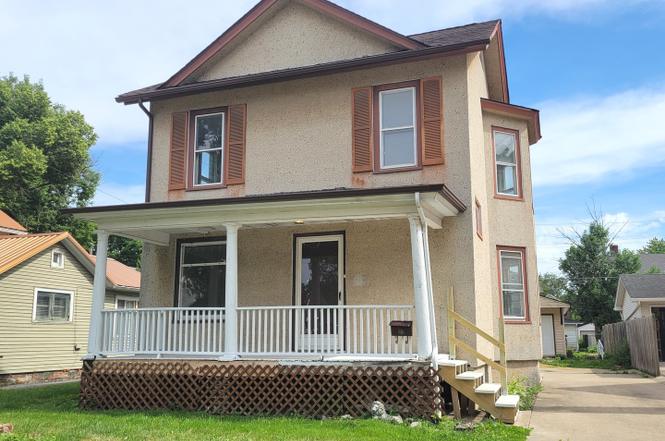
219 Lasalle St St · Streator, IL
Flood risk 1/10 · Minimal
- FEMA flood zone
- X (unshaded)
- Chance of flooding over 30 yrs
- 0.0%
- Est. flood insurance / yr
- $473 – $860
Fire risk 1/10 · Minimal
- Est. fire insurance / yr
- $804 – $1,492
Heat risk 3/10 · Minor
- Hot days now (above 104°F)
- 7 days/yr
- Hot days in 30 yrs
- 17 days/yr
Wind risk 2/10 · Minimal
- Chance of severe wind over 30 yrs
- 1.0%
Air-quality risk 2/10 · Minimal
- Unhealthy air days now
- 1 days/yr
- Unhealthy air days in 30 yrs
- 1 days/yr
Risk factors via First Street. Map © Google.
Why this score? — see what drove the B grade
The composite is a weighted blend of 9 inputs, each scored 0–100. Each bar is that input's sub-score; the figure is the points it added to the 100-point composite (weight × sub-score).
- Cash flow +27.4/30.0
- ARV discount +15.0/15.0
- DSCR +9.6/10.0
- 1% rule +9.4/10.0
- Livability +3.2/5.0
- Rent growth +2.5/5.0
- Condition / age +2.5/5.0
- Schools +1.3/10.0
- Appreciation +0.0/10.0
$109,000
🖨 Deal sheet 📄 Offer letter ✓ Due diligence
Listing remarks MLS
Home with 3-4 bedrooms, 1.5 baths, 2-car detached garage, & formal dining room.
Key facts
- 6,534 sq ft lot
- 2 garage spots
- Built 1900
Property features AI
Finance
- Other: Directions: Rt 23 south, right on LaSalle St.
- Financial info: Special service area: No
- HOA & community: No master association fee required; Community amenities nearby: park, pool, tennis courts
Exterior
- Parking: Detached garage (owned) with space for 2 cars; Concrete parking
- Utilities: Public water; Public sewer; Electric service with fuses
- Home design: Detached single-family home; Two-story residence; Fee simple ownership
- Construction: Stucco exterior; Asphalt roof; Block foundation; Built before 1978
- Exterior features: Lot approximately less than 0.25 acre (dimensions ~51 x 126); School bus service; Street paved with curbs and street lights
Interior
- Kitchen: Kitchen with eating area/table space; Refrigerator included
- Bedrooms: Three bedrooms (all on the second floor); Master bedroom on the second floor
- Flooring: Carpet in bedrooms and some rooms; Laminate flooring in foyer, dining room, kitchen, and living room
- Bathrooms: One full bathroom; One half bathroom
- Heating & cooling: Forced air heating; Central air conditioning
- Interior features: Seven total rooms; Unfinished full basement; Wood-burning fireplace in the living room
- Laundry & utility: Laundry room
Neighborhood map
What this means for you Summary
Snapshot
- This is a 3-bed/2.0-bath single-family listed at $109k.
Deal economics
- At list price, monthly cash flow is $318 ($4k/yr) — positive.
- The deal already cash-flows at list — no discount required.
- Meets the 1% rule at list price ($2k rent vs $109k).
- Cap rate 9.8% vs local median 7.8% in Streator — meaningfully above typical; check what's discounted (condition, days-on-market, listing class) to confirm the premium yield is real.
Location & tenants
- Location reads 63/100 on livability (#752 in IL) — a middle-class / working-renter tenant base. Strengths: cost of living A+, health & safety A+, housing B+; Watch: amenities F, commute F, employment F.
- Streator Twp Hsd 40 (town): math 11% / reading 19% proficiency, ranked #513 of 620 in IL (top 83%) — low school quality limits family demand, transient renter base, plan for 1-2y turnover.
- Zoned schools: Streator Twp High School (math 11% / reading 19%, grade F, #462 of 693 statewide, top 68%, 809 students, 0% FRL).
- Market conditions: 87 active listings in the ZIP; 5 comparable units currently listed for rent nearby; rentals leasing fast (median 7d on market — plan ~1-2 weeks tenant-placement turnaround); 82 units permitted in LaSalle County in 2024 (0 in 5+ unit buildings).
- This rent runs 32% of the median local income ($59k/yr) — at the standard rent-burdened threshold; future hikes will face affordability resistance.
Forward outlook
- Local home prices are declining (-3.0%/yr); year-one equity from $754 of loan paydown is wiped out by about $3k of value loss. Plan a longer hold.
- LaSalle County population projected at -16% by 2050 — secular population decline; favor cash flow + early exit over multi-decade hold.
- At projected returns (-3.0% appreciation + 3.0% rent growth), your $31k cash investment doubles in ~9 years — after that, you're playing with house money.
Negotiation context
- Only 0 days on market — expect competitive offers; lowballing is unlikely to land.
- 2 sale attempts since 12y ago with the ask held roughly flat each time — persistent listings suggest the price (not the market) is what's stuck; bring a comps-based counter.
- Current owner paid $26k; list at $109k implies a 321% gain — meaningful room to come down on a strong offer.
Risks & watch-outs
- Watch-outs: property tax is 3.3% of price; built in 1900 — expect roof / HVAC / electrical / plumbing capex.
Questions for the listing agent
- Built in 1900 — when were the roof, HVAC, electrical panel, plumbing, and water heater last replaced?
- Property tax is high relative to price — has the assessment been appealed recently, and will the sale trigger a re-assessment?
- Is there a deadline driving the sale (1031 exchange, divorce, estate, relocation)? That informs how much negotiation room exists.
- Schools are F-rated, which usually means shorter tenancies and higher turnover. Who's the typical renter profile here, and what's been the actual vacancy rate?
- What's the average days-on-market for RENTAL listings here right now (not sales)? A rising rental-DOM trend means longer vacancies and softer asking-rent achievability than the comps imply.
- What's the recent tenant-quality profile in this submarket — average credit score on applications, eviction rate, late-payment / NSF rate, and stable-employment percentage? A property-management company in the area should have these aggregated.
- How much new for-sale + rental construction is in the pipeline within 1–3 miles? Heavy new supply typically softens prices + rents 12–24 months out; constrained supply supports both.
Investment metrics
- 1% rule
- 1.44% ✓
- Cap rate
- 9.79%
- Cash-on-cash
- 12.49%
- DSCR
- 1.56
- GRM
- 5.8
CMA / ARV
- ARV (on-the-fly)
- $137,104
- Comps found
- 12
Show comp detail 12 sales within ~0.75 mi
| Address | Dist | Beds/Ba | Sqft | Sold | Price | $/sf | Match |
|---|---|---|---|---|---|---|---|
| 216 Lasalle St | 0.03mi | 3/2.0 | 1,550 (-0%) | 14mo | $40,000 | $26 | 86 |
| 114 W Washington St | 0.13mi | 3/1.5 | 1,652 (+6%) | 13mo | $144,000 | $87 | 71 |
| 215 W Washington St | 0.06mi | 2/1.0 (-1) | 1,449 (-7%) | 8mo | $120,000 | $83 | 70 |
| 602 S Vermillion St | 0.42mi | 4/2.0 (+1) | 1,608 (+3%) | 0mo | $147,000 | $91 | 70 |
| 213 W 6th St | 0.26mi | 3/1.5 | 1,599 (+3%) | 19mo | $135,800 | $85 | 65 |
| 903 Milner St | 0.70mi | 3/2.0 | 1,536 (-1%) | 1mo | $210,000 | $137 | 64 |
| 110 Lasalle St | 0.14mi | 4/2.0 (+1) | 1,752 (+12%) | 12mo | $155,000 | $88 | 58 |
| 112 W Kent St | 0.55mi | 3/2.0 | 1,368 (-12%) | 10mo | $85,500 | $63 | 46 |
| 207 Cottage St | 0.54mi | 4/1.5 (+1) | 1,650 (+6%) | 21mo | $97,000 | $59 | 41 |
| 412 S 5th Ave | 0.54mi | 3/2.0 | 1,750 (+12%) | 18mo | $205,000 | $117 | 39 |
| 402 W Morrell St | 0.75mi | 4/1.5 (+1) | 1,626 (+4%) | 21mo | $159,000 | $98 | 33 |
| 312 W Morrell St | 0.74mi | 4/2.0 (+1) | 1,408 (-10%) | 19mo | $137,000 | $97 | 28 |
Match score weights: distance 35% · size 25% · config 20% · recency 20%. Top-matched comps best support the ARV.
Projected returns pro-forma
-3.0% appreciation · 3.0% rent growth · sell at horizon
- IRR
- 2.3%
- Equity multiple
- 1.09×
- Total profit
- $2,691
- Equity at exit
- $16,252
- IRR
- 12.0%
- Equity multiple
- 1.95×
- Total profit
- $28,898
- Equity at exit
- $9,424
Cash invested: $30,520 (down + closing). Projections, not guarantees.
Landlord ↔ Tenant lean methodology
- Overall (STATE)
- 43 Moderately Tenant-Leaning
- State Illinois
- 43 Moderately Tenant-Leaning · D+7
- County
- — inherits STATE
- City
- — inherits STATE
ZIP-level market 61364
- Home prices YoY
- -31.1%
- Active inventory
- 87
- Price-to-rent
- 5.8×
Monthly cashflow live
- Estimated rent
- $1,565 high interval (Pro) →
- Mortgage (P&I)
- −$572
- Tax from tax record
- −$301 /mo · $3,617/yr
- Insurance
- −$45
- HOA
- −$0
- Vacancy / Maint / Mgmt
- −$329
- Net cashflow
- $318
Break-even live
UW: 25.0% down · 7.5% · 30yr · 1.5% tax · 5.0% vac · 8.0% maint · 8.0% mgmt
Financing live
Cash to close
- Down payment
- $27,250
- Closing costs
- $3,270
- Reserves months
- —
- Total cash needed
- —
Loan-product check · same deal, 3 products live
Conventional
25% down · 7.5% · 30yr
- Down + closing
- —
- Monthly P&I
- —
- Monthly cashflow
- —
- DSCR
- —
- Eligible?
- —
Personal DTI + credit; lowest rate.
DSCR
20% down · 8.5% · 30yr
- Down + closing
- —
- Monthly P&I
- —
- Monthly cashflow
- —
- DSCR
- —
- Eligible?
- —
No personal income docs; deal must DSCR.
Hard money
10% down · 12.0% · 12mo
- Down + closing
- —
- Monthly P&I
- —
- Monthly cashflow
- —
- DSCR
- —
- Eligible?
- —
Short-term bridge; refi at stabilization.
Rent comps 5 comps
| Address | Beds | Baths | Sqft | Rent | $/sqft | DOM | Units | Dist |
|---|---|---|---|---|---|---|---|---|
| 503 S Bloomington St Streator, IL | 3.0 | 1.0 | 1200 | $1,500 | $1.25 | 24d | 1 | 0.24mi |
| 514 Lundy St Streator, IL | 3.0 | 1.0 | 1174 | $1,700 | $1.45 | 3d | 1 | 0.54mi |
| 514 Lundy St Streator, IL | 4.0 | 1.5 | 1300 | $1,700 | $1.31 | 7d | 1 | 0.54mi |
| 402 S Illinois St Streator, IL | 2.0 | 1.0 | 1116 | $1,550 | $1.39 | 21d | 1 | 0.73mi |
| 1409 Kelly St Streator, IL | 3.0 | 1.0 | 1280 | $1,750 | $1.37 | 7d | 1 | 1.34mi |
Listing history 24 events
-
2026-06-18pricestatusdays on market $109,000 Pending
-
2026-06-17days on market $99,900 Contingent - Continue to Show 89 DOM
-
2026-06-16days on market $99,900 Contingent - Continue to Show 88 DOM
-
2026-06-15days on market $99,900 Contingent - Continue to Show 87 DOM
-
2026-06-14days on market $99,900 Contingent - Continue to Show 85 DOM
-
2026-06-12days on market $99,900 Contingent - Continue to Show 84 DOM
-
2026-06-09days on market $99,900 Contingent - Continue to Show 81 DOM
-
2026-06-08days on market $99,900 Contingent - Continue to Show 80 DOM
-
2026-06-07days on market $99,900 Contingent - Continue to Show 79 DOM
-
2026-06-05days on market $99,900 Contingent - Continue to Show 76 DOM
-
2026-06-03days on market $99,900 Contingent - Continue to Show 75 DOM
-
2026-06-02days on market $99,900 Contingent - Continue to Show 74 DOM
-
2026-06-01days on market $99,900 Contingent - Continue to Show 73 DOM
-
2026-05-31days on market $99,900 Contingent - Continue to Show 72 DOM
-
2026-05-30days on market $99,900 Contingent - Continue to Show 71 DOM
-
2026-04-28historical Contingent - Continue to Show
-
2026-04-01price $99,900
-
2026-03-20$109,000 Active
-
2014-05-08soldstatus $25,900 Closed Sale 83-char remark
Show marketing remark (83 chars)
Home with 3-4 bedrooms, 1.5 baths, 2-car detached garage, & formal dining room.
-
2014-04-18status Pending 83-char remark
Show marketing remark (83 chars)
Home with 3-4 bedrooms, 1.5 baths, 2-car detached garage, & formal dining room.
-
2014-03-28price $25,900 Price Change 83-char remark
Show marketing remark (83 chars)
Home with 3-4 bedrooms, 1.5 baths, 2-car detached garage, & formal dining room.
-
2014-02-28$29,900 New 83-char remark
Show marketing remark (83 chars)
Home with 3-4 bedrooms, 1.5 baths, 2-car detached garage, & formal dining room.
-
1998-01-20soldstatus $60,000
-
1998-01-20soldstatus $60,000
ⓘ Source: listings_history table (triggers on properties + properties_extension) + one-shot
backfill from property_details.listing_events for pre-trigger history.
Tax reassessment forecast IL · Partial reset (capped growth)
- Current annual tax
- $3,617 · $301/mo
- Projected year-2 tax
- $3,617 · $301/mo
- Expected delta
- $0/yr ($0/mo · 0.0%)
ⓘ Screening estimate from a state-policy table — verify with the county assessor before closing.
Climate risk First Street
- Flood 1/10 Low FEMA zone X (unshaded) · 0% chance over 30 yrs
- Wildfire 1/10 Low
- Heat 3/10 Moderate 7 d/yr ≥104°F today · 17 d/yr by 30 yrs out
- Wind 2/10 Low 100% chance of damaging wind over 30 yrs
- Air quality 2/10 Low 1 unhealthy d/yr today · 1 by 30 yrs out
Nearby sold comps map
Loading sold comps map…
Walkable amenities ~0.75 mi
Loading nearby amenities…
Taxation est. · year 1
- Rental income
- $18,776
- − Mortgage interest
- −$6,106
- − Property taxes
- −$3,617
- − Insurance
- −$545
- − Repairs & maintenance
- −$1,502
- − Management
- −$1,502
- − Depreciation
- −$3,171
- Taxable income
- $2,333
- Est. tax owed @ 24.0%
- −$560
- After-tax cash flow
- $3,251/yr
For passive investors: Depreciation is non-cash, so a rental often shows a tax loss while cash-flowing — sheltering income. Rental losses are passive: they offset passive income freely, and up to $25,000/yr can offset ordinary (W-2) income if you actively participate and your MAGI is under $100k (phasing out to $0 by $150k); unused losses carry forward. On sale, claimed depreciation is recaptured at up to 25%, and gains may owe capital-gains tax (a 1031 exchange can defer both). Figures are a year-1 estimate at your 24.0% rate — not tax advice; consult a CPA.
Schools (NCES district)
- District
- Streator Twp Hsd 40
- NCES district ID
- 1738100
- Math proficiency
- 11% ▼ -4.00%
- Reading proficiency
- 19% ▼ -1.00%
- Median HH income
- $43,002
- Composite
- 13.07/100
- National rank
- #9561
- State rank
- #513 of 620 in IL
Livability — Streator
- Score
- 63/100
- State rank
- #752
- US rank
- #15266
Category grades
Schools grade is shown separately in the Schools card above.
Census & demographics
- Census place
- Streator, IL
- County
- La Salle County · 41,676 people
- City population
- 17,963
- Metro
- Ottawa, IL
- Population (ZIP)
- 17,963
- Household income
- $59,060
- Rent vs Own
- Severe rent burden
- 450.0
Population outlook (LaSalle County) Hauer SSP2
- Today (2025)
- 107,080 people
- By 2030
- 104,196 · -2.7%
- By 2040
- 97,413 · -9.0%
- By 2050
- 90,294 · -15.7%
- By 2075
- 76,252 · -28.8%
- By 2100
- 61,339 · -42.7%
Race, ethnicity, and origin ACS 2023
- Neighborhood character
- Predominantly White (83%)
- Race & ethnicity
- White 83% Hispanic / Latino 11% Two or more races 4% Black 3%
- Hispanic origin (detail)
- Mexican 10%
- Common ancestry
- Romanian 3% Lithuanian 2% Slovak 2%
- Foreign-born
- 3% · Canada
- Languages at home
- 93% English-only · Spanish 6%
Political lean MEDSL · LaSalle
- 2024 margin
- R (+18.5) · D 40.1% · R 58.6% · Other 1.3%
- 2008→2024 swing
- -29.6pp toward R · 2008: 11.1pp · 2024: -18.5pp
- All cycles
- 2024: R+18.5 2020: R+14.3 2016: R+14.4 2012: R+0.4 2008: D+11.1
Not yet ingested
- Civics
- —
Market trends
- HPI YoY
- ▼ -105.28%
- Current HPI
- 233.5533
- Rent YoY
- —
- Metro
- Ottawa, IL
- State GDP YoY
- ▲ 1.59%
- F500 in state
- 60
Industry mix (Fortune 500 HQ in IL)
| Industry | F500 HQs | Revenue |
|---|---|---|
| Insurance | 4 | $201B |
|
||
| Consumer Goods | 4 | $87B |
|
||
| Industrial Machinery | 3 | $64B |
|
||
| Healthcare | 2 | $55B |
|
||
| Retail / Pharmacy | 1 | $148B |
|
||
| Agriculture / Food | 1 | $86B |
|
||
Price history
+66.5% since first listed9 events — show timeline
- 2026-04-28 Contingent — MRED as Distributed by MLS Grid
- 2026-04-01 Price Changed $99,900 MRED as Distributed by MLS Grid
- 2026-03-20 Listed $109,000 MRED as Distributed by MLS Grid
- 2014-05-08 Sold (MLS) $25,900 MRED as Distributed by MLS Grid
- 2014-04-18 Pending — MRED as Distributed by MLS Grid
- 2014-03-28 Price Changed $25,900 MRED as Distributed by MLS Grid
- 2014-02-28 Listed $29,900 MRED as Distributed by MLS Grid
- 1998-01-20 Sold (Public Records) $60,000 Public Records
- 1998-01-20 Sold (Public Records) $60,000 Public Records
Property tax history
+5.5%/yrLatest (2024): $3,617 · +8.1% YoY. Source: county tax records.
Cash-flow waterfall
monthlySold comps — $/sqft
last 12 mo · ≤1 miLoading sold comps…