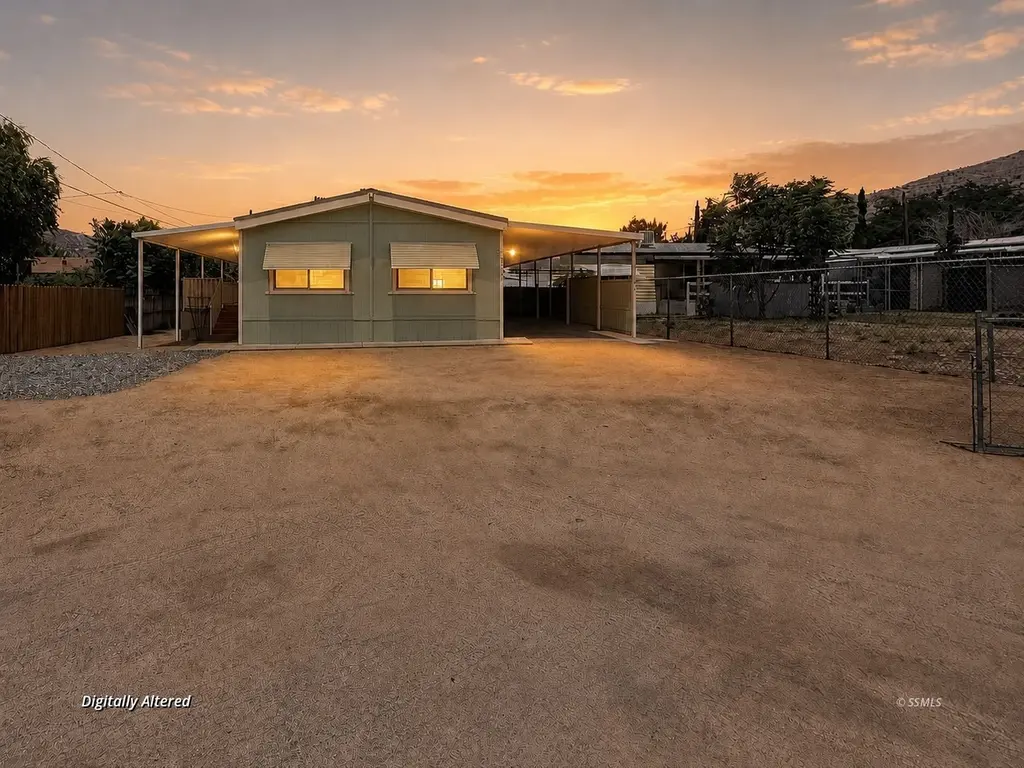
2603 Suzie Q Dr · Lake Isabella, CA
Flood risk 1/10 · Minimal
- FEMA flood zone
- X (unshaded)
- Chance of flooding over 30 yrs
- 0.0%
- Est. flood insurance / yr
- $507 – $1,088
Fire risk 9/10 · Severe
- Est. fire insurance / yr
- $659 – $1,223
Heat risk 6/10 · Moderate
- Hot days now (above 100°F)
- 11 days/yr
- Hot days in 30 yrs
- 28 days/yr
Wind risk 1/10 · Minimal
- Chance of severe wind over 30 yrs
- —
Air-quality risk 10/10 · Severe
- Unhealthy air days now
- 24 days/yr
- Unhealthy air days in 30 yrs
- 30 days/yr
Risk factors via First Street. Map © Google.
Why this score? — see what drove the C+ grade
The composite is a weighted blend of 9 inputs, each scored 0–100. Each bar is that input's sub-score; the figure is the points it added to the 100-point composite (weight × sub-score).
- Cash flow +24.5/30.0
- DSCR +7.9/10.0
- Appreciation +7.8/10.0
- ARV discount +7.5/15.0
- 1% rule +5.8/10.0
- Schools +2.6/10.0
- Livability +2.6/5.0
- Rent growth +2.5/5.0
- Condition / age +2.5/5.0
$156,000
🖨 Deal sheet 📄 Offer letter ✓ Due diligence
Listing remarks
1983 manufactured home on a permanent foundation with a recorded 433A already in place, making conventional financing possible. Major updates have been completed, including new underground utilities, a new septic system, new 100-amp electrical panel, and a partial roof replacement in 2023.The home offers 2 bedrooms and 2 bathrooms, including a primary suite with its own private bath. Enjoy your morning coffee on the covered front porch and take advantage of the covered 2-car carport. Bring the RV, boat, travel trailer, work trucks, and off-road toys! Double-gated access and abundant parking provide room for all your vehicles and equipment without paying for off-site storage. Affordable comm
Key facts
- Covered front porch
- Permanent foundation
- New septic system
Tags
Property features AI
Exterior
- Utilities: Propane for heating and water heater
- Home design: Manufactured home (double-wide); Residential property
- Construction: Wood siding; Composition roof; Crawl space foundation; Built as manufactured (affixed)
- Exterior features: Garden; Covered patio; Patio; Fenced yard; RV/Boat storage; Has view
Interior
- Kitchen: Dishwasher; Gas oven; Gas range; Refrigerator; Disposal
- Flooring: Carpet; Linoleum
- Bathrooms: 2 full bathrooms
- Heating & cooling: Propane heating; Evaporative cooling
- Interior features: Dishwasher; Disposal; Gas oven; Gas range; Refrigerator; Gas water heater; Carpet flooring; Linoleum flooring; Crawl space basement
- Laundry & utility: Gas water heater
Neighborhood map
What this means for you Summary
Snapshot
- This is a 2-bed/1.0-bath manufactured listed at $156k.
Deal economics
- At list price, monthly cash flow is $321 ($4k/yr) — positive.
- The deal already cash-flows at list — no discount required.
- Meets the 1% rule at list price ($2k rent vs $156k).
- Recommended offer: $154k (1.5% below list) — sets the bar for market timing.
Location & tenants
- Location reads 52/100 on livability (#999 in CA) — a working-class tenant base; expect higher turnover. Strengths: housing A, cost of living B+; Watch: crime C-, amenities F, commute F.
- Kernville Union Elementary (rural): math 20% / reading 37% proficiency, ranked #1,128 of 1,400 in CA (top 81%) — low school quality limits family demand, transient renter base, plan for 1-2y turnover; 65% free/reduced lunch — lower-income household profile, screen leases tightly.
- Zoned schools: Woodrow W. Wallace Elementary (418 students, 86% FRL); Woodrow Wallace Middle (273 students, 81% FRL) — zoned schools average 83% FRL vs 65% district-wide (18 pts higher); higher-poverty schools than district average — tighter screening recommended.
- Market conditions: 135 active listings in the ZIP; 3,244 units permitted in Kern County in 2024 (73 in 5+ unit buildings).
Forward outlook
- In year one you build about $10k of equity ($1k loan paydown + $9k appreciation (5.5% local appreciation)).
- Kern County population projected at +17% by 2050 — long-run rental-demand tailwind backs the buy-and-hold thesis.
- At projected returns (5.5% appreciation + 3.0% rent growth), your $44k cash investment doubles in ~3 years — after that, you're playing with house money.
- By year 4, paydown + projected appreciation supports a ~$33k cash-out refi (75% LTV) — recoverable capital for the next deal without selling this one.
Negotiation context
- It's been on market 16 days — a 2% lower offer ($154k) is reasonable based on typical stale-listing flexibility.
- Current owner paid $110k; 42% above their basis — modest negotiation headroom, anchor on the comps not their cost.
Risks & watch-outs
- Climate carrying-cost: severe wildfire risk; extreme-heat days projected 11→28/yr by 2055 (HVAC capex compounding) — expect insurance premiums to compound above CPI over the hold.
Questions for the listing agent
- Is there a deadline driving the sale (1031 exchange, divorce, estate, relocation)? That informs how much negotiation room exists.
- Schools are F-rated, which usually means shorter tenancies and higher turnover. Who's the typical renter profile here, and what's been the actual vacancy rate?
- What's the average days-on-market for RENTAL listings here right now (not sales)? A rising rental-DOM trend means longer vacancies and softer asking-rent achievability than the comps imply.
- What's the recent tenant-quality profile in this submarket — average credit score on applications, eviction rate, late-payment / NSF rate, and stable-employment percentage? A property-management company in the area should have these aggregated.
- How much new for-sale + rental construction is in the pipeline within 1–3 miles? Heavy new supply typically softens prices + rents 12–24 months out; constrained supply supports both.
Investment metrics
- 1% rule
- 1.08% ✓
- Cap rate
- 8.76%
- Cash-on-cash
- 8.82%
- DSCR
- 1.39
- GRM
- 7.7
CMA / ARV
- ARV (on-the-fly)
- $72,576
- Comps found
- 8
Show comp detail 8 sales within ~0.75 mi
| Address | Dist | Beds/Ba | Sqft | Sold | Price | $/sf | Match |
|---|---|---|---|---|---|---|---|
| 2410 Ronita Ln #21 | 0.08mi | 2/2.0 | 1,344 (0%) | 1mo | $33,000 | $25 | 92 |
| 2404 Clark St | 0.07mi | 2/2.0 | 1,344 (0%) | 8mo | $80,000 | $60 | 86 |
| 2617 Crestview Ave | 0.13mi | 2/2.0 | 1,248 (-7%) | 9mo | $67,500 | $54 | 70 |
| 2807 Erskine Creek Rd #55 | 0.66mi | 3/2.0 (+1) | 1,326 (-1%) | 15mo | $78,500 | $59 | 45 |
| 2401 Commercial Ave | 0.38mi | 2/2.0 | 1,200 (-11%) | 22mo | $62,000 | $52 | 42 |
| 2807 Erskine Creek Rd #90 | 0.66mi | 2/2.0 | 1,248 (-7%) | 15mo | $20,000 | $16 | 41 |
| 2418 Mason Ct | 0.65mi | 3/2.0 (+1) | 1,248 (-7%) | 17mo | $95,000 | $76 | 34 |
| 2807 Erskine Creek Rd #94 | 0.65mi | 3/2.0 (+1) | 1,430 (+6%) | 20mo | $72,000 | $50 | 34 |
Match score weights: distance 35% · size 25% · config 20% · recency 20%. Top-matched comps best support the ARV.
Projected returns pro-forma
5.55% appreciation · 3.0% rent growth · sell at horizon
- IRR
- 21.7%
- Equity multiple
- 2.40×
- Total profit
- $61,323
- Equity at exit
- $93,668
- IRR
- 20.9%
- Equity multiple
- 4.79×
- Total profit
- $165,549
- Equity at exit
- $166,189
Cash invested: $43,680 (down + closing). Projections, not guarantees.
Landlord ↔ Tenant lean methodology
- Overall (STATE)
- 18 Strongly Tenant-Friendly
- State California
- 18 Strongly Tenant-Friendly · D+13
- County
- — inherits STATE
- City
- — inherits STATE
ZIP-level market 93240
- Home prices YoY
- 1.6%
- Active inventory
- 135
- Price-to-rent
- 7.7×
Monthly cashflow live
- Estimated rent
- $1,681 medium interval (Pro) →
- Mortgage (P&I)
- −$818
- Tax from tax record
- −$124 /mo · $1,492/yr
- Insurance
- −$65
- HOA
- −$0
- Vacancy / Maint / Mgmt
- −$353
- Net cashflow
- $321
Break-even live
UW: 25.0% down · 7.5% · 30yr · 1.5% tax · 5.0% vac · 8.0% maint · 8.0% mgmt
Financing live
Cash to close
- Down payment
- $39,000
- Closing costs
- $4,680
- Reserves months
- —
- Total cash needed
- —
Loan-product check · same deal, 3 products live
Conventional
25% down · 7.5% · 30yr
- Down + closing
- —
- Monthly P&I
- —
- Monthly cashflow
- —
- DSCR
- —
- Eligible?
- —
Personal DTI + credit; lowest rate.
DSCR
20% down · 8.5% · 30yr
- Down + closing
- —
- Monthly P&I
- —
- Monthly cashflow
- —
- DSCR
- —
- Eligible?
- —
No personal income docs; deal must DSCR.
Hard money
10% down · 12.0% · 12mo
- Down + closing
- —
- Monthly P&I
- —
- Monthly cashflow
- —
- DSCR
- —
- Eligible?
- —
Short-term bridge; refi at stabilization.
Listing history 13 events
-
2026-06-18days on market $156,000 Active 16 DOM
-
2026-06-17days on market $156,000 Active 15 DOM
-
2026-06-16days on market $156,000 Active 14 DOM
-
2026-06-15days on market $156,000 Active 13 DOM
-
2026-06-14days on market $156,000 Active 11 DOM
-
2026-06-13days on market $156,000 Active 10 DOM
-
2026-06-10days on market $156,000 Active 8 DOM
-
2026-06-09days on market $156,000 Active 7 DOM
-
2026-06-08days on market $156,000 Active 6 DOM
-
2026-06-07days on market $156,000 Active 5 DOM
-
2026-06-05days on market $156,000 Active 2 DOM
-
2026-06-03remarks 699-char remark
-
2026-06-03$156,000 Active 1 DOM
ⓘ Source: listings_history table (triggers on properties + properties_extension) + one-shot
backfill from property_details.listing_events for pre-trigger history.
Tax reassessment forecast CA · Resets to sale price
- Current annual tax
- $1,492 · $124/mo
- Projected year-2 tax
- $1,492 · $124/mo
- Expected delta
- $0/yr ($0/mo · -0.0%)
ⓘ Screening estimate from a state-policy table — verify with the county assessor before closing.
Climate risk First Street
- Flood 1/10 Low FEMA zone X (unshaded) · 0% chance over 30 yrs
- Wildfire 9/10 Extreme
- Heat 6/10 Major 11 d/yr ≥100°F today · 28 d/yr by 30 yrs out
- Wind 1/10 Low
- Air quality 10/10 Extreme 24 unhealthy d/yr today · 30 by 30 yrs out
Nearby sold comps map
Loading sold comps map…
Walkable amenities ~0.75 mi
Loading nearby amenities…
Taxation est. · year 1
- Rental income
- $20,177
- − Mortgage interest
- −$8,738
- − Property taxes
- −$1,492
- − Insurance
- −$780
- − Repairs & maintenance
- −$1,614
- − Management
- −$1,614
- − Depreciation
- −$4,538
- Taxable income
- $1,400
- Est. tax owed @ 24.0%
- −$336
- After-tax cash flow
- $3,515/yr
For passive investors: Depreciation is non-cash, so a rental often shows a tax loss while cash-flowing — sheltering income. Rental losses are passive: they offset passive income freely, and up to $25,000/yr can offset ordinary (W-2) income if you actively participate and your MAGI is under $100k (phasing out to $0 by $150k); unused losses carry forward. On sale, claimed depreciation is recaptured at up to 25%, and gains may owe capital-gains tax (a 1031 exchange can defer both). Figures are a year-1 estimate at your 24.0% rate — not tax advice; consult a CPA.
Schools (NCES district)
- District
- Kernville Union Elementary
- NCES district ID
- 0619590
- Math proficiency
- 20% ▲ 4.00%
- Reading proficiency
- 37% ▲ 11.00%
- Median HH income
- $29,896
- Composite
- 25.91/100
- National rank
- #12766
- State rank
- #1128 of 1400 in CA
Livability — Lake Isabella
- Score
- 52/100
- State rank
- #999
- US rank
- #24814
Category grades
Schools grade is shown separately in the Schools card above.
Census & demographics
- Census place
- Lake Isabella, CA
- City population
- 5,622
- Population (ZIP)
- 5,622
Population outlook (Kern County) Hauer SSP2
- Today (2025)
- 947,286 people
- By 2030
- 978,984 · +3.3%
- By 2040
- 1,045,018 · +10.3%
- By 2050
- 1,105,232 · +16.7%
- By 2075
- 1,229,538 · +29.8%
- By 2100
- 1,238,059 · +30.7%
Race, ethnicity, and origin ACS 2023
- Neighborhood character
- Predominantly White (78%)
- Race & ethnicity
- White 78% Hispanic / Latino 13% Two or more races 5% Asian 2% Native American 1%
- Hispanic origin (detail)
- Mexican 11%
- Common ancestry
- Italian 3% Portuguese 2% Iranian 2%
- Foreign-born
- 5% · Canada, South Korea
- Languages at home
- 93% English-only · Spanish 4% Korean 1% Other Asian/Pacific 1%
Political lean MEDSL · Kern
- 2024 margin
- Strong R (+21.1) · D 38.2% · R 59.3% · Other 2.5%
- 2008→2024 swing
- -3.3pp toward R · 2008: -17.8pp · 2024: -21.1pp
- All cycles
- 2024: R+21.1 2020: R+10.2 2016: R+15.0 2012: R+20.9 2008: R+17.8
Not yet ingested
- Civics
- —
Market trends
- HPI YoY
- ▲ 5.55%
- Current HPI
- 341.2481
- Rent YoY
- —
- Metro
- —
- State GDP YoY
- ▲ 3.21%
- F500 in state
- 116
Industry mix (Fortune 500 HQ in CA)
| Industry | F500 HQs | Revenue |
|---|---|---|
| Technology | 27 | $1,492B |
|
||
| Financial Services | 3 | $174B |
|
||
| Retail | 3 | $44B |
|
||
| Insurance | 3 | $26B |
|
||
| Media / Entertainment | 2 | $115B |
|
||
| Pharmaceuticals / Biotech | 2 | $62B |
|
||
Price history
+41.8% since first listed2 events — show timeline
- 2026-05-27 Listed $156,000 SSMLS
- 2022-07-08 Sold (Public Records) $110,000 Public Records
Property tax history
+27.0%/yrLatest (2025): $1,492 · +2.5% YoY. Source: county tax records.
Cash-flow waterfall
monthlySold comps — $/sqft
last 12 mo · ≤1 miLoading sold comps…