 Multi-family
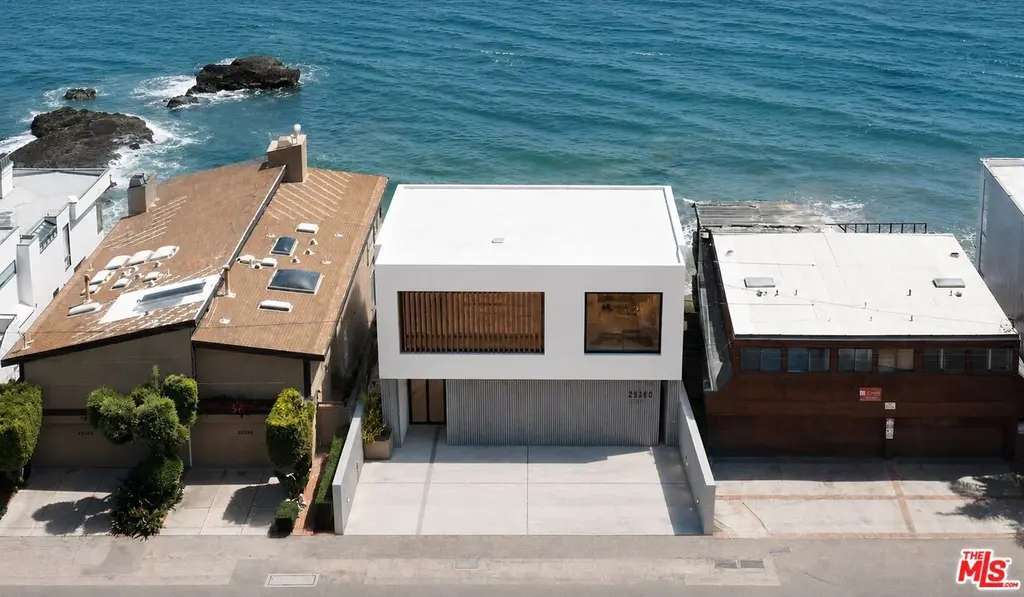
25260 Malibu Rd · Malibu, CA
Flood risk 10/10 · Severe
- FEMA flood zone
- VE
- Chance of flooding over 30 yrs
- 0.99%
- Est. flood insurance / yr
- $5,013 – $11,043
Fire risk 4/10 · Minor
- Est. fire insurance / yr
- $659 – $1,223
Heat risk 4/10 · Minor
- Hot days now (above 83°F)
- 7 days/yr
- Hot days in 30 yrs
- 19 days/yr
Wind risk 1/10 · Minimal
- Chance of severe wind over 30 yrs
- —
Air-quality risk 5/10 · Moderate
- Unhealthy air days now
- 6 days/yr
- Unhealthy air days in 30 yrs
- 8 days/yr
Risk factors via First Street. Map © Google.
Why this score? — see what drove the F grade
The composite is a weighted blend of 9 inputs, each scored 0–100. Each bar is that input's sub-score; the figure is the points it added to the 100-point composite (weight × sub-score).
- ARV discount +7.5/15.0
- Schools +6.2/10.0
- Appreciation +5.3/10.0
- Livability +2.7/5.0
- Cash flow +2.5/30.0
- Condition / age +2.5/5.0
- Rent growth +1.7/5.0
- 1% rule +0.0/10.0
- DSCR +0.0/10.0
$8,500,000
🖨 Deal sheet 📄 Offer letter ✓ Due diligence
Multi-family units
County records classify this as Multi-Family (2-4 Unit). Listing-text estimate: 1 unit. estimate disagrees with records
Listing remarks MLS
Opportunity on Malibu Road, located on one of the best sections of the beach. The property is zoned for 4 units with 3 addresses; Buyer to verify. There are 2 separate ocean view 1B/1B units with kitchens, fireplaces, high-beamed ceilings and private decks. The main house has a massive wrap-around upper deck with a built-in BBQ and a lower deck under the house. High-beamed wood ceilings and fireplaces in the great room and master bedroom. Updated kitchen and bathrooms. Hardwood floors throughout. 2 bonus/media rooms that could be additional bedrooms. 4 car garage plus 4 more parking spaces. Presently bringing in about $35K in monthly income.
Key facts
- Completed seawall
- Malibu road frontage
- Fully approved plans
Tags
Property features AI
Finance
- Other: Assessor Parcel Number 4459-016-009
Exterior
- Home design: Residential land; Zoned LCR3*
- Construction: Building plans and building permit available
- Exterior features: Lot approximately 7,863 sq ft; Coastal Commission special zoning; Located on PCH (Pacific Coast Highway) at Malibu Rd
Interior
- Interior features: Has views of Catalina, coastline, ocean, panoramic water and white water
Neighborhood map
What this means for you Summary
Snapshot
- This is a 4-bed/4.0-bath multifamily listed at $8.50M.
Deal economics
- At list price, monthly cash flow is $-30k ($-361k/yr) — negative.
- To cash-flow at today's rent, offer at most $3.19M (62.5% below list).
- To meet the 1% rule (rent ≥ 1% of price), the offer needs to be $3.39M (60.1% below list).
- Recommended offer: $3.19M (62.5% below list) — sets the bar for cash-flow.
- Cap rate 2.1% vs local median 0.7% in Malibu — top-decile yield for the area; either an underpriced asset or a hidden risk that comps aren't pricing in. Stress-test before assuming the spread holds.
Location & tenants
- Location reads 53/100 on livability (#979 in CA) — a working-class tenant base; expect higher turnover. Strengths: employment A+, schools B; Watch: housing C-, crime F, amenities F.
- Santa Monica-Malibu Unified (urban): math 61% / reading 74% proficiency, ranked #123 of 1,400 in CA (top 9%) — acceptable for families but not a draw, mixed tenant base, ~2y average lease.
- Market conditions: Rents falling (-3.4%/yr); 627 active listings in the ZIP; 7 comparable units currently listed for rent nearby; rentals lingering (median 44d on market — plan ~5-8 weeks vacancy on turnover, expect pricing pressure); 86% of comp listings sitting > 30 days — soft ceiling on asking rent; high-income renter base; 19,697 units permitted in Los Angeles County in 2024 (9,426 in 5+ unit buildings).
- At $33,873/mo this rent would consume 207% of the median local household income ($197k/yr) (locally 420% of renters already pay >50% of income on rent) — very limited rent-growth headroom before tenants either downsize or default.
Forward outlook
- In year one you build about $111k of equity ($59k loan paydown + $53k appreciation (0.6% local appreciation)).
- Los Angeles County population projected at +9% by 2050 — modest demand growth; plan on rents tracking national, not racing it.
- By year 5, paydown + projected appreciation supports a ~$543k cash-out refi (75% LTV) — recoverable capital for the next deal without selling this one.
Negotiation context
- It's been on market 21 days — a 2% lower offer ($8.37M) is reasonable based on typical stale-listing flexibility.
- 6 sale attempts since 13y ago with the ask held roughly flat each time — persistent listings suggest the price (not the market) is what's stuck; bring a comps-based counter.
- Current owner paid $7.30M; 16% above their basis — modest negotiation headroom, anchor on the comps not their cost.
Risks & watch-outs
- Watch-outs: flood insurance adds $669/mo; built in 1954 — expect roof / HVAC / electrical / plumbing capex.
- Climate carrying-cost: in FEMA flood zone VE (mandatory federal flood insurance) — expect insurance premiums to compound above CPI over the hold.
Questions for the listing agent
- What do current leases actually rent for vs. the listed asking? Can we see a recent rent roll and the last 12 months of T-12 income?
- Built in 1954 — when were the roof, HVAC, electrical panel, plumbing, and water heater last replaced?
- What's the actual annual flood-insurance premium (NFIP or private), and is the property in a SFHA with mandatory coverage?
- Is there a deadline driving the sale (1031 exchange, divorce, estate, relocation)? That informs how much negotiation room exists.
- Schools are B-rated — typically a magnet for longer-tenancy family renters. What's the average tenant stay here, and is there a school-zone premium baked into asking?
- Crime grade is F in this area — have there been break-ins, vandalism, or insurance claims at this property in the last 3 years? What carrier currently insures it and at what premium?
- The area grade is low — what's the realistic commute time and amenity access for the typical tenant pool here? Any planned neighborhood developments (good or bad) we should know about?
- What's the average days-on-market for RENTAL listings here right now (not sales)? A rising rental-DOM trend means longer vacancies and softer asking-rent achievability than the comps imply.
- What's the recent tenant-quality profile in this submarket — average credit score on applications, eviction rate, late-payment / NSF rate, and stable-employment percentage? A property-management company in the area should have these aggregated.
- How much new apartment / multifamily construction is in the pipeline within 1–3 miles? Heavy new supply (>2% of stock underway) typically softens rents 12–24 months out; light construction supports rent growth.
Investment metrics
- 1% rule
- 0.40% ✗
- Cap rate
- 2.14%
- Cash-on-cash
- -14.82%
- DSCR
- 0.34
- GRM
- 20.9
CMA / ARV
No comps found within radius.
Projected returns pro-forma
0.62% appreciation · 0.0% rent growth · sell at horizon
- IRR
- -17.6%
- Equity multiple
- 0.15×
- Total profit
- $-2,013,705
- Equity at exit
- $2,734,011
- IRR
- -12.0%
- Equity multiple
- -0.34×
- Total profit
- $-3,200,609
- Equity at exit
- $3,506,882
Cash invested: $2,380,000 (down + closing). Projections, not guarantees.
Landlord ↔ Tenant lean methodology
- Overall (STATE)
- 18 Strongly Tenant-Friendly
- State California
- 18 Strongly Tenant-Friendly · D+13
- County
- — inherits STATE
- City
- — inherits STATE
ZIP-level market 90265
- Home prices YoY
- 0.1%
- Rents YoY
- -3.4%
- Active inventory
- 627
- Price-to-rent
- 72.3×
Monthly cashflow live
- Estimated rent
- $33,873 medium interval (Pro) →
- Mortgage (P&I)
- −$44,575
- Tax from tax record
- −$8,042 /mo · $96,504/yr
- Insurance
- −$3,542
- Flood insurance flood zone
- −$669 /mo · $8,028/yr
- HOA
- −$0
- Vacancy / Maint / Mgmt
- −$7,113
- Net cashflow
- $-30,068
Break-even live
4-unit breakdown (identical units grouped — click to expand)
| Units | Beds | Baths | Est. rent |
|---|---|---|---|
| 2× units | 3 | 1 | $19,606 |
| #1 | 3 | 1 | $9,803 |
| #2 | 3 | 1 | $9,803 |
| 2× units | 1 | 1 | $14,266 |
| #3 | 1 | 1 | $7,133 |
| #4 | 1 | 1 | $7,133 |
| Total (4 units) | $33,873 | ||
UW: 25.0% down · 7.5% · 30yr · 1.5% tax · 5.0% vac · 8.0% maint · 8.0% mgmt
Financing live
Cash to close
- Down payment
- $2,125,000
- Closing costs
- $255,000
- Reserves months
- —
- Total cash needed
- —
Loan-product check · same deal, 3 products live
Conventional
25% down · 7.5% · 30yr
- Down + closing
- —
- Monthly P&I
- —
- Monthly cashflow
- —
- DSCR
- —
- Eligible?
- —
Personal DTI + credit; lowest rate.
DSCR
20% down · 8.5% · 30yr
- Down + closing
- —
- Monthly P&I
- —
- Monthly cashflow
- —
- DSCR
- —
- Eligible?
- —
No personal income docs; deal must DSCR.
Hard money
10% down · 12.0% · 12mo
- Down + closing
- —
- Monthly P&I
- —
- Monthly cashflow
- —
- DSCR
- —
- Eligible?
- —
Short-term bridge; refi at stabilization.
Rent comps 7 comps
| Address | Beds | Baths | Sqft | Rent | $/sqft | DOM | Units | Dist |
|---|---|---|---|---|---|---|---|---|
| 24942 Malibu Rd Malibu, CA | 4.0 | 3.0 | 1600 | $35,000 | $21.88 | 43d | 1 | 0.41mi |
| 24920 Malibu Rd Malibu, CA | 3.0 | 4.5 | 3375 | $49,500 | $14.67 | 43d | 1 | 0.45mi |
| 26044 Pacific Coast Hwy Malibu, CA | 4.0 | 4.0 | 2389 | $27,500 | $11.51 | 43d | 1 | 0.96mi |
| 24456 Malibu Rd Malibu, CA | 4.0 | 3.0 | 2950 | $50,000 | $16.95 | 43d | 1 | 1.02mi |
| 24246 Malibu Rd Malibu, CA | 3.0 | 3.0 | 1781 | $45,000 | $25.27 | 43d | 1 | 1.29mi |
| 24150 Malibu Rd Malibu, CA | 3.0 | 3.0 | 2714 | $22,250 | $8.20 | 43d | 1 | 1.40mi |
| 26508 Latigo Shore Dr Malibu, CA | 3.0 | 3.5 | 2817 | $45,000 | $15.97 | 24d | 1 | 1.47mi |
Listing history 14 events
-
2026-06-18days on market $8,500,000 Active 21 DOM
-
2026-06-17days on market $8,500,000 Active 20 DOM
-
2026-06-16days on market $8,500,000 Active 19 DOM
-
2026-06-15days on market $8,500,000 Active 18 DOM
-
2026-06-13days on market $8,500,000 Active 16 DOM
-
2026-06-13days on market $8,500,000 Active 15 DOM
-
2026-06-09days on market $8,500,000 Active 12 DOM
-
2026-06-08days on market $8,500,000 Active 11 DOM
-
2026-06-07days on market $8,500,000 Active 10 DOM
-
2026-06-04days on market $8,500,000 Active 7 DOM
-
2026-06-03days on market $8,500,000 Active 6 DOM
-
2026-06-02days on market $8,500,000 Active 5 DOM
-
2026-06-01days on market $8,500,000 Active 4 DOM
-
2026-05-31days on market $8,500,000 Active 3 DOM
ⓘ Source: listings_history table (triggers on properties + properties_extension) + one-shot
backfill from property_details.listing_events for pre-trigger history.
Tax reassessment forecast CA · Resets to sale price
- Current annual tax
- $96,504 · $8,042/mo
- Projected year-2 tax
- $96,504 · $8,042/mo
- Expected delta
- $0/yr ($0/mo · 0.0%)
ⓘ Screening estimate from a state-policy table — verify with the county assessor before closing.
Climate risk First Street
- Flood 10/10 Extreme FEMA zone VE · 99% chance over 30 yrs
- Wildfire 4/10 Moderate
- Heat 4/10 Moderate 7 d/yr ≥83°F today · 19 d/yr by 30 yrs out
- Wind 1/10 Low
- Air quality 5/10 Major 6 unhealthy d/yr today · 8 by 30 yrs out
Nearby sold comps map
Loading sold comps map…
Walkable amenities ~0.75 mi
Loading nearby amenities…
Taxation est. · year 1
- Rental income
- $406,476
- − Mortgage interest
- −$476,132
- − Property taxes
- −$96,504
- − Insurance
- −$50,528
- − Repairs & maintenance
- −$32,518
- − Management
- −$32,518
- − Depreciation
- −$247,273
- Taxable loss
- −$528,997
- Est. tax savings @ 24.0%
- +$126,959
- After-tax cash flow
- $-233,856/yr
For passive investors: Depreciation is non-cash, so a rental often shows a tax loss while cash-flowing — sheltering income. Rental losses are passive: they offset passive income freely, and up to $25,000/yr can offset ordinary (W-2) income if you actively participate and your MAGI is under $100k (phasing out to $0 by $150k); unused losses carry forward. On sale, claimed depreciation is recaptured at up to 25%, and gains may owe capital-gains tax (a 1031 exchange can defer both). Figures are a year-1 estimate at your 24.0% rate — not tax advice; consult a CPA.
Schools (NCES district)
- District
- Santa Monica-Malibu Unified
- NCES district ID
- 0635700
- Math proficiency
- 61% ▬ 0.00%
- Reading proficiency
- 74% ▬ 0.00%
- Median HH income
- $81,489
- Composite
- 61.58/100
- National rank
- #1535
- State rank
- #123 of 1400 in CA
Livability — Malibu
- Score
- 53/100
- State rank
- #979
- US rank
- #24630
Category grades
Schools grade is shown separately in the Schools card above.
Census & demographics
- Census place
- Malibu, CA
- County
- Los Angeles County · 9,444,647 people
- City population
- 15,918
- Metro
- Los Angeles-Long Beach-Anaheim, CA
- Population (ZIP)
- 15,918
- Household income
- $196,742
- Rent vs Own
- Severe rent burden
- 420.0
Population outlook (Los Angeles County) Hauer SSP2
- Today (2025)
- 10,940,515 people
- By 2030
- 11,256,481 · +2.9%
- By 2040
- 11,729,929 · +7.2%
- By 2050
- 11,948,407 · +9.2%
- By 2075
- 11,818,114 · +8.0%
- By 2100
- 10,842,928 · -0.9%
Race, ethnicity, and origin ACS 2023
- Neighborhood character
- Predominantly White (77%)
- Race & ethnicity
- White 77% Two or more races 10% Hispanic / Latino 9% Asian 5% Black 1%
- Hispanic origin (detail)
- Mexican 6%
- Common ancestry
- Italian 8% Scotch-Irish 3% Romanian 3%
- Foreign-born
- 16% · Canada, South Korea, China
- Languages at home
- 82% English-only · Spanish 6% Other Indo-European 6% French/Haitian/Cajun 2%
Political lean MEDSL · Los Angeles
- 2024 margin
- Solid D (+32.9) · D 64.8% · R 31.9% · Other 3.3%
- 2008→2024 swing
- -7.4pp toward R · 2008: 40.4pp · 2024: 32.9pp
- All cycles
- 2024: D+32.9 2020: D+44.2 2016: D+48.0 2012: D+40.0 2008: D+40.4
Not yet ingested
- Civics
- —
Market trends
- HPI YoY
- ▲ 0.62%
- Current HPI
- 498.5117
- Rent YoY
- ▼ -3.39%
- Metro
- Los Angeles-Long Beach-Anaheim, CA
- State GDP YoY
- ▲ 3.21%
- F500 in state
- 116
Industry mix (Fortune 500 HQ in CA)
| Industry | F500 HQs | Revenue |
|---|---|---|
| Technology | 27 | $1,492B |
|
||
| Financial Services | 3 | $174B |
|
||
| Retail | 3 | $44B |
|
||
| Insurance | 3 | $26B |
|
||
| Media / Entertainment | 2 | $115B |
|
||
| Pharmaceuticals / Biotech | 2 | $62B |
|
||
Price history
+750.0% since first listed19 events — show timeline
- 2026-05-28 Listed $8,500,000 TheMLS
- 2015-12-18 Sold (Public Records) $7,300,000 Public Records
- 2015-12-18 Sold (MLS) $7,300,000 CRMLS
- 2015-12-04 Pending — CRMLS
- 2015-09-28 Pending — CRMLS
- 2015-08-20 Listed $7,495,000 CRMLS
- 2015-07-24 Delisted — TheMLS
- 2015-06-12 Relisted — TheMLS
- 2015-06-06 Delisted — TheMLS
- 2015-04-23 Price Changed — TheMLS
- 2015-04-23 Price Changed — TheMLS
- 2015-01-27 Listed — TheMLS
- 2014-06-12 Delisted — TheMLS
- 2013-10-09 Listed — TheMLS
- 2013-09-02 Delisted — TheMLS
- 2013-08-17 Price Changed — TheMLS
- 2013-08-16 Price Changed — TheMLS
- 2013-06-21 Listed — TheMLS
- 1997-08-07 Sold (Public Records) $1,000,000 Public Records
Property tax history
+11.6%/yrLatest (2025): $96,504 · -2.1% YoY. Source: county tax records.
Cash-flow waterfall
monthlySold comps — $/sqft
last 12 mo · ≤1 miLoading sold comps…