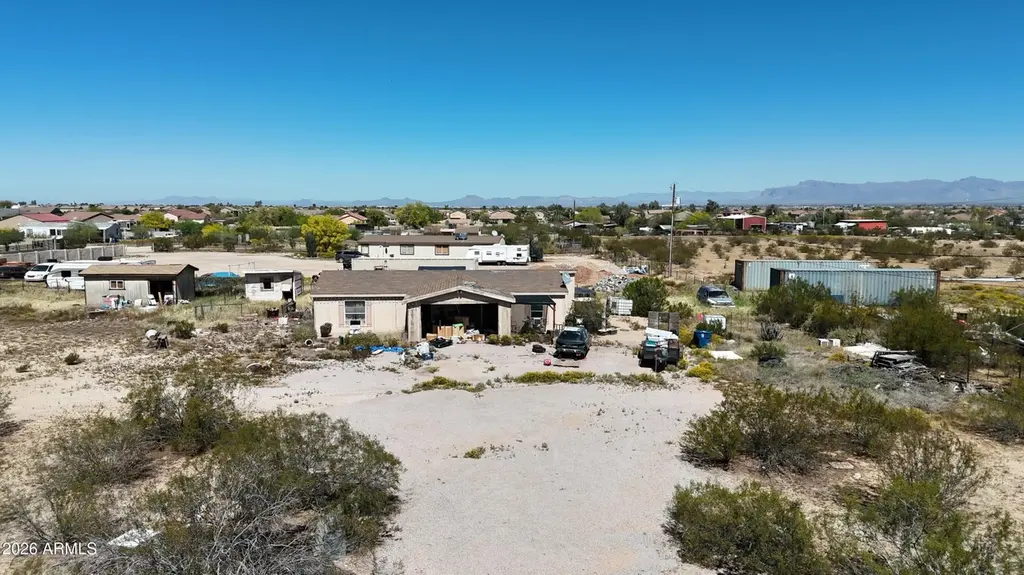
2738 W Rolls Rd · San Tan Valley, AZ
Flood risk 1/10 · Minimal
- FEMA flood zone
- X (unshaded)
- Chance of flooding over 30 yrs
- 0.0%
- Est. flood insurance / yr
- $507 – $1,088
Fire risk 6/10 · Moderate
- Est. fire insurance / yr
- $610 – $1,132
Heat risk 9/10 · Severe
- Hot days now (above 111°F)
- 7 days/yr
- Hot days in 30 yrs
- 19 days/yr
Wind risk 1/10 · Minimal
- Chance of severe wind over 30 yrs
- —
Air-quality risk 2/10 · Minimal
- Unhealthy air days now
- 1 days/yr
- Unhealthy air days in 30 yrs
- 1 days/yr
Risk factors via First Street. Map © Google.
Why this score? — see what drove the D+ grade
The composite is a weighted blend of 9 inputs, each scored 0–100. Each bar is that input's sub-score; the figure is the points it added to the 100-point composite (weight × sub-score).
- ARV discount +15.0/15.0
- Appreciation +10.0/10.0
- Cash flow +9.4/30.0
- Livability +2.7/5.0
- DSCR +2.6/10.0
- Rent growth +2.5/5.0
- Condition / age +2.5/5.0
- Schools +1.8/10.0
- 1% rule +1.5/10.0
$290,000
🖨 Deal sheet 📄 Offer letter ✓ Due diligence
Listing remarks MLS
Exceptional investment opportunity in the highly desirable Chandler Heights Ranches area, surrounded by newly built custom homes selling for $1M+. This NO HOA property sits on an expansive 54,886 sq ft corner lot, offering rare flexibility and multiple access points with two separate gates--ideal for future development, RV storage, or expanded use. The existing home features a split floor plan, vaulted ceilings, and abundant natural light from a kitchen skylight. With a large pantry and interior washer/dryer hookups, the structure provides a solid footprint for renovation. This property presents multiple value-add strategies: renovate and occupy, hold as a rental, or take advantage of the oversized lot to build a custom dream home while converting the existing residence into a guest house or casita (buyer to verify). The surrounding growth and high-end construction make this a prime candidate for redevelopment or long-term appreciation.
Key facts
- 1.27 acre lot
- Built 1999
- Listed 61 days
Neighborhood map
What this means for you Summary
Snapshot
- This is a 3-bed/2.0-bath manufactured listed at $290k.
Deal economics
- At list price, monthly cash flow is $-209 ($-3k/yr) — negative.
- To cash-flow at today's rent, offer at most $253k (12.7% below list).
- To meet the 1% rule (rent ≥ 1% of price), the offer needs to be $190k (34.6% below list).
- Recommended offer: $190k (34.6% below list) — sets the bar for 1% rule.
- Cap rate 5.4% vs local median 3.2% in San Tan Valley — top-decile yield for the area; either an underpriced asset or a hidden risk that comps aren't pricing in. Stress-test before assuming the spread holds.
Location & tenants
- Location reads 54/100 on livability (#282 in AZ) — a working-class tenant base; expect higher turnover. Strengths: housing A+, employment B+; Watch: crime D+, schools D, amenities F.
- Florence Unified School District (4437) (rural): math 16% / reading 24% proficiency, ranked #178 of 249 in AZ (top 72%) — low school quality limits family demand, transient renter base, plan for 1-2y turnover.
- Market conditions: 475 active listings in the ZIP; 29 comparable units currently listed for rent nearby; rentals leasing fast (median 13d on market — plan ~1-2 weeks tenant-placement turnaround); 9,504 units permitted in Pinal County in 2024 (776 in 5+ unit buildings).
Forward outlook
- In year one you build about $31k of equity ($2k loan paydown + $29k appreciation (10.0% local appreciation)).
- By year 2, paydown + projected appreciation supports a ~$50k cash-out refi (75% LTV) — recoverable capital for the next deal without selling this one.
Negotiation context
- It's been on market 61 days — a 6% lower offer ($273k) is reasonable based on typical stale-listing flexibility.
- 12 sale attempts since 25y ago with the ask held roughly flat each time — persistent listings suggest the price (not the market) is what's stuck; bring a comps-based counter.
- Current owner paid $72k; list at $290k implies a 303% gain — meaningful room to come down on a strong offer.
Risks & watch-outs
- Climate carrying-cost: major wildfire risk; extreme-heat days projected 7→19/yr by 2055 (HVAC capex compounding) — expect insurance premiums to compound above CPI over the hold.
Questions for the listing agent
- What do current leases actually rent for vs. the listed asking? Can we see a recent rent roll and the last 12 months of T-12 income?
- It's been on market 61 days. Have you received any prior offers? Is the seller open to a 35% concession, seller financing, or rate buy-down credit?
- Why hasn't it sold? Are there any deal-killer items the seller is aware of (foundation, flood, title, zoning, code violations)?
- Is there a deadline driving the sale (1031 exchange, divorce, estate, relocation)? That informs how much negotiation room exists.
- Schools are D-rated, which usually means shorter tenancies and higher turnover. Who's the typical renter profile here, and what's been the actual vacancy rate?
- Crime grade is D in this area — have there been break-ins, vandalism, or insurance claims at this property in the last 3 years? What carrier currently insures it and at what premium?
- The area grade is low — what's the realistic commute time and amenity access for the typical tenant pool here? Any planned neighborhood developments (good or bad) we should know about?
- What's the average days-on-market for RENTAL listings here right now (not sales)? A rising rental-DOM trend means longer vacancies and softer asking-rent achievability than the comps imply.
- What's the recent tenant-quality profile in this submarket — average credit score on applications, eviction rate, late-payment / NSF rate, and stable-employment percentage? A property-management company in the area should have these aggregated.
- How much new for-sale + rental construction is in the pipeline within 1–3 miles? Heavy new supply typically softens prices + rents 12–24 months out; constrained supply supports both.
Investment metrics
- 1% rule
- 0.65% ✗
- Cap rate
- 5.43%
- Cash-on-cash
- -3.08%
- DSCR
- 0.86
- GRM
- 12.7
CMA / ARV
- ARV (median comp)
- $472,500
- List price
- $290,000
- Delta
- -38.62%
- Verdict
- UNDERPRICED
- Comps
- 2 within 1.0 mi
Show comp detail 3 sales within ~0.75 mi
| Address | Dist | Beds/Ba | Sqft | Sold | Price | $/sf | Match |
|---|---|---|---|---|---|---|---|
| 31555 N Royce Rd | 0.19mi | 3/2.0 | 1,508 (+2%) | 15mo | $450,000 | $298 | 76 |
| 3682 W Rolls Rd | 0.61mi | 3/2.0 | 1,625 (+10%) | 3mo | $445,000 | $274 | 53 |
| 3500 W Phillips Rd | 0.54mi | 3/2.0 | 1,664 (+12%) | 5mo | $500,000 | $300 | 51 |
Match score weights: distance 35% · size 25% · config 20% · recency 20%. Top-matched comps best support the ARV.
Projected returns pro-forma
10.0% appreciation · 3.0% rent growth · sell at horizon
- IRR
- 22.1%
- Equity multiple
- 2.78×
- Total profit
- $144,502
- Equity at exit
- $261,255
- IRR
- 19.8%
- Equity multiple
- 6.37×
- Total profit
- $435,677
- Equity at exit
- $563,406
Cash invested: $81,200 (down + closing). Projections, not guarantees.
Landlord ↔ Tenant lean methodology
- Overall (STATE)
- 87 Strongly Landlord-Friendly
- State Arizona
- 87 Strongly Landlord-Friendly · R+3
- County
- — inherits STATE
- City
- — inherits STATE
ZIP-level market 85144
- Home prices YoY
- 7.2%
- Active inventory
- 475
- Price-to-rent
- 12.7×
Monthly cashflow live
- Estimated rent
- $1,897 high interval (Pro) →
- Mortgage (P&I)
- −$1,521
- Tax from tax record
- −$65 /mo · $785/yr
- Insurance
- −$121
- HOA
- −$0
- Vacancy / Maint / Mgmt
- −$398
- Net cashflow
- $-209
Break-even live
UW: 25.0% down · 7.5% · 30yr · 1.5% tax · 5.0% vac · 8.0% maint · 8.0% mgmt
Financing live
Cash to close
- Down payment
- $72,500
- Closing costs
- $8,700
- Reserves months
- —
- Total cash needed
- —
Loan-product check · same deal, 3 products live
Conventional
25% down · 7.5% · 30yr
- Down + closing
- —
- Monthly P&I
- —
- Monthly cashflow
- —
- DSCR
- —
- Eligible?
- —
Personal DTI + credit; lowest rate.
DSCR
20% down · 8.5% · 30yr
- Down + closing
- —
- Monthly P&I
- —
- Monthly cashflow
- —
- DSCR
- —
- Eligible?
- —
No personal income docs; deal must DSCR.
Hard money
10% down · 12.0% · 12mo
- Down + closing
- —
- Monthly P&I
- —
- Monthly cashflow
- —
- DSCR
- —
- Eligible?
- —
Short-term bridge; refi at stabilization.
Rent comps 29 comps
| Address | Beds | Baths | Sqft | Rent | $/sqft | DOM | Units | Dist |
|---|---|---|---|---|---|---|---|---|
| 2781 W Mira Dr San Tan Valley, AZ | 3.0 | 2.0 | 1115 | $1,825 | $1.64 | 2d | 1 | 0.50mi |
| 2683 W Kristina Ave San Tan Valley, AZ | 3.0 | 2.0 | 1410 | $1,850 | $1.31 | 43d | 1 | 0.56mi |
| 2306 W Kristina Ave San Tan Valley, AZ | 4.0 | 2.0 | 1464 | $1,650 | $1.13 | 24d | 1 | 0.58mi |
| 2125 W Goldmine Mountain Dr Unit 1546392P San Tan Valley, AZ | 3.0 | 2.0 | 1593 | $3,899 | $2.45 | 12d | 1 | 0.74mi |
| 2060 W Goldmine Mountain Dr San Tan Valley, AZ | 4.0 | 2.0 | 1869 | $2,181 | $1.17 | 24d | 1 | 0.78mi |
| 1533 W Sabel Ct San Tan Valley, AZ | 4.0 | 2.0 | 1870 | $2,145 | $1.15 | 5d | 1 | 0.86mi |
| 32449 N Gary Rd San Tan Valley, AZ | 1.0–3.0 | 1.0–2.0 | 1072 | $2,465 | $2.30 | 1d | 72 | 0.96mi |
| 2061 W Daniel Rd Unit 2 Queen Creek, AZ | 3.0 | 2.0 | 1600 | $1,850 | $1.16 | 12d | 1 | 0.98mi |
| 33053 N North Butte Dr San Tan Valley, AZ | 4.0 | 2.0 | 1520 | $1,985 | $1.31 | 3d | 1 | 0.98mi |
| 2460 W Tanner Ranch Rd San Tan Valley, AZ | 4.0 | 2.0 | 1520 | $1,980 | $1.30 | 1d | 1 | 0.98mi |
| 33024 N Madison Way Dr San Tan Valley, AZ | 3.0 | 2.0 | 1500 | $1,700 | $1.13 | 14d | 1 | 1.00mi |
| 33082 N Cat Hills Ave San Tan Valley, AZ | 3.0 | 2.0 | 1703 | $1,695 | $1.00 | 5d | 1 | 1.01mi |
| 33082 N Cat Hills Ave San Tan Valley, AZ | 3.0 | 2.0 | 1704 | $1,795 | $1.05 | 17d | 1 | 1.01mi |
| 2029 W Allens Peak Dr San Tan Valley, AZ | 4.0 | 2.0 | 1685 | $1,980 | $1.18 | 2d | 1 | 1.02mi |
| 1469 W Virgil Dr San Tan Valley, AZ | 3.0 | 2.0 | 1360 | $2,145 | $1.58 | 20d | 1 | 1.02mi |
| 1469 W Virgil Dr San Tan Valley, AZ | 3.0 | 2.0 | 1360 | $2,145 | $1.58 | 1d | 1 | 1.02mi |
| 3162 W Sunshine Butte Dr San Tan Valley, AZ | 4.0 | 2.0 | 1600 | $1,850 | $1.16 | 21d | 1 | 1.06mi |
| 3560 W Mesquite Ave San Tan Valley, AZ | 3.0 | 2.0 | 1453 | $1,750 | $1.20 | 11d | 1 | 1.08mi |
| 3194 W Tanner Ranch Rd San Tan Valley, AZ | 2.0 | 2.0 | 1036 | $1,639 | $1.58 | 43d | 1 | 1.12mi |
| 3194 W Tanner Ranch Rd San Tan Valley, AZ | 2.0 | 2.0 | 1036 | $1,499 | $1.45 | 5d | 1 | 1.12mi |
| 2924 W Allens Peak Dr San Tan Valley, AZ | 3.0 | 2.0 | 1765 | $1,880 | $1.07 | 2d | 1 | 1.13mi |
| 2924 W Allens Peak Dr San Tan Valley, AZ | 3.0 | 2.0 | 1765 | $1,955 | $1.11 | 10d | 1 | 1.13mi |
| 1847 W Desert Seasons Dr San Tan Valley, AZ | 4.0 | 2.0 | 1679 | $1,695 | $1.01 | 21d | 1 | 1.20mi |
| 2699 W Camp River Rd San Tan Valley, AZ | 3.0 | 2.0 | 1766 | $1,975 | $1.12 | 43d | 1 | 1.21mi |
| 1868 W Desert Seasons Dr San Tan Valley, AZ | 4.0 | 2.0 | 1678 | $1,950 | $1.16 | 20d | 1 | 1.24mi |
| 1814 W Desert Hills Dr San Tan Valley, AZ | 4.0 | 2.0 | 1541 | $1,895 | $1.23 | 43d | 1 | 1.28mi |
| 3809 W Five Mile Peak Dr San Tan Valley, AZ | 3.0 | 2.0 | 1343 | $1,895 | $1.41 | 5d | 1 | 1.43mi |
| 900 W Desert Canyon Dr San Tan Valley, AZ | 4.0 | 2.0 | 1614 | $1,955 | $1.21 | 24d | 1 | 1.48mi |
| 33023 N Quarry Hills Dr San Tan Valley, AZ | 3.0 | 2.0 | 1806 | $1,999 | $1.11 | 11d | 1 | 1.50mi |
Listing history 39 events
-
2026-06-18days on market $290,000 Active 61 DOM
-
2026-06-17days on market $290,000 Active 60 DOM
-
2026-06-16days on market $290,000 Active 59 DOM
-
2026-06-15days on market $290,000 Active 58 DOM
-
2026-06-13days on market $290,000 Active 56 DOM
-
2026-06-13days on market $290,000 Active 55 DOM
-
2026-06-09days on market $290,000 Active 52 DOM
-
2026-06-08days on market $290,000 Active 51 DOM
-
2026-06-07days on market $290,000 Active 50 DOM
-
2026-06-04days on market $290,000 Active 47 DOM
-
2026-06-03days on market $290,000 Active 46 DOM
-
2026-06-02days on market $290,000 Active 45 DOM
-
2026-06-01days on market $290,000 Active 44 DOM
-
2026-05-31days on market $290,000 Active 43 DOM
-
2026-05-05status Active 956-char remark
Show marketing remark (956 chars)
Exceptional investment opportunity in the highly desirable Chandler Heights Ranches area, surrounded by newly built custom homes selling for $1M+. This NO HOA property sits on an expansive 54,886 sq ft corner lot, offering rare flexibility and multiple access points with two separate gates--ideal for future development, RV storage, or expanded use. The existing home features a split floor plan, vaulted ceilings, and abundant natural light from a kitchen skylight. With a large pantry and interior washer/dryer hookups, the structure provides a solid footprint for renovation. This property presents multiple value-add strategies: renovate and occupy, hold as a rental, or take advantage of the oversized lot to build a custom dream home while converting the existing residence into a guest house or casita (buyer to verify). The surrounding growth and high-end construction make this a prime candidate for redevelopment or long-term appreciation.
-
2026-04-23historical Under Contract Accepting Backups 956-char remark
Show marketing remark (956 chars)
Exceptional investment opportunity in the highly desirable Chandler Heights Ranches area, surrounded by newly built custom homes selling for $1M+. This NO HOA property sits on an expansive 54,886 sq ft corner lot, offering rare flexibility and multiple access points with two separate gates--ideal for future development, RV storage, or expanded use. The existing home features a split floor plan, vaulted ceilings, and abundant natural light from a kitchen skylight. With a large pantry and interior washer/dryer hookups, the structure provides a solid footprint for renovation. This property presents multiple value-add strategies: renovate and occupy, hold as a rental, or take advantage of the oversized lot to build a custom dream home while converting the existing residence into a guest house or casita (buyer to verify). The surrounding growth and high-end construction make this a prime candidate for redevelopment or long-term appreciation.
-
2026-04-18$300,000 Active 956-char remark
Show marketing remark (956 chars)
Exceptional investment opportunity in the highly desirable Chandler Heights Ranches area, surrounded by newly built custom homes selling for $1M+. This NO HOA property sits on an expansive 54,886 sq ft corner lot, offering rare flexibility and multiple access points with two separate gates--ideal for future development, RV storage, or expanded use. The existing home features a split floor plan, vaulted ceilings, and abundant natural light from a kitchen skylight. With a large pantry and interior washer/dryer hookups, the structure provides a solid footprint for renovation. This property presents multiple value-add strategies: renovate and occupy, hold as a rental, or take advantage of the oversized lot to build a custom dream home while converting the existing residence into a guest house or casita (buyer to verify). The surrounding growth and high-end construction make this a prime candidate for redevelopment or long-term appreciation.
-
2017-07-16historical
-
2017-06-18status Active
-
2017-06-08historical Under Contract Accepting Backups
-
2017-05-30$130,000 Active
-
2010-04-30soldstatus $72,000 Closed
-
2010-04-17status Pending
-
2010-04-02$74,900 Active
-
2009-07-20historical
-
2008-12-16$89,900
-
2008-10-22historical
-
2008-06-30$89,900
-
2005-11-01soldstatus $115,000
-
2005-09-29historical
-
2005-06-30$190,000
-
2003-10-04historical
-
2003-08-09$107,000
-
2002-06-02historical
-
2002-05-02$170,000
-
2002-04-25historical
-
2002-02-08$79,900
-
2002-01-14historical
-
2001-08-14$99,000
ⓘ Source: listings_history table (triggers on properties + properties_extension) + one-shot
backfill from property_details.listing_events for pre-trigger history.
Tax reassessment forecast AZ · Resets to sale price
- Current annual tax
- $785 · $65/mo
- Projected year-2 tax
- $1,914 · $160/mo
- Expected delta
- +$1,129/yr (+$94/mo · 143.9%)
ⓘ Screening estimate from a state-policy table — verify with the county assessor before closing.
Climate risk First Street
- Flood 1/10 Low FEMA zone X (unshaded) · 0% chance over 30 yrs
- Wildfire 6/10 Major
- Heat 9/10 Extreme 7 d/yr ≥111°F today · 19 d/yr by 30 yrs out
- Wind 1/10 Low
- Air quality 2/10 Low 1 unhealthy d/yr today · 1 by 30 yrs out
Nearby sold comps map
Loading sold comps map…
Walkable amenities ~0.75 mi
Loading nearby amenities…
Taxation est. · year 1
- Rental income
- $22,761
- − Mortgage interest
- −$16,245
- − Property taxes
- −$785
- − Insurance
- −$1,450
- − Repairs & maintenance
- −$1,821
- − Management
- −$1,821
- − Depreciation
- −$8,436
- Taxable loss
- −$7,796
- Est. tax savings @ 24.0%
- +$1,871
- After-tax cash flow
- $-632/yr
For passive investors: Depreciation is non-cash, so a rental often shows a tax loss while cash-flowing — sheltering income. Rental losses are passive: they offset passive income freely, and up to $25,000/yr can offset ordinary (W-2) income if you actively participate and your MAGI is under $100k (phasing out to $0 by $150k); unused losses carry forward. On sale, claimed depreciation is recaptured at up to 25%, and gains may owe capital-gains tax (a 1031 exchange can defer both). Figures are a year-1 estimate at your 24.0% rate — not tax advice; consult a CPA.
Schools (NCES district)
- District
- Florence Unified School District (4437)
- NCES district ID
- 0402920
- Math proficiency
- 16% ▼ -11.00%
- Reading proficiency
- 24% ▼ -7.00%
- Median HH income
- $54,426
- Composite
- 18.31/100
- National rank
- #8950
- State rank
- #178 of 249 in AZ
Livability — San Tan Valley
- Score
- 54/100
- State rank
- #282
- US rank
- #24192
Category grades
Schools grade is shown separately in the Schools card above.
Census & demographics
- Census place
- San Tan Valley, AZ
Population outlook (Pinal County) Hauer SSP2
- Today (2025)
- 437,574 people
- By 2030
- 446,903 · +2.1%
- By 2040
- 452,589 · +3.4%
- By 2050
- 444,126 · +1.5%
- By 2075
- 430,300 · -1.7%
- By 2100
- 393,536 · -10.1%
Not yet ingested
- Political lean
- —
- Race & ethnicity
- —
- Common origin
- —
- Civics
- —
Market trends
- HPI YoY
- ▲ 24.94%
- Current HPI
- 372.52
- Rent YoY
- —
- Metro
- —
- State GDP YoY
- ▲ 4.54%
- F500 in state
- 20
Industry mix (Fortune 500 HQ in AZ)
| Industry | F500 HQs | Revenue |
|---|---|---|
| Technology | 2 | $13B |
|
||
| Mining / Metals | 1 | $23B |
|
||
| Environmental Services | 1 | $16B |
|
||
| Metals / Steel | 1 | $14B |
|
||
| Technology Distribution | 1 | $9B |
|
||
| Homebuilding | 1 | $8B |
|
||
Price history
+203.0% since first listed25 events — show timeline
- 2026-05-05 Relisted — ARMLS
- 2026-04-23 Contingent — ARMLS
- 2026-04-18 Listed $300,000 ARMLS
- 2017-07-16 Listing Removed — ARMLS
- 2017-06-18 Relisted — ARMLS
- 2017-06-08 Contingent — ARMLS
- 2017-05-30 Listed $130,000 ARMLS
- 2010-04-30 Sold (MLS) $72,000 ARMLS
- 2010-04-17 Pending — ARMLS
- 2010-04-02 Listed $74,900 ARMLS
- 2009-07-20 Listing Removed — ARMLS
- 2008-12-16 Listed $89,900 ARMLS
- 2008-10-22 Listing Removed — ARMLS
- 2008-06-30 Listed $89,900 ARMLS
- 2005-11-01 Sold (Public Records) $115,000 Public Records
- 2005-09-29 Listing Removed — ARMLS
- 2005-06-30 Listed $190,000 ARMLS
- 2003-10-04 Listing Removed — ARMLS
- 2003-08-09 Listed $107,000 ARMLS
- 2002-06-02 Listing Removed — ARMLS
- 2002-05-02 Listed $170,000 ARMLS
- 2002-04-25 Listing Removed — ARMLS
- 2002-02-08 Listed $79,900 ARMLS
- 2002-01-14 Listing Removed — ARMLS
- 2001-08-14 Listed $99,000 ARMLS
Property tax history
-1.6%/yrLatest (2025): $785 · +2.1% YoY. Source: county tax records.
Cash-flow waterfall
monthlySold comps — $/sqft
last 12 mo · ≤1 miLoading sold comps…