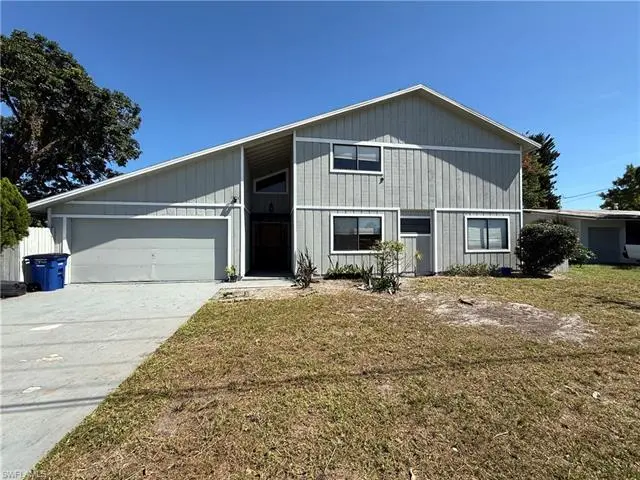
4930 Orange Grove Blvd · North Fort Myers, FL
Flood risk 7/10 · Major
- FEMA flood zone
- X (shaded)
- Chance of flooding over 30 yrs
- 0.76%
- Est. flood insurance / yr
- $507 – $1,088
Fire risk 1/10 · Minimal
- Est. fire insurance / yr
- $947 – $1,759
Heat risk 10/10 · Severe
- Hot days now (above 106°F)
- 7 days/yr
- Hot days in 30 yrs
- 30 days/yr
Wind risk 10/10 · Severe
- Chance of severe wind over 30 yrs
- 99.0%
Air-quality risk 2/10 · Minimal
- Unhealthy air days now
- 1 days/yr
- Unhealthy air days in 30 yrs
- 1 days/yr
Risk factors via First Street. Map © Google.
Why this score? — see what drove the D+ grade
The composite is a weighted blend of 9 inputs, each scored 0–100. Each bar is that input's sub-score; the figure is the points it added to the 100-point composite (weight × sub-score).
- Cash flow +15.9/30.0
- ARV discount +12.3/15.0
- DSCR +4.9/10.0
- 1% rule +4.1/10.0
- Schools +4.1/10.0
- Livability +3.7/5.0
- Condition / age +2.5/5.0
- Rent growth +2.0/5.0
- Appreciation +0.0/10.0
$290,000
🖨 Deal sheet (PDF) 📄 Offer letter ✓ Due diligence
Listing remarks
INVESTOR OPPORTUNITY! Spacious single-family home located in Fort Myers featuring 4 bedrooms, 2 bathrooms, and a 2-car garage. The home offers an open and airy floor plan with vaulted ceilings, loft-style architectural elements, and abundant natural light throughout. The main living area flows seamlessly into the kitchen, which includes a breakfast bar, ample cabinetry, and overlooks the living and dining spaces—ideal for everyday living and entertaining. Sliding glass doors open to a rear deck, extending the living space outdoors. Bedrooms are generously sized with laminate flooring, ceiling fans, and closets for storage. Bathrooms have been updated with modern vanities, tiled shower
Key facts
- Ample cabinetry
- Vaulted ceilings
- Rear deck
Tags
Property features AI
Finance
- Other: Zoning: RS-1; Lot acreage approximately 0.204 acres; Lot dimensions source: Property Appraiser Office; Irregular lot dimensions (front 30'); Directions: Pondella Dr to Orange Grove Blvd south; property on left
- HOA & community: Non-gated community; No HOA maintenance; No community amenities
Exterior
- Parking: Attached 2-car garage; 2+ parking spaces
- Utilities: Central water; Central sewer; Cable available
- Home design: Single-family residence; 2-story home; Residential property in North Fort Myers
- Construction: Built in 1986; Concrete block construction; Wood siding exterior finish; Shingle roof; Single-hung windows
- Exterior features: Landscaped area; Irregular-shaped lot; Public road access; Rear exposure to the east
Interior
- Kitchen: Pantry; Range; Microwave; Refrigerator/Freezer
- Bedrooms: 4 bedrooms; First-floor bedroom
- Flooring: Laminate flooring; Tile flooring
- Bathrooms: 2 full bathrooms; Master bath with shower (shower only)
- Heating & cooling: Central electric heat; Central electric cooling
- Interior features: Great room floor plan; Split bedroom layout; Den / study; See remarks for additional interior details; Unfurnished
- Laundry & utility: See remarks for equipment/utility details
Neighborhood map
What this means for you Summary
Snapshot
- This is a 4-bed/2.0-bath single-family listed at $290k.
Deal economics
- At list price, monthly cash flow is $71 ($849/yr) — positive.
- The deal already cash-flows at list — no discount required.
- To meet the 1% rule (rent ≥ 1% of price), the offer needs to be $263k (9.4% below list).
- Recommended offer: $263k (9.4% below list) — sets the bar for 1% rule.
- Cap rate 6.9% vs local median 3.6% in North Fort Myers — top-decile yield for the area; either an underpriced asset or a hidden risk that comps aren't pricing in. Stress-test before assuming the spread holds.
Location & tenants
- Location reads 74/100 on livability (#269 in FL, #4,409 nationally) — a middle-class / working-renter tenant base. Strengths: cost of living A+, housing A+, health & safety A+; Watch: employment C-, amenities F, commute F.
- Lee (suburban): math 47% / reading 50% proficiency, ranked #42 of 73 in FL (top 58%) — families likely to look elsewhere, expect single-tenant / working-renter base with shorter leases.
- Zoned schools: Gulf Elementary School (math 70% / reading 65%, grade B+, #435 of 2,144 statewide, top 21%, 1,231 students, 38% FRL); Challenger Middle School (math 59% / reading 56%, grade B, #157 of 571 statewide, top 28%, 1,124 students, 50% FRL); Ida S. Baker High School (math 44% / reading 47%, grade D-, #223 of 667 statewide, top 34%, 1,933 students, 39% FRL) — zoned schools average 42% FRL vs 57% district-wide (15 pts lower); this property's tenant base skews higher-income than the district average.
- Market conditions: Rents soft (-1.9%/yr); 477 active listings in the ZIP; 25 comparable units currently listed for rent nearby; rentals at typical pace (median 23d on market — plan ~3-4 weeks tenant-placement turnaround); 15,411 units permitted in Lee County in 2024 (4,686 in 5+ unit buildings).
- At $2,626/mo this rent would consume 55% of the median local household income ($57k/yr) (locally 468% of renters already pay >50% of income on rent) — very limited rent-growth headroom before tenants either downsize or default.
Forward outlook
- Local home prices are declining (-3.0%/yr); year-one equity from $2k of loan paydown is wiped out by about $9k of value loss. Plan a longer hold.
- Lee County population projected at +44% by 2050 — long-run rental-demand tailwind backs the buy-and-hold thesis.
Negotiation context
- Only 10 days on market — expect competitive offers; lowballing is unlikely to land.
- 11 sale attempts since 8y ago; this cycle's ask has dropped $59k (17%) from the opening price — seller is motivated, your offer sets the floor, not the list.
- Current owner paid $100; list at $290k implies a 289900% gain — meaningful room to come down on a strong offer.
Risks & watch-outs
- Watch-outs: flood insurance adds $66/mo.
- Climate carrying-cost: major flood risk; severe wind risk, 99% chance of damaging wind over 30y; extreme-heat days projected 7→30/yr by 2055 (HVAC capex compounding) — expect insurance premiums to compound above CPI over the hold.
Questions for the listing agent
- What's the actual annual flood-insurance premium (NFIP or private), and is the property in a SFHA with mandatory coverage?
- Is there a deadline driving the sale (1031 exchange, divorce, estate, relocation)? That informs how much negotiation room exists.
- The area grade is low — what's the realistic commute time and amenity access for the typical tenant pool here? Any planned neighborhood developments (good or bad) we should know about?
- What's the average days-on-market for RENTAL listings here right now (not sales)? A rising rental-DOM trend means longer vacancies and softer asking-rent achievability than the comps imply.
- What's the recent tenant-quality profile in this submarket — average credit score on applications, eviction rate, late-payment / NSF rate, and stable-employment percentage? A property-management company in the area should have these aggregated.
- How much new for-sale + rental construction is in the pipeline within 1–3 miles? Heavy new supply typically softens prices + rents 12–24 months out; constrained supply supports both.
Investment metrics
- 1% rule
- 0.91% ✗
- Cap rate
- 6.86%
- Cash-on-cash
- 2.03%
- DSCR
- 1.09
- GRM
- 9.2
CMA / ARV
- ARV (on-the-fly)
- $324,837
- Comps found
- 4
Show comp detail 4 sales within ~0.75 mi
| Address | Dist | Beds/Ba | Sqft | Sold | Price | $/sf | Match |
|---|---|---|---|---|---|---|---|
| 13671 Willow Bridge Dr | 0.31mi | 4/2.0 | 2,113 (+3%) | 10mo | $335,000 | $159 | 71 |
| 9282 Palm Island Cir | 0.44mi | 3/2.0 (-1) | 2,007 (-2%) | 2mo | $445,000 | $222 | 70 |
| 712 Camellia Dr | 0.41mi | 4/3.0 | 1,938 (-5%) | 20mo | $222,500 | $115 | 51 |
| 695 July Cir | 0.52mi | 3/2.0 (-1) | 2,010 (-2%) | 24mo | $310,000 | $154 | 48 |
Match score weights: distance 35% · size 25% · config 20% · recency 20%. Top-matched comps best support the ARV.
Projected returns pro-forma
-3.0% appreciation · 0.0% rent growth · sell at horizon
- IRR
- -18.0%
- Equity multiple
- 0.38×
- Total profit
- $-50,144
- Equity at exit
- $43,240
- IRR
- -17.5%
- Equity multiple
- 0.17×
- Total profit
- $-67,445
- Equity at exit
- $25,074
Cash invested: $81,200 (down + closing). Projections, not guarantees.
Landlord ↔ Tenant lean methodology
- Overall (STATE)
- 87 Strongly Landlord-Friendly
- State Florida
- 87 Strongly Landlord-Friendly · R+3
- County
- — inherits STATE
- City
- — inherits STATE
ZIP-level market 33903
- Rents YoY
- -1.9%
- Active inventory
- 477
- Price-to-rent
- 9.2×
Monthly cashflow live
- Estimated rent
- $2,626 high interval (Pro) →
- Mortgage (P&I)
- −$1,521
- Tax from tax record
- −$296 /mo · $3,548/yr
- Insurance
- −$121
- Flood insurance flood zone
- −$66 /mo · $798/yr
- HOA
- −$0
- Vacancy / Maint / Mgmt
- −$551
- Net cashflow
- $71
Break-even live
Sensitivity live
| Price | -10% $235 | -5% $153 | +0% $71 | +5% $-11 | +10% $-93 |
|---|---|---|---|---|---|
| Rent | -10% $-137 | -5% $-33 | +0% $71 | +5% $174 | +10% $278 |
| Rate | -1.0pp $217 | -0.5pp $144 | base $71 | +0.5pp $-4 | +1.0pp $-81 |
UW: 25.0% down · 7.5% · 30yr · 1.5% tax · 5.0% vac · 8.0% maint · 8.0% mgmt
Financing live
Cash to close
- Down payment
- $72,500
- Closing costs
- $8,700
- Reserves months
- —
- Total cash needed
- —
Loan-product check · same deal, 3 products live
Conventional
25% down · 7.5% · 30yr
- Down + closing
- —
- Monthly P&I
- —
- Monthly cashflow
- —
- DSCR
- —
- Eligible?
- —
Personal DTI + credit; lowest rate.
DSCR
20% down · 8.5% · 30yr
- Down + closing
- —
- Monthly P&I
- —
- Monthly cashflow
- —
- DSCR
- —
- Eligible?
- —
No personal income docs; deal must DSCR.
Hard money
10% down · 12.0% · 12mo
- Down + closing
- —
- Monthly P&I
- —
- Monthly cashflow
- —
- DSCR
- —
- Eligible?
- —
Short-term bridge; refi at stabilization.
Rent comps 25 comps
| Address | Beds | Baths | Sqft | Rent | $/sqft | DOM | Units | Dist |
|---|---|---|---|---|---|---|---|---|
| 1003 April Ln North Fort Myers, FL | 4.0 | 2.0 | 1661 | $2,800 | $1.69 | 25d | 1 | 0.37mi |
| 750 Pondella Rd North Fort Myers, FL | 2.0–3.0 | 1.0–2.0 | 1200 | $1,299 | $1.08 | 3d | 6 | 0.64mi |
| 13042 Sail Away St North Fort Myers, FL | 4.0 | 2.5 | 2555 | $3,800 | $1.49 | 25d | 1 | 0.66mi |
| 13042 Sail Away St Unit 13042 North Fort Myers, FL | 3.0 | 3.0 | 2555 | $4,000 | $1.57 | 25d | 1 | 0.66mi |
| 2221 NE 3rd St Cape Coral, FL | 3.0 | 2.0 | 1777 | $2,175 | $1.22 | 5d | 1 | 0.71mi |
| 2231 NE 1st Ter Cape Coral, FL | 3.0 | 2.0 | 2118 | $2,350 | $1.11 | 23d | 1 | 0.79mi |
| 217 NE 21st Pl Cape Coral, FL | 4.0 | 3.0 | 2337 | $2,050 | $0.88 | 23d | 1 | 0.88mi |
| 3140 Sea Trawler Bnd #1003 North Fort Myers, FL | 3.0 | 3.0 | 2063 | $2,400 | $1.16 | 25d | 1 | 0.94mi |
| 3171 Sea Trawler Bnd #1803 North Fort Myers, FL | 3.0 | 2.0 | 2144 | $3,900 | $1.82 | 25d | 1 | 0.98mi |
| 209 SE 24th Ave Cape Coral, FL | 3.0 | 2.0 | 1408 | $1,895 | $1.35 | 25d | 1 | 1.01mi |
| 213 SE 24th Ave Cape Coral, FL | 3.0 | 2.0 | 1400 | $1,800 | $1.29 | 25d | 1 | 1.02mi |
| 4530 W Coral Cir North Fort Myers, FL | 3.0 | 2.0 | 1579 | $5,400 | $3.42 | 23d | 1 | 1.06mi |
| 213 SE 23rd Pl Cape Coral, FL | 3.0 | 2.0 | 2156 | $1,525 | $0.71 | 5d | 1 | 1.06mi |
| 4520 Vinsetta Ave North Fort Myers, FL | 3.0 | 2.0 | 2059 | $2,300 | $1.12 | 25d | 1 | 1.09mi |
| 12710 Olde Banyon Blvd North Fort Myers, FL | 3.0 | 3.0 | 2583 | $4,500 | $1.74 | 25d | 1 | 1.09mi |
| 2121 SE 1st Ter Cape Coral, FL | 3.0 | 2.0 | 1862 | $2,300 | $1.24 | 13d | 1 | 1.14mi |
| 1923 NE 4th Ter Cape Coral, FL | 3.0 | 2.0 | 1499 | $2,200 | $1.47 | 25d | 1 | 1.16mi |
| 511 NE 19th Pl Cape Coral, FL | 3.0 | 2.0 | 1616 | $2,150 | $1.33 | 17d | 1 | 1.17mi |
| 511 NE 19th Pl Cape Coral, FL | 3.0 | 2.0 | 1616 | $2,100 | $1.30 | 5d | 1 | 1.17mi |
| 1823 NE 2nd Ter Cape Coral, FL | 4.0 | 2.0 | 1695 | $2,295 | $1.35 | 25d | 1 | 1.29mi |
| 1831 SE Van Loon Ter Cape Coral, FL | 3.0 | 2.5 | 1540 | $3,200 | $2.08 | 21d | 1 | 1.39mi |
| 1772 Inlet Dr North Fort Myers, FL | 3.0 | 2.5 | 1541 | $2,500 | $1.62 | 21d | 1 | 1.43mi |
| 244 SE 20th Ct Cape Coral, FL | 4.0 | 2.0 | 2408 | $2,800 | $1.16 | 17d | 1 | 1.43mi |
| 412 NE 17th Pl Cape Coral, FL | 3.0 | 2.0 | 1548 | $2,200 | $1.42 | 25d | 1 | 1.45mi |
| 306 NE 17th Pl Cape Coral, FL | 3.0 | 2.0 | 1616 | $2,065 | $1.28 | 3d | 1 | 1.46mi |
Listing history 46 events
-
2026-06-22days on market $290,000 Active 10 DOM
-
2026-06-18days on market $290,000 Active 7 DOM
-
2026-06-17days on market $290,000 Active 6 DOM
-
2026-06-16days on market $290,000 Active 5 DOM
-
2026-06-15days on market $290,000 Active 4 DOM
-
2026-06-13pricedays on market $290,000 Active 2 DOM
-
2026-06-01days on market $299,000 Active 145 DOM
-
2026-05-05price $299,000
-
2026-02-16price $339,000
-
2026-01-06$349,000 Active
-
2025-10-02status Active
-
2025-09-22$349,000 Active
-
2025-09-03soldstatus $100
-
2024-03-14historical $4,000
-
2024-01-18$4,000
-
2024-01-18historical $4,000
-
2024-01-13$4,000
-
2022-08-26historical
-
2022-06-08$625,000 Active
-
2019-09-12soldstatus $106,000
-
2019-09-09soldstatus $106,000 Sold
-
2019-09-04status Pending
-
2019-08-20price $109,000
-
2019-08-20status Active
-
2019-07-11status Pending
-
2019-06-14price $99,900
-
2019-04-04$125,000 Active
-
2019-03-31historical
-
2019-02-07price $125,000
-
2019-01-04price $129,900
-
2018-11-09price $134,500
-
2018-10-10price $139,000
-
2018-08-30price $144,000
-
2018-08-01$150,000 Active
-
2018-07-31historical
-
2018-04-23$159,900 Active
-
2018-04-19historical
-
2018-03-09price $159,900
-
2018-01-22$165,000 Active
-
2005-06-01soldstatus $255,000
-
2005-04-15soldstatus $254,500
-
2005-03-13price $269,990
-
2004-02-25soldstatus $165,000
-
2004-02-23soldstatus $165,000
-
2003-12-24price $179,900
-
1983-10-01soldstatus $12,500
ⓘ Source: listings_history table (triggers on properties + properties_extension) + one-shot
backfill from property_details.listing_events for pre-trigger history.
Tax reassessment forecast FL · Resets to sale price
- Current annual tax
- $3,548 · $296/mo
- Projected year-2 tax
- $3,548 · $296/mo
- Expected delta
- $0/yr ($0/mo · 0.0%)
ⓘ Screening estimate from a state-policy table — verify with the county assessor before closing.
Climate risk First Street
- Flood 7/10 Severe FEMA zone X (shaded) · 76% chance over 30 yrs
- Wildfire 1/10 Low
- Heat 10/10 Extreme 7 d/yr ≥106°F today · 30 d/yr by 30 yrs out
- Wind 10/10 Extreme 99% chance of damaging wind over 30 yrs
- Air quality 2/10 Low 1 unhealthy d/yr today · 1 by 30 yrs out
Nearby sold comps map
Loading sold comps map…
Walkable amenities ~0.75 mi
Loading nearby amenities…
Taxation est. · year 1
- Rental income
- $31,512
- − Mortgage interest
- −$16,245
- − Property taxes
- −$3,548
- − Insurance
- −$2,248
- − Repairs & maintenance
- −$2,521
- − Management
- −$2,521
- − Depreciation
- −$8,436
- Taxable loss
- −$4,007
- Est. tax savings @ 24.0%
- +$962
- After-tax cash flow
- $1,810/yr
For passive investors: Depreciation is non-cash, so a rental often shows a tax loss while cash-flowing — sheltering income. Rental losses are passive: they offset passive income freely, and up to $25,000/yr can offset ordinary (W-2) income if you actively participate and your MAGI is under $100k (phasing out to $0 by $150k); unused losses carry forward. On sale, claimed depreciation is recaptured at up to 25%, and gains may owe capital-gains tax (a 1031 exchange can defer both). Figures are a year-1 estimate at your 24.0% rate — not tax advice; consult a CPA.
Schools (NCES district)
- District
- Lee
- NCES district ID
- 1201080
- Math proficiency
- 47% ▼ -11.00%
- Reading proficiency
- 50% ▼ -4.00%
- Median HH income
- $49,518
- Composite
- 41.49/100
- National rank
- #3458
- State rank
- #42 of 73 in FL
Livability — North Fort Myers
- Score
- 74/100
- State rank
- #269
- US rank
- #4409
Category grades
Schools grade is shown separately in the Schools card above.
Census & demographics
- Census place
- North Fort Myers, FL
- County
- Lee County · 788,662 people
- City population
- 57,035
- Metro
- Cape Coral-Fort Myers, FL
- Population (ZIP)
- 23,655
- Household income
- $56,993
- Rent vs Own
- Severe rent burden
- 468.0
Population outlook (Lee County) Hauer SSP2
- Today (2025)
- 871,946 people
- By 2030
- 955,468 · +9.6%
- By 2040
- 1,113,587 · +27.7%
- By 2050
- 1,256,891 · +44.1%
- By 2075
- 1,560,270 · +78.9%
- By 2100
- 1,726,848 · +98.0%
Race, ethnicity, and origin ACS 2023
- Neighborhood character
- Predominantly White (81%)
- Race & ethnicity
- White 81% Hispanic / Latino 14% Two or more races 8% Black 2%
- Hispanic origin (detail)
- Mexican 3% Puerto Rican 3% Cuban 3%
- Common ancestry
- Lithuanian 4% Romanian 4% Italian 3%
- Foreign-born
- 11% · Canada
- Languages at home
- 88% English-only · Spanish 9% Other Indo-European 1%
Political lean MEDSL · Lee
- 2024 margin
- Strong R (+28.4) · D 35.5% · R 63.9%
- 2008→2024 swing
- -18.0pp toward R · 2008: -10.4pp · 2024: -28.4pp
- All cycles
- 2024: R+28.4 2020: R+19.2 2016: R+20.4 2012: R+16.6 2008: R+10.4
Not yet ingested
- Civics
- —
Market trends
- HPI YoY
- ▼ -172.26%
- Current HPI
- 256.773
- Rent YoY
- ▼ -1.94%
- Metro
- Cape Coral-Fort Myers, FL
- State GDP YoY
- ▲ 3.28%
- F500 in state
- 36
Industry mix (Fortune 500 HQ in FL)
| Industry | F500 HQs | Revenue |
|---|---|---|
| Industrial Technology | 2 | $29B |
|
||
| Insurance | 2 | $17B |
|
||
| Retail | 1 | $60B |
|
||
| Technology Distribution | 1 | $58B |
|
||
| Homebuilding | 1 | $35B |
|
||
| Technology Manufacturing | 1 | $35B |
|
||
Price history
+2292.0% since first listed39 events — show timeline
- 2026-05-05 Price Changed $299,000 NAPLESMLS
- 2026-02-16 Price Changed $339,000 NAPLESMLS
- 2026-01-06 Listed $349,000 NAPLESMLS
- 2025-10-02 Relisted — BEARMLS
- 2025-09-22 Listed $349,000 BEARMLS
- 2025-09-03 Sold (Public Records) $100 Public Records
- 2024-03-14 Rental Removed $4,000 APPFOLIO
- 2024-01-18 Listed for Rent $4,000 APPFOLIO
- 2024-01-18 Rental Removed $4,000 TURBOTENANT
- 2024-01-13 Listed for Rent $4,000 TURBOTENANT
- 2022-08-26 Listing Removed — FORTMLS
- 2022-06-08 Listed $625,000 FORTMLS
- 2019-09-12 Sold (Public Records) $106,000 Public Records
- 2019-09-09 Sold (MLS) $106,000 FORTMLS
- 2019-09-04 Pending — FORTMLS
- 2019-08-20 Price Changed $109,000 FORTMLS
- 2019-08-20 Relisted — FORTMLS
- 2019-07-11 Pending — FORTMLS
- 2019-06-14 Price Changed $99,900 FORTMLS
- 2019-04-04 Listed $125,000 FORTMLS
- 2019-03-31 Listing Removed — FORTMLS
- 2019-02-07 Price Changed $125,000 FORTMLS
- 2019-01-04 Price Changed $129,900 FORTMLS
- 2018-11-09 Price Changed $134,500 FORTMLS
- 2018-10-10 Price Changed $139,000 FORTMLS
- 2018-08-30 Price Changed $144,000 FORTMLS
- 2018-08-01 Listed $150,000 FORTMLS
- 2018-07-31 Listing Removed — FORTMLS
- 2018-04-23 Listed $159,900 FORTMLS
- 2018-04-19 Listing Removed — FORTMLS
- 2018-03-09 Price Changed $159,900 FORTMLS
- 2018-01-22 Listed $165,000 FORTMLS
- 2005-06-01 Sold (Public Records) $255,000 Public Records
- 2005-04-15 Sold (MLS) $254,500 FORTMLS
- 2005-03-13 Price Changed $269,990 FORTMLS
- 2004-02-25 Sold (Public Records) $165,000 Public Records
- 2004-02-23 Sold (MLS) $165,000 FORTMLS
- 2003-12-24 Price Changed $179,900 FORTMLS
- 1983-10-01 Sold (Public Records) $12,500 Public Records
Property tax history
+10.7%/yrLatest (2025): $3,548 · -28.1% YoY. Source: county tax records.
Cash-flow waterfall
monthlySold comps — $/sqft
last 12 mo · ≤1 miLoading sold comps…