13827 S Indian River Dr #60 · Jensen Beach, FL
Flood risk 6/10 · Moderate
- FEMA flood zone
- X (unshaded)
- Chance of flooding over 30 yrs
- 0.59%
- Est. flood insurance / yr
- $507 – $1,088
Fire risk 3/10 · Minor
- Est. fire insurance / yr
- $947 – $1,759
Heat risk 10/10 · Severe
- Hot days now (above 106°F)
- 7 days/yr
- Hot days in 30 yrs
- 21 days/yr
Wind risk 10/10 · Severe
- Chance of severe wind over 30 yrs
- 99.0%
Air-quality risk 2/10 · Minimal
- Unhealthy air days now
- 1 days/yr
- Unhealthy air days in 30 yrs
- 2 days/yr
Risk factors via First Street. Map © Google.
Why this score? — see what drove the B- grade
The composite is a weighted blend of 9 inputs, each scored 0–100. Each bar is that input's sub-score; the figure is the points it added to the 100-point composite (weight × sub-score).
- Cash flow +30.0/30.0
- 1% rule +10.0/10.0
- DSCR +10.0/10.0
- ARV discount +7.5/15.0
- Schools +3.7/10.0
- Livability +3.5/5.0
- Rent growth +2.8/5.0
- Condition / age +2.5/5.0
- Appreciation +0.0/10.0
$109,000
🖨 Deal sheet (PDF) 📄 Offer letter ✓ Due diligence
Listing remarks
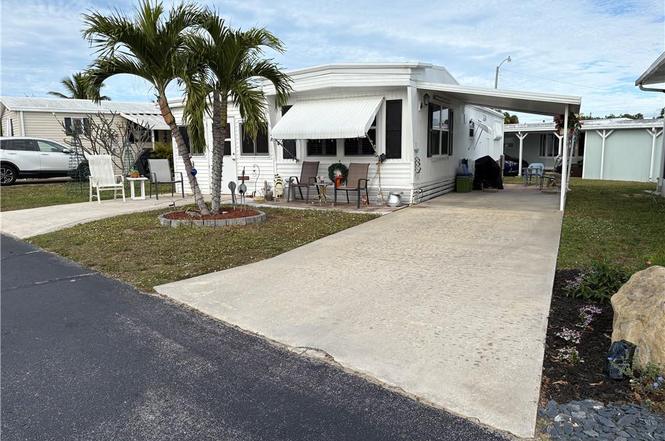
LAKE MANOR PARK - A CHARMING 55-Plus Community on the INDIAN RIVER hosts a WATERSIDE RECREATION PARK for residents. The community is centered around a tranquil lake for morning walks enjoying wildlife. The OCEAN BEACH, Great Restaurants, and Natical shopping are short 5-10 minutes away. This BUNGALOW HOME has many upgrades, EXCELLENTLY MAINTAINED. . UPDATED ROOF, ELECTRICAL PEDESTAL, SHUTTERS and more. .. Unit is located close to RAILROAD TRACKS. .. PERFECT for TRAIN ENTHUSIAST - Fun to watch - mostly active in the day-time. .. Community EXTRA PARKING LOT for RV/BOAT STORAGE AVAILABLE. Property Owners only - No Rentals allowed.
Key facts
- Tranquil lake
- Rv/boat storage
- 1,341 sq ft lot
Tags
Property features AI
Finance
- Financial info: Pets allowed (with number limit); Senior community; Community amenities include beach access, bocce court, clubhouse, dog park, fishing, non-gated community, pier, pool, shuffleboard, storage facilities, and trails/paths
- HOA & community: Has homeowners association; Association fee includes management, common area and grounds maintenance, pool(s), recreation facilities, reserve fund, sewer, trash, and water; Association fee applies
Exterior
- Parking: Attached carport; Driveway; 1 total parking space (1 covered)
- Security: Smoke detectors; Storm/security shutters
- Utilities: Cable available; Electricity available and connected; Phone available; Sewer available; Trash collection; Water available
- Home design: Manufactured home with aluminum and vinyl siding; Single-story; Faces southwest; Resale
- Construction: Manufactured construction; Aluminum siding; Vinyl siding
- Exterior features: Awning(s); Covered patio; Patio; Shed(s); Storm/security shutters; Smoke detector(s); Community pool
Interior
- Kitchen: Dryer; Dishwasher; Electric range; Icemaker; Microwave; Water softener; Water heater; Water purifier
- Bedrooms: 2 possible bedrooms
- Flooring: Laminate
- Bathrooms: 1 full bathroom
- Heating & cooling: Central electric heating; Central electric cooling (air conditioning)
- Interior features: Furnished; Built-in features; Closet cabinetry; Kitchen/dining combo; Tub with shower; Jalousie, metal, and single-hung windows with shutters
- Laundry & utility: Washer; Some electric appliances
Neighborhood map
What this means for you Summary
Snapshot
- This is a 2-bed/1.0-bath manufactured listed at $109k.
Deal economics
- At list price, monthly cash flow is $608 ($7k/yr) — positive.
- The deal already cash-flows at list — no discount required.
- Meets the 1% rule at list price ($2k rent vs $109k).
- Recommended offer: $96k (12.0% below list) — sets the bar for market timing.
- Cap rate 13.0% vs local median 4.1% in Jensen Beach — top-decile yield for the area; either an underpriced asset or a hidden risk that comps aren't pricing in. Stress-test before assuming the spread holds.
Location & tenants
- Location reads 70/100 on livability (#432 in FL) — a middle-class / working-renter tenant base. Strengths: crime A+, housing A+, cost of living B+; Watch: amenities F, commute F, health & safety D-.
- St. Lucie (urban): math 40% / reading 48% proficiency, ranked #51 of 73 in FL (top 70%) — families likely to look elsewhere, expect single-tenant / working-renter base with shorter leases.
- Market conditions: Rents rising (+1.0%/yr); 536 active listings in the ZIP; 4 comparable units currently listed for rent nearby; rentals at typical pace (median 24d on market — plan ~3-4 weeks tenant-placement turnaround); 4,868 units permitted in St. Lucie County in 2024 (268 in 5+ unit buildings).
- This rent runs 34% of the median local income ($70k/yr) — at the standard rent-burdened threshold; future hikes will face affordability resistance.
Forward outlook
- Local home prices are declining (-3.0%/yr); year-one equity from $754 of loan paydown is wiped out by about $3k of value loss. Plan a longer hold.
- St. Lucie County population projected at +20% by 2050 — long-run rental-demand tailwind backs the buy-and-hold thesis.
- At projected returns (-3.0% appreciation + 1.0% rent growth), your $31k cash investment doubles in ~6 years — after that, you're playing with house money.
Negotiation context
- It's been on market 167 days — a 12% lower offer ($96k) is reasonable based on typical stale-listing flexibility.
- 2 sale attempts since 18y ago; this cycle's ask has dropped $6k (5%) from the opening price — seller is motivated, your offer sets the floor, not the list.
- Current owner paid $20k; list at $109k implies a 445% gain — meaningful room to come down on a strong offer.
Risks & watch-outs
- Climate carrying-cost: major flood risk; severe wind risk, 99% chance of damaging wind over 30y; extreme-heat days projected 7→21/yr by 2055 (HVAC capex compounding) — expect insurance premiums to compound above CPI over the hold.
Questions for the listing agent
- It's been on market 167 days. Have you received any prior offers? Is the seller open to a 12% concession, seller financing, or rate buy-down credit?
- Built in 1969 — when were the roof, HVAC, electrical panel, plumbing, and water heater last replaced?
- What does the HOA fee cover, when was the last increase, and are there any pending special assessments or reserve-fund shortfalls?
- Why hasn't it sold? Are there any deal-killer items the seller is aware of (foundation, flood, title, zoning, code violations)?
- Is there a deadline driving the sale (1031 exchange, divorce, estate, relocation)? That informs how much negotiation room exists.
- Schools are B-rated — typically a magnet for longer-tenancy family renters. What's the average tenant stay here, and is there a school-zone premium baked into asking?
- What's the average days-on-market for RENTAL listings here right now (not sales)? A rising rental-DOM trend means longer vacancies and softer asking-rent achievability than the comps imply.
- What's the recent tenant-quality profile in this submarket — average credit score on applications, eviction rate, late-payment / NSF rate, and stable-employment percentage? A property-management company in the area should have these aggregated.
- How much new for-sale + rental construction is in the pipeline within 1–3 miles? Heavy new supply typically softens prices + rents 12–24 months out; constrained supply supports both.
Investment metrics
- 1% rule
- 1.80% ✓
- Cap rate
- 12.98%
- Cash-on-cash
- 23.89%
- DSCR
- 2.06
- GRM
- 4.6
CMA / ARV
No comps found within radius.
Projected returns pro-forma
-3.0% appreciation · 1.0% rent growth · sell at horizon
- IRR
- 14.6%
- Equity multiple
- 1.57×
- Total profit
- $17,307
- Equity at exit
- $16,252
- IRR
- 21.6%
- Equity multiple
- 2.65×
- Total profit
- $50,214
- Equity at exit
- $9,424
Cash invested: $30,520 (down + closing). Projections, not guarantees.
Landlord ↔ Tenant lean methodology
- Overall (STATE)
- 87 Strongly Landlord-Friendly
- State Florida
- 87 Strongly Landlord-Friendly · R+3
- County
- — inherits STATE
- City
- — inherits STATE
ZIP-level market 34957
- Rents YoY
- 1.0%
- Active inventory
- 536
- Price-to-rent
- 4.6×
Monthly cashflow live
- Estimated rent
- $1,966 medium interval (Pro) →
- Mortgage (P&I)
- −$572
- Tax from tax record
- −$73 /mo · $879/yr
- Insurance
- −$45
- HOA
- −$255
- Vacancy / Maint / Mgmt
- −$413
- Net cashflow
- $608
Break-even live
Sensitivity live
| Price | -10% $669 | -5% $638 | +0% $608 | +5% $577 | +10% $546 |
|---|---|---|---|---|---|
| Rent | -10% $452 | -5% $530 | +0% $608 | +5% $685 | +10% $763 |
| Rate | -1.0pp $663 | -0.5pp $635 | base $608 | +0.5pp $579 | +1.0pp $551 |
UW: 25.0% down · 7.5% · 30yr · 1.5% tax · 5.0% vac · 8.0% maint · 8.0% mgmt
Financing live
Cash to close
- Down payment
- $27,250
- Closing costs
- $3,270
- Reserves months
- —
- Total cash needed
- —
Loan-product check · same deal, 3 products live
Conventional
25% down · 7.5% · 30yr
- Down + closing
- —
- Monthly P&I
- —
- Monthly cashflow
- —
- DSCR
- —
- Eligible?
- —
Personal DTI + credit; lowest rate.
DSCR
20% down · 8.5% · 30yr
- Down + closing
- —
- Monthly P&I
- —
- Monthly cashflow
- —
- DSCR
- —
- Eligible?
- —
No personal income docs; deal must DSCR.
Hard money
10% down · 12.0% · 12mo
- Down + closing
- —
- Monthly P&I
- —
- Monthly cashflow
- —
- DSCR
- —
- Eligible?
- —
Short-term bridge; refi at stabilization.
Rent comps 4 comps
| Address | Beds | Baths | Sqft | Rent | $/sqft | DOM | Units | Dist |
|---|---|---|---|---|---|---|---|---|
| 13825 S Indian River Dr Unit 13807 Jensen Beach, FL | 1.0 | 1.0 | 500 | $1,450 | $2.90 | 14d | 1 | 0.12mi |
| 4220 NE Indian River Dr #5 Jensen Beach, FL | 1.0 | 1.0 | 560 | $1,800 | $3.21 | 24d | 1 | 0.77mi |
| 1192 Nettles Blvd Jensen Beach, FL | 2.0 | 1.0 | 489 | $1,750 | $3.58 | 24d | 1 | 1.44mi |
| 1161 Nettles Blvd Unit 1546132P Jensen Beach, FL | 2.0 | 2.0 | 710 | $4,838 | $6.81 | 14d | 1 | 1.48mi |
HOA detail
- Monthly dues
- $255 · $3,060/yr
- Likely covers
- waterelectric
Listing history 21 events
-
2026-06-18days on market $109,000 Active 167 DOM
-
2026-06-17days on market $109,000 Active 166 DOM
-
2026-06-16days on market $109,000 Active 165 DOM
-
2026-06-15days on market $109,000 Active 164 DOM
-
2026-06-14days on market $109,000 Active 162 DOM
-
2026-06-13days on market $109,000 Active 161 DOM
-
2026-06-10days on market $109,000 Active 159 DOM
-
2026-06-09days on market $109,000 Active 158 DOM
-
2026-06-08days on market $109,000 Active 157 DOM
-
2026-06-07days on market $109,000 Active 156 DOM
-
2026-06-05days on market $109,000 Active 153 DOM
-
2026-06-03days on market $109,000 Active 152 DOM
-
2026-06-02days on market $109,000 Active 151 DOM
-
2026-06-01days on market $109,000 Active 150 DOM
-
2026-05-31days on market $109,000 Active 149 DOM
-
2026-05-30days on market $109,000 Active 148 DOM
-
2026-03-22price $109,000
-
2026-01-01$114,900 Active
-
2013-09-21historical
-
2008-02-09$49,900
-
1991-04-19soldstatus $20,000
ⓘ Source: listings_history table (triggers on properties + properties_extension) + one-shot
backfill from property_details.listing_events for pre-trigger history.
Tax reassessment forecast FL · Resets to sale price
- Current annual tax
- $879 · $73/mo
- Projected year-2 tax
- $905 · $75/mo
- Expected delta
- +$26/yr (+$2/mo · 2.9%)
ⓘ Screening estimate from a state-policy table — verify with the county assessor before closing.
Climate risk First Street
- Flood 6/10 Major FEMA zone X (unshaded) · 59% chance over 30 yrs
- Wildfire 3/10 Moderate
- Heat 10/10 Extreme 7 d/yr ≥106°F today · 21 d/yr by 30 yrs out
- Wind 10/10 Extreme 99% chance of damaging wind over 30 yrs
- Air quality 2/10 Low 1 unhealthy d/yr today · 2 by 30 yrs out
Nearby sold comps map
Loading sold comps map…
Walkable amenities ~0.75 mi
Loading nearby amenities…
Taxation est. · year 1
- Rental income
- $23,588
- − Mortgage interest
- −$6,106
- − Property taxes
- −$879
- − Insurance
- −$545
- − Repairs & maintenance
- −$1,887
- − Management
- −$1,887
- − HOA
- −$3,060
- − Depreciation
- −$3,171
- Taxable income
- $6,054
- Est. tax owed @ 24.0%
- −$1,453
- After-tax cash flow
- $5,839/yr
For passive investors: Depreciation is non-cash, so a rental often shows a tax loss while cash-flowing — sheltering income. Rental losses are passive: they offset passive income freely, and up to $25,000/yr can offset ordinary (W-2) income if you actively participate and your MAGI is under $100k (phasing out to $0 by $150k); unused losses carry forward. On sale, claimed depreciation is recaptured at up to 25%, and gains may owe capital-gains tax (a 1031 exchange can defer both). Figures are a year-1 estimate at your 24.0% rate — not tax advice; consult a CPA.
Schools (NCES district)
- District
- St. Lucie
- NCES district ID
- 1201770
- Math proficiency
- 40% ▼ -11.00%
- Reading proficiency
- 48% ▼ -4.00%
- Median HH income
- $44,737
- Composite
- 37.28/100
- National rank
- #4449
- State rank
- #51 of 73 in FL
Livability — Jensen Beach
- Score
- 70/100
- State rank
- #432
- US rank
- #7719
Category grades
Schools grade is shown separately in the Schools card above.
Census & demographics
- County
- Martin County · 165,223 people
- City population
- 23,462
- Metro
- Port St. Lucie, FL
- Population (ZIP)
- 23,462
- Household income
- $70,403
- Rent vs Own
- Severe rent burden
- 946.0
Population outlook (St. Lucie County) Hauer SSP2
- Today (2025)
- 338,016 people
- By 2030
- 355,687 · +5.2%
- By 2040
- 385,521 · +14.1%
- By 2050
- 406,106 · +20.1%
- By 2075
- 441,054 · +30.5%
- By 2100
- 436,885 · +29.2%
Race, ethnicity, and origin ACS 2023
- Neighborhood character
- Predominantly White (85%)
- Race & ethnicity
- White 85% Hispanic / Latino 7% Two or more races 6% Asian 2% Black 2%
- Hispanic origin (detail)
- Mexican 1% Puerto Rican 2% Cuban 1%
- Common ancestry
- Romanian 4% Slovak 3% Lithuanian 3%
- Foreign-born
- 10% · Canada, Jamaica
- Languages at home
- 90% English-only · Spanish 5% Other Indo-European 2% Tagalog/Filipino 1%
Political lean MEDSL · St. Lucie
- 2024 margin
- Lean R (+9.1) · D 45.1% · R 54.2%
- 2008→2024 swing
- -21.2pp toward R · 2008: 12.1pp · 2024: -9.1pp
- All cycles
- 2024: R+9.1 2020: R+1.6 2016: R+2.5 2012: D+7.9 2008: D+12.1
Not yet ingested
- Civics
- —
Market trends
- HPI YoY
- ▼ -319.66%
- Current HPI
- 340.0172
- Rent YoY
- ▲ 1.00%
- Metro
- Port St. Lucie, FL
- State GDP YoY
- ▲ 3.28%
- F500 in state
- 36
Industry mix (Fortune 500 HQ in FL)
| Industry | F500 HQs | Revenue |
|---|---|---|
| Industrial Technology | 2 | $29B |
|
||
| Insurance | 2 | $17B |
|
||
| Retail | 1 | $60B |
|
||
| Technology Distribution | 1 | $58B |
|
||
| Homebuilding | 1 | $35B |
|
||
| Technology Manufacturing | 1 | $35B |
|
||
Price history
+445.0% since first listed5 events — show timeline
- 2026-03-22 Price Changed $109,000 MCRTC
- 2026-01-01 Listed $114,900 MCRTC
- 2013-09-21 Listing Removed — Beaches MLS
- 2008-02-09 Listed $49,900 Beaches MLS
- 1991-04-19 Sold (Public Records) $20,000 Public Records
Property tax history
+4.5%/yrLatest (2025): $879 · +1.0% YoY. Source: county tax records.
Cash-flow waterfall
monthlySold comps — $/sqft
last 12 mo · ≤1 miLoading sold comps…