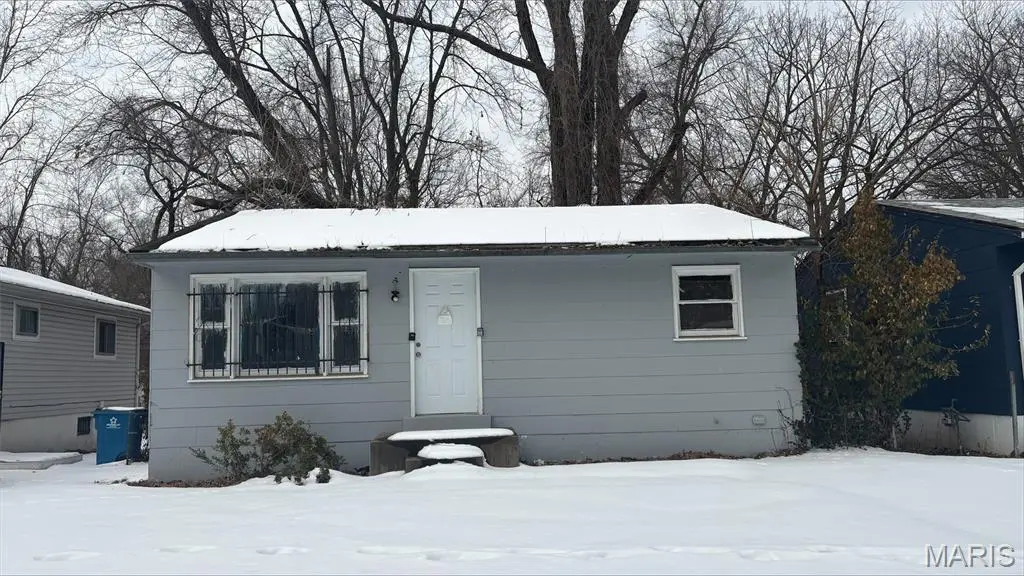
10235 Lord Dr · Castle Point, MO
Flood risk 7/10 · Major
- FEMA flood zone
- X (unshaded)
- Chance of flooding over 30 yrs
- 0.99%
- Est. flood insurance / yr
- $473 – $860
Fire risk 1/10 · Minimal
- Est. fire insurance / yr
- $1,054 – $1,958
Heat risk 5/10 · Moderate
- Hot days now (above 107°F)
- 7 days/yr
- Hot days in 30 yrs
- 21 days/yr
Wind risk 2/10 · Minimal
- Chance of severe wind over 30 yrs
- 1.0%
Air-quality risk 4/10 · Minor
- Unhealthy air days now
- 4 days/yr
- Unhealthy air days in 30 yrs
- 5 days/yr
Risk factors via First Street. Map © Google.
Why this score? — see what drove the A- grade
The composite is a weighted blend of 9 inputs, each scored 0–100. Each bar is that input's sub-score; the figure is the points it added to the 100-point composite (weight × sub-score).
- Cash flow +30.0/30.0
- ARV discount +15.0/15.0
- 1% rule +10.0/10.0
- DSCR +10.0/10.0
- Appreciation +6.9/10.0
- Rent growth +3.7/5.0
- Livability +3.2/5.0
- Condition / age +2.5/5.0
- Schools +0.4/10.0
$35,000
🖨 Deal sheet (PDF) 📄 Offer letter ✓ Due diligence
Listing remarks MLS
Great opportunity with this 2-bedroom, 1-bath fixer-upper featuring a full basement. This property offers a solid layout and plenty of potential for renovation and value-add improvements. The basement provides additional storage or future living space possibilities. Ideal for investors or buyers looking to customize and build equity. Bring your vision and transform this home into something special.
Key facts
- Future living space
- Full basement
- Additional storage
Tags
Neighborhood map
What this means for you Summary
Snapshot
- This is a 2-bed/1.0-bath single-family listed at $35k.
Deal economics
- At list price, monthly cash flow is $618 ($7k/yr) — positive.
- The deal already cash-flows at list — no discount required.
- Meets the 1% rule at list price ($1k rent vs $35k).
- Recommended offer: $31k (12.0% below list) — sets the bar for market timing.
- Cap rate 29.4% vs local median 12.9% in Castle Point — top-decile yield for the area; either an underpriced asset or a hidden risk that comps aren't pricing in. Stress-test before assuming the spread holds.
Location & tenants
- Location reads 64/100 on livability (#313 in MO) — a middle-class / working-renter tenant base. Strengths: cost of living A+, crime B; Watch: schools F, amenities F, commute F.
- Riverview Gardens (suburban): math 2% / reading 9% proficiency, ranked #324 of 324 in MO (top 100%) — low school quality limits family demand, transient renter base, plan for 1-2y turnover; 90% free/reduced lunch — lower-income household profile, screen leases tightly.
- Market conditions: Rents rising fast (+5.0%/yr); 376 active listings in the ZIP; 2 comparable units currently listed for rent nearby; lower-income renter base — watch delinquency; 920 units permitted in St. Louis County in 2024 (250 in 5+ unit buildings).
- This rent runs 33% of the median local income ($41k/yr) — at the standard rent-burdened threshold; future hikes will face affordability resistance.
Forward outlook
- In year one you build about $2k of equity ($242 loan paydown + $1k appreciation (3.8% local appreciation)).
- At projected returns (3.8% appreciation + 5.0% rent growth), your $10k cash investment doubles in ~2 years — after that, you're playing with house money.
Negotiation context
- It's been on market 137 days — a 12% lower offer ($31k) is reasonable based on typical stale-listing flexibility.
Risks & watch-outs
- Watch-outs: flood insurance adds $56/mo; built in 1956 — expect roof / HVAC / electrical / plumbing capex.
- Climate carrying-cost: major flood risk; extreme-heat days projected 7→21/yr by 2055 (HVAC capex compounding) — expect insurance premiums to compound above CPI over the hold.
Questions for the listing agent
- It's been on market 137 days. Have you received any prior offers? Is the seller open to a 12% concession, seller financing, or rate buy-down credit?
- Built in 1956 — when were the roof, HVAC, electrical panel, plumbing, and water heater last replaced?
- What's the actual annual flood-insurance premium (NFIP or private), and is the property in a SFHA with mandatory coverage?
- Why hasn't it sold? Are there any deal-killer items the seller is aware of (foundation, flood, title, zoning, code violations)?
- Is there a deadline driving the sale (1031 exchange, divorce, estate, relocation)? That informs how much negotiation room exists.
- Schools are F-rated, which usually means shorter tenancies and higher turnover. Who's the typical renter profile here, and what's been the actual vacancy rate?
- What's the average days-on-market for RENTAL listings here right now (not sales)? A rising rental-DOM trend means longer vacancies and softer asking-rent achievability than the comps imply.
- What's the recent tenant-quality profile in this submarket — average credit score on applications, eviction rate, late-payment / NSF rate, and stable-employment percentage? A property-management company in the area should have these aggregated.
- How much new for-sale + rental construction is in the pipeline within 1–3 miles? Heavy new supply typically softens prices + rents 12–24 months out; constrained supply supports both.
Investment metrics
- 1% rule
- 3.25% ✓
- Cap rate
- 29.39%
- Cash-on-cash
- 82.51%
- DSCR
- 4.67
- GRM
- 2.6
CMA / ARV
- ARV (median comp)
- $68,965
- List price
- $35,000
- Delta
- -49.25%
- Verdict
- UNDERPRICED
- Comps
- 20 within 1.0 mi
Show comp detail 12 sales within ~0.75 mi
| Address | Dist | Beds/Ba | Sqft | Sold | Price | $/sf | Match |
|---|---|---|---|---|---|---|---|
| 10353 Lord Dr | 0.16mi | 2/1.0 | 729 (+1%) | 14mo | $1,113,000 | $1,527 | 79 |
| 10140 Earl Dr | 0.15mi | 3/1.0 (+1) | 737 (+2%) | 10mo | $99,900 | $136 | 75 |
| 10417 Lord Dr | 0.24mi | 2/1.0 | 702 (-2%) | 11mo | $79,000 | $113 | 75 |
| 10429 Earl Dr | 0.28mi | 2/1.0 | 770 (+7%) | 1mo | $35,000 | $45 | 75 |
| 10040 Lord Dr | 0.29mi | 2/1.0 | 672 (-7%) | 5mo | $10,000 | $15 | 72 |
| 10348 Earl Dr | 0.20mi | 3/1.0 (+1) | 770 (+7%) | 4mo | $35,000 | $45 | 71 |
| 10417 Duke Dr | 0.27mi | 2/1.0 | 770 (+7%) | 7mo | $35,000 | $45 | 70 |
| 10167 Count Dr | 0.07mi | 2/1.0 | 624 (-13%) | 7mo | $69,900 | $112 | 68 |
| 10100 Earl Dr | 0.23mi | 3/1.0 (+1) | 759 (+5%) | 11mo | $37,000 | $49 | 66 |
| 10504 Duke Dr | 0.39mi | 2/1.0 | 770 (+7%) | 9mo | $115,000 | $149 | 63 |
| 10019 Lord Dr | 0.33mi | 2/1.0 | 795 (+10%) | 7mo | $37,999 | $48 | 61 |
| 10465 Lord Dr | 0.33mi | 3/1.5 (+1) | 770 (+7%) | 11mo | $109,900 | $143 | 57 |
Match score weights: distance 35% · size 25% · config 20% · recency 20%. Top-matched comps best support the ARV.
Projected returns pro-forma
3.79% appreciation · 4.97% rent growth · sell at horizon
- IRR
- 82.9%
- Equity multiple
- 5.84×
- Total profit
- $47,418
- Equity at exit
- $17,318
- IRR
- 82.5%
- Equity multiple
- 12.79×
- Total profit
- $115,544
- Equity at exit
- $27,988
Cash invested: $9,800 (down + closing). Projections, not guarantees.
Landlord ↔ Tenant lean methodology
- Overall (STATE)
- 81 Strongly Landlord-Friendly
- State Missouri
- 81 Strongly Landlord-Friendly · R+10
- County
- — inherits STATE
- City
- — inherits STATE
ZIP-level market 63136
- Home prices YoY
- 0.9%
- Rents YoY
- 5.0%
- Active inventory
- 376
- Price-to-rent
- 2.6×
Monthly cashflow live
- Estimated rent
- $1,138 medium interval (Pro) →
- Mortgage (P&I)
- −$184
- Tax from tax record
- −$27 /mo · $321/yr
- Insurance
- −$15
- Flood insurance flood zone
- −$56 /mo · $666/yr
- HOA
- −$0
- Vacancy / Maint / Mgmt
- −$239
- Net cashflow
- $618
Break-even live
Sensitivity live
| Price | -10% $638 | -5% $628 | +0% $618 | +5% $608 | +10% $598 |
|---|---|---|---|---|---|
| Rent | -10% $528 | -5% $573 | +0% $618 | +5% $663 | +10% $708 |
| Rate | -1.0pp $636 | -0.5pp $627 | base $618 | +0.5pp $609 | +1.0pp $600 |
UW: 25.0% down · 7.5% · 30yr · 1.5% tax · 5.0% vac · 8.0% maint · 8.0% mgmt
Financing live
Cash to close
- Down payment
- $8,750
- Closing costs
- $1,050
- Reserves months
- —
- Total cash needed
- —
Loan-product check · same deal, 3 products live
Conventional
25% down · 7.5% · 30yr
- Down + closing
- —
- Monthly P&I
- —
- Monthly cashflow
- —
- DSCR
- —
- Eligible?
- —
Personal DTI + credit; lowest rate.
DSCR
20% down · 8.5% · 30yr
- Down + closing
- —
- Monthly P&I
- —
- Monthly cashflow
- —
- DSCR
- —
- Eligible?
- —
No personal income docs; deal must DSCR.
Hard money
10% down · 12.0% · 12mo
- Down + closing
- —
- Monthly P&I
- —
- Monthly cashflow
- —
- DSCR
- —
- Eligible?
- —
Short-term bridge; refi at stabilization.
Rent comps 2 comps
| Address | Beds | Baths | Sqft | Rent | $/sqft | DOM | Units | Dist |
|---|---|---|---|---|---|---|---|---|
| 2155 Hecht Ave St. Louis, MO | 1.0–2.0 | 1.0 | 673 | $1,162 | $1.73 | 0d | 23 | 0.77mi |
| 10032 Neville Walk Unit 10016C St. Louis, MO | 1.0 | 1.0 | 720 | $855 | $1.19 | 0d | 1 | 1.32mi |
Listing history 20 events
-
2026-06-21days on market $35,000 Active 137 DOM
-
2026-06-18days on market $35,000 Active 134 DOM
-
2026-06-17days on market $35,000 Active 133 DOM
-
2026-06-16days on market $35,000 Active 132 DOM
-
2026-06-15days on market $35,000 Active 131 DOM
-
2026-06-13days on market $35,000 Active 129 DOM
-
2026-06-13days on market $35,000 Active 128 DOM
-
2026-06-09days on market $35,000 Active 125 DOM
-
2026-06-08days on market $35,000 Active 124 DOM
-
2026-06-07days on market $35,000 Active 123 DOM
-
2026-06-05days on market $35,000 Active 120 DOM
-
2026-06-03days on market $35,000 Active 119 DOM
-
2026-06-01days on market $35,000 Active 118 DOM
-
2026-05-31days on market $35,000 Active 117 DOM
-
2026-02-03$35,000 Active 403-char remark
Show marketing remark (403 chars)
Great opportunity with this 2-bedroom, 1-bath fixer-upper featuring a full basement. This property offers a solid layout and plenty of potential for renovation and value-add improvements. The basement provides additional storage or future living space possibilities. Ideal for investors or buyers looking to customize and build equity. Bring your vision and transform this home into something special.
-
2021-10-11soldstatus $85,350
-
2001-12-27soldstatus $7,800
-
2000-08-10soldstatus $48,000
-
1999-03-01soldstatus
-
1990-05-01soldstatus
ⓘ Source: listings_history table (triggers on properties + properties_extension) + one-shot
backfill from property_details.listing_events for pre-trigger history.
Tax reassessment forecast MO · Resets to sale price
- Current annual tax
- $321 · $27/mo
- Projected year-2 tax
- $340 · $28/mo
- Expected delta
- +$18/yr (+$2/mo · 5.7%)
ⓘ Screening estimate from a state-policy table — verify with the county assessor before closing.
Climate risk First Street
- Flood 7/10 Severe FEMA zone X (unshaded) · 99% chance over 30 yrs
- Wildfire 1/10 Low
- Heat 5/10 Major 7 d/yr ≥107°F today · 21 d/yr by 30 yrs out
- Wind 2/10 Low 100% chance of damaging wind over 30 yrs
- Air quality 4/10 Moderate 4 unhealthy d/yr today · 5 by 30 yrs out
Nearby sold comps map
Loading sold comps map…
Walkable amenities ~0.75 mi
Loading nearby amenities…
Taxation est. · year 1
- Rental income
- $13,651
- − Mortgage interest
- −$1,961
- − Property taxes
- −$321
- − Insurance
- −$842
- − Repairs & maintenance
- −$1,092
- − Management
- −$1,092
- − Depreciation
- −$1,018
- Taxable income
- $7,325
- Est. tax owed @ 24.0%
- −$1,758
- After-tax cash flow
- $5,661/yr
For passive investors: Depreciation is non-cash, so a rental often shows a tax loss while cash-flowing — sheltering income. Rental losses are passive: they offset passive income freely, and up to $25,000/yr can offset ordinary (W-2) income if you actively participate and your MAGI is under $100k (phasing out to $0 by $150k); unused losses carry forward. On sale, claimed depreciation is recaptured at up to 25%, and gains may owe capital-gains tax (a 1031 exchange can defer both). Figures are a year-1 estimate at your 24.0% rate — not tax advice; consult a CPA.
Schools (NCES district)
- District
- Riverview Gardens
- NCES district ID
- 2926670
- Math proficiency
- 2% ▼ -6.00%
- Reading proficiency
- 9% ▼ -6.00%
- Median HH income
- $32,759
- Composite
- 4.22/100
- National rank
- #10058
- State rank
- #324 of 324 in MO
Livability — Castle Point
- Score
- 64/100
- State rank
- #313
- US rank
- #14373
Category grades
Schools grade is shown separately in the Schools card above.
Census & demographics
- Census place
- Castle Point, MO
- County
- Saint Louis County · 888,823 people
- Metro
- St. Louis, MO-IL
- Population (ZIP)
- 40,929
- Household income
- $41,154
- Rent vs Own
- Severe rent burden
- 3085.0
Population outlook (St. Louis County) Hauer SSP2
- Today (2025)
- 1,025,227 people
- By 2030
- 1,028,023 · +0.3%
- By 2040
- 1,020,940 · -0.4%
- By 2050
- 1,007,280 · -1.8%
- By 2075
- 987,277 · -3.7%
- By 2100
- 921,984 · -10.1%
Race, ethnicity, and origin ACS 2023
- Neighborhood character
- Predominantly Black (90%)
- Race & ethnicity
- Black 90% White 5% Two or more races 3%
- Foreign-born
- 1% · Canada
Political lean MEDSL · St. Louis
- 2024 margin
- Strong D (+23.4) · D 60.8% · R 37.4% · Other 1.7%
- 2008→2024 swing
- +3.5pp toward D · 2008: 19.9pp · 2024: 23.4pp
- All cycles
- 2024: D+23.4 2020: D+24.0 2016: D+16.2 2012: D+13.7 2008: D+19.9
Not yet ingested
- Civics
- —
Market trends
- HPI YoY
- ▲ 3.79%
- Current HPI
- 420.28
- Rent YoY
- ▲ 4.97%
- Metro
- St. Louis, MO-IL
- State GDP YoY
- ▲ 1.84%
- F500 in state
- 20
Industry mix (Fortune 500 HQ in MO)
| Industry | F500 HQs | Revenue |
|---|---|---|
| Healthcare | 1 | $163B |
|
||
| Insurance | 1 | $21B |
|
||
| Industrial Technology | 1 | $17B |
|
||
| Retail | 1 | $16B |
|
||
| Industrial Distribution | 1 | $10B |
|
||
| Utilities | 1 | $9B |
|
||
Price history
-27.1% since first listed6 events — show timeline
- 2026-02-03 Listed $35,000 MARIS as Distributed by MLS Grid
- 2021-10-11 Sold (Public Records) $85,350 Public Records
- 2001-12-27 Sold (Public Records) $7,800 Public Records
- 2000-08-10 Sold (Public Records) $48,000 Public Records
- 1999-03-01 Sold (Public Records) — Public Records
- 1990-05-01 Sold (Public Records) — Public Records
Property tax history
+6.9%/yrLatest (2022): $321 · +0.4% YoY. Source: county tax records.
Cash-flow waterfall
monthlySold comps — $/sqft
last 12 mo · ≤1 miLoading sold comps…