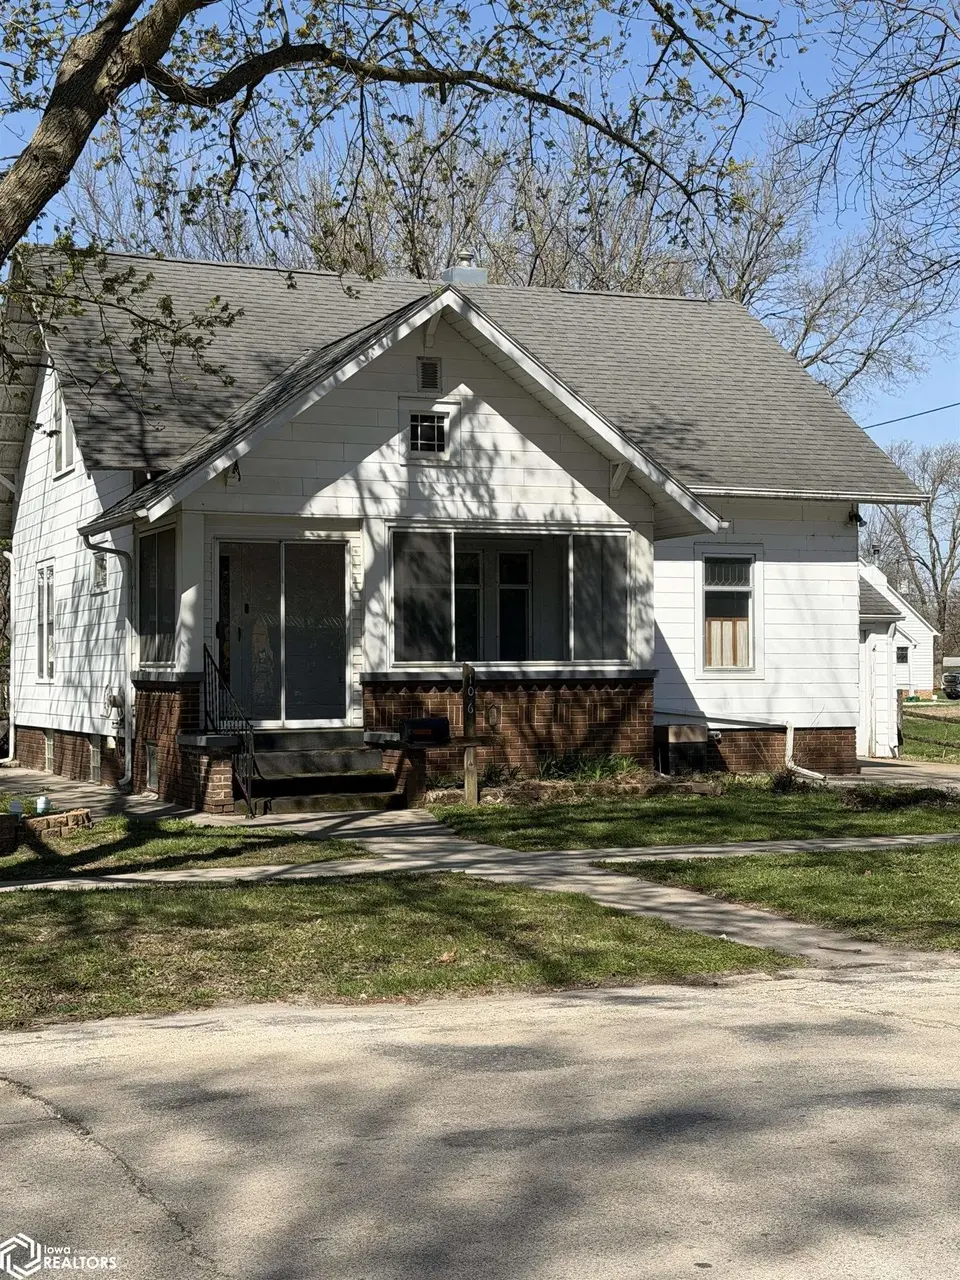
106 9th St N · Humboldt, IA
Flood risk 1/10 · Minimal
- FEMA flood zone
- X (unshaded)
- Chance of flooding over 30 yrs
- 0.0%
- Est. flood insurance / yr
- $473 – $860
Fire risk 1/10 · Minimal
- Est. fire insurance / yr
- $902 – $1,676
Heat risk 2/10 · Minimal
- Hot days now (above 100°F)
- 7 days/yr
- Hot days in 30 yrs
- 16 days/yr
Wind risk 2/10 · Minimal
- Chance of severe wind over 30 yrs
- —
Air-quality risk 1/10 · Minimal
- Unhealthy air days now
- 0 days/yr
- Unhealthy air days in 30 yrs
- 0 days/yr
Risk factors via First Street. Map © Google.
Why this score? — see what drove the B- grade
The composite is a weighted blend of 9 inputs, each scored 0–100. Each bar is that input's sub-score; the figure is the points it added to the 100-point composite (weight × sub-score).
- Cash flow +22.3/30.0
- ARV discount +15.0/15.0
- DSCR +7.2/10.0
- Schools +6.2/10.0
- 1% rule +5.9/10.0
- Livability +4.2/5.0
- Rent growth +2.5/5.0
- Condition / age +2.2/5.0
- Appreciation +0.0/10.0
$109,900
🖨 Deal sheet (PDF) 📄 Offer letter ✓ Due diligence
Listing remarks
Dream of homeownership? Don't miss this charming three-bedroom, two-bath home - perfect for a family just starting out. Step inside to find beautiful oak columns, a leaded glass cabinet, and oak hardwood floors throughout the main level. The main floor offers a living room, dining room, kitchen, convenient laundry, and a bedroom that could also serve as a playroom or flex space for those toys. Upstairs you'll find two generously sized bedrooms along with an additional 1/4 bath. Located close to parks, schools, and the downtown area, this home combines comfort, character, and convenience - ready for you to make it your own. Being sold "as is".
Key facts
- Close to parks
- Close to schools
- Oak columns
Tags
Property features AI
Exterior
- Parking: Detached 1-car garage
- Utilities: Public water; Public sewer
- Home design: Single-family residence; One and one-half stories
- Exterior features: Lot dimensions approximately 65 x 59.5 and 20 x 59.5; Approximately 0.09 acres
Interior
- Bathrooms: 1 full bathroom; 1 half bathroom
- Heating & cooling: Central air conditioning; Forced air heating
- Interior features: Basement present
Neighborhood map
What this means for you Summary
Snapshot
- This is a 3-bed/1.0-bath single-family listed at $110k. Condition is rated fair.
Deal economics
- At list price, monthly cash flow is $182 ($2k/yr) — positive.
- The deal already cash-flows at list — no discount required.
- Meets the 1% rule at list price ($1k rent vs $110k).
- Recommended offer: $108k (1.5% below list) — sets the bar for market timing.
- Cap rate 8.3% vs local median 3.4% in Humboldt — top-decile yield for the area; either an underpriced asset or a hidden risk that comps aren't pricing in. Stress-test before assuming the spread holds.
Location & tenants
- Location reads 83/100 on livability (#34 in IA, #1,000 nationally) — a professional / high-income tenant draw. Strengths: cost of living A+, housing A+, health & safety A+; Watch: amenities F, commute F.
- Humboldt Community School District (town): math 75% / reading 72% proficiency, ranked #92 of 289 in IA (top 32%) — strong family-tenant draw, lease renewals of 3-5y typical.
- Zoned schools: Taft Elementary School (math 82% / reading 67%, grade A, #131 of 616 statewide, top 27%, 396 students, 42% FRL); Humboldt Middle School (math 74% / reading 71%, grade A, #90 of 246 statewide, top 38%, 440 students, 40% FRL); Humboldt High School (math 72% / reading 75%, grade B+, #108 of 336 statewide, top 33%, 496 students, 36% FRL).
- Market conditions: 64 active listings in the ZIP; 13 units permitted in Humboldt County in 2024 (0 in 5+ unit buildings).
Forward outlook
- Local home prices are declining (-3.0%/yr); year-one equity from $760 of loan paydown is wiped out by about $3k of value loss. Plan a longer hold.
- Humboldt County population projected to shrink 9% by 2050 — rents likely to lag national; underwrite the cash flow, not the appreciation.
Negotiation context
- It's been on market 30 days — a 2% lower offer ($108k) is reasonable based on typical stale-listing flexibility.
Risks & watch-outs
- Watch-outs: built in 1919 — expect roof / HVAC / electrical / plumbing capex.
Questions for the listing agent
- Have any recent inspections been done? Can we get a copy of the seller's disclosures and any deferred-maintenance estimates?
- Built in 1919 — when were the roof, HVAC, electrical panel, plumbing, and water heater last replaced?
- Is there a deadline driving the sale (1031 exchange, divorce, estate, relocation)? That informs how much negotiation room exists.
- Schools are A-rated — typically a magnet for longer-tenancy family renters. What's the average tenant stay here, and is there a school-zone premium baked into asking?
- What's the average days-on-market for RENTAL listings here right now (not sales)? A rising rental-DOM trend means longer vacancies and softer asking-rent achievability than the comps imply.
- What's the recent tenant-quality profile in this submarket — average credit score on applications, eviction rate, late-payment / NSF rate, and stable-employment percentage? A property-management company in the area should have these aggregated.
- How much new for-sale + rental construction is in the pipeline within 1–3 miles? Heavy new supply typically softens prices + rents 12–24 months out; constrained supply supports both.
Investment metrics
- 1% rule
- 1.09% ✓
- Cap rate
- 8.28%
- Cash-on-cash
- 7.09%
- DSCR
- 1.32
- GRM
- 7.6
CMA / ARV
- ARV (median comp)
- $142,038
- List price
- $109,900
- Delta
- -22.63%
- Verdict
- UNDERPRICED
- Comps
- 20 within 1.0 mi
Show comp detail 12 sales within ~0.75 mi
| Address | Dist | Beds/Ba | Sqft | Sold | Price | $/sf | Match |
|---|---|---|---|---|---|---|---|
| 1006 5th Ave N | 0.28mi | 3/2.0 | 1,290 (-1%) | 1mo | $145,155 | $113 | 81 |
| 901 5th Ave N | 0.29mi | 3/2.0 | 1,315 (+1%) | 14mo | $139,000 | $106 | 69 |
| 815 10th St N | 0.59mi | 3/1.0 | 1,329 (+2%) | 5mo | $218,000 | $164 | 64 |
| 102 5th St N | 0.31mi | 2/2.0 (-1) | 1,334 (+3%) | 9mo | $115,000 | $86 | 64 |
| 911 6th Ave Ave N | 0.38mi | 3/1.0 | 1,168 (-10%) | 2mo | $115,000 | $98 | 64 |
| 308 2nd St N | 0.57mi | 3/2.0 | 1,252 (-4%) | 0mo | $195,000 | $156 | 63 |
| 14 Hickory Ln | 0.29mi | 3/2.0 | 1,384 (+6%) | 14mo | $245,000 | $177 | 60 |
| 605 6th Ave. Ave S | 0.59mi | 3/2.0 | 1,324 (+2%) | 14mo | $130,000 | $98 | 54 |
| 812 9th St N | 0.58mi | 3/3.0 | 1,260 (-3%) | 10mo | $140,000 | $111 | 51 |
| 908 8th Avenue North Ave | 0.49mi | 2/2.0 (-1) | 1,128 (-13%) | 2mo | $182,500 | $162 | 45 |
| 808 9th St N | 0.56mi | 3/2.5 | 1,189 (-8%) | 11mo | $239,000 | $201 | 44 |
| 1608 Elmhurst Avenue Ave | 0.69mi | 3/1.0 | 1,156 (-11%) | 9mo | $169,900 | $147 | 42 |
Match score weights: distance 35% · size 25% · config 20% · recency 20%. Top-matched comps best support the ARV.
Projected returns pro-forma
-3.0% appreciation · 3.0% rent growth · sell at horizon
- IRR
- -5.4%
- Equity multiple
- 0.80×
- Total profit
- $-6,207
- Equity at exit
- $16,386
- IRR
- 4.3%
- Equity multiple
- 1.31×
- Total profit
- $9,591
- Equity at exit
- $9,502
Cash invested: $30,772 (down + closing). Projections, not guarantees.
Landlord ↔ Tenant lean methodology
- Overall (STATE)
- 83 Strongly Landlord-Friendly
- State Iowa
- 83 Strongly Landlord-Friendly · R+6
- County
- — inherits STATE
- City
- — inherits STATE
ZIP-level market 50548
- Home prices YoY
- -20.0%
- Active inventory
- 64
- Price-to-rent
- 7.6×
Monthly cashflow live
- Estimated rent
- $1,197 medium interval (Pro) →
- Mortgage (P&I)
- −$576
- Tax from tax record
- −$142 /mo · $1,704/yr
- Insurance
- −$46
- HOA
- −$0
- Vacancy / Maint / Mgmt
- −$251
- Net cashflow
- $182
Break-even live
Sensitivity live
| Price | -10% $244 | -5% $213 | +0% $182 | +5% $151 | +10% $120 |
|---|---|---|---|---|---|
| Rent | -10% $87 | -5% $135 | +0% $182 | +5% $229 | +10% $276 |
| Rate | -1.0pp $237 | -0.5pp $210 | base $182 | +0.5pp $153 | +1.0pp $124 |
UW: 25.0% down · 7.5% · 30yr · 1.5% tax · 5.0% vac · 8.0% maint · 8.0% mgmt
Financing live
Cash to close
- Down payment
- $27,475
- Closing costs
- $3,297
- Reserves months
- —
- Total cash needed
- —
Loan-product check · same deal, 3 products live
Conventional
25% down · 7.5% · 30yr
- Down + closing
- —
- Monthly P&I
- —
- Monthly cashflow
- —
- DSCR
- —
- Eligible?
- —
Personal DTI + credit; lowest rate.
DSCR
20% down · 8.5% · 30yr
- Down + closing
- —
- Monthly P&I
- —
- Monthly cashflow
- —
- DSCR
- —
- Eligible?
- —
No personal income docs; deal must DSCR.
Hard money
10% down · 12.0% · 12mo
- Down + closing
- —
- Monthly P&I
- —
- Monthly cashflow
- —
- DSCR
- —
- Eligible?
- —
Short-term bridge; refi at stabilization.
Listing history 1 events
-
2026-04-21$109,900 Active 660-char remark
ⓘ Source: listings_history table (triggers on properties + properties_extension) + one-shot
backfill from property_details.listing_events for pre-trigger history.
Tax reassessment forecast IA · Partial reset (capped growth)
- Current annual tax
- $1,704 · $142/mo
- Projected year-2 tax
- $1,715 · $143/mo
- Expected delta
- +$11/yr (+$1/mo · 0.6%)
ⓘ Screening estimate from a state-policy table — verify with the county assessor before closing.
Climate risk First Street
- Flood 1/10 Low FEMA zone X (unshaded) · 0% chance over 30 yrs
- Wildfire 1/10 Low
- Heat 2/10 Low 7 d/yr ≥100°F today · 16 d/yr by 30 yrs out
- Wind 2/10 Low
- Air quality 1/10 Low 0 unhealthy d/yr today · 0 by 30 yrs out
Nearby sold comps map
Loading sold comps map…
Walkable amenities ~0.75 mi
Loading nearby amenities…
Taxation est. · year 1
- Rental income
- $14,369
- − Mortgage interest
- −$6,156
- − Property taxes
- −$1,704
- − Insurance
- −$550
- − Repairs & maintenance
- −$1,149
- − Management
- −$1,149
- − Depreciation
- −$3,197
- Taxable income
- $463
- Est. tax owed @ 24.0%
- −$111
- After-tax cash flow
- $2,071/yr
For passive investors: Depreciation is non-cash, so a rental often shows a tax loss while cash-flowing — sheltering income. Rental losses are passive: they offset passive income freely, and up to $25,000/yr can offset ordinary (W-2) income if you actively participate and your MAGI is under $100k (phasing out to $0 by $150k); unused losses carry forward. On sale, claimed depreciation is recaptured at up to 25%, and gains may owe capital-gains tax (a 1031 exchange can defer both). Figures are a year-1 estimate at your 24.0% rate — not tax advice; consult a CPA.
Condition & rehab AI · 12 photos
This charming three-bedroom home requires moderate renovations to improve its condition and increase its value. Key areas for improvement include updating the kitchen and bathroom, painting the exterior and interior, and addressing some minor maintenance items.
Repairs flagged
- Major kitchen cabinets — dated and in poor condition
- Major bathroom fixtures — dated and in poor condition
- Moderate exterior siding — weathered and some discoloration
- Minor interior walls — some discoloration
Value-add opportunities
- Both update kitchen cabinets and fixtures — modernizing the kitchen would increase both resale and rental value
- Both paint exterior siding — improving the exterior would increase both resale and rental value
- Both paint interior walls — improving the interior would increase both resale and rental value
Renovation cost estimate screening
| Repair item | Severity | Est. cost |
|---|---|---|
| kitchen cabinets · dated and in poor condition | Major | $15,000–50,000 |
| bathroom fixtures · dated and in poor condition | Major | $15,000–50,000 |
| exterior siding · weathered and some discoloration | Moderate | $3,000–15,000 |
| interior walls · some discoloration | Minor | $500–3,000 |
| Total estimated repair cost · 4 items | $33,500–118,000 |
Value-add ROI direction
- Both update kitchen cabinets and fixtures — modernizing the kitchen would increase both resale and rental value ↑
- Both paint exterior siding — improving the exterior would increase both resale and rental value ↑
- Both paint interior walls — improving the interior would increase both resale and rental value ↑
ⓘ Cost ranges are severity-bucket heuristics (US national rule-of-thumb). Get contractor quotes + a written scope before underwriting a rehab budget.
Schools (NCES district)
- District
- Humboldt Community School District
- NCES district ID
- 1914370
- Math proficiency
- 75% ▼ -5.00%
- Reading proficiency
- 72% ▼ -7.00%
- Median HH income
- $48,318
- Composite
- 62.13/100
- National rank
- #707
- State rank
- #92 of 289 in IA
Livability — Humboldt
- Score
- 83/100
- State rank
- #34
- US rank
- #1000
Category grades
Schools grade is shown separately in the Schools card above.
Census & demographics
- Census place
- Humboldt, IA
- City population
- 5,482
- Population (ZIP)
- 5,482
Population outlook (Humboldt County) Hauer SSP2
- Today (2025)
- 9,265 people
- By 2030
- 9,141 · -1.3%
- By 2040
- 8,904 · -3.9%
- By 2050
- 8,448 · -8.8%
- By 2075
- 7,742 · -16.4%
- By 2100
- 6,414 · -30.8%
Race, ethnicity, and origin ACS 2023
- Neighborhood character
- Predominantly White (94%)
- Race & ethnicity
- White 94% Two or more races 5% Hispanic / Latino 4% Asian 1%
- Common ancestry
- Portuguese 14% Iranian 2% Italian 1%
- Foreign-born
- 3% · Canada
- Languages at home
- 97% English-only · Spanish 3%
Political lean MEDSL · Humboldt
- 2024 margin
- Solid R (+50.0) · D 24.4% · R 74.4% · Other 1.2%
- 2008→2024 swing
- -35.7pp toward R · 2008: -14.3pp · 2024: -50.0pp
- All cycles
- 2024: R+50.0 2020: R+44.6 2016: R+46.0 2012: R+22.1 2008: R+14.3
Not yet ingested
- Civics
- —
Market trends
- HPI YoY
- ▼ -51.69%
- Current HPI
- 206.5373
- Rent YoY
- —
- Metro
- —
- State GDP YoY
- ▲ 2.48%
- F500 in state
- 4
Industry mix (Fortune 500 HQ in IA)
| Industry | F500 HQs | Revenue |
|---|---|---|
| Financial Services | 1 | $16B |
|
||
| Retail / Convenience | 1 | $15B |
|
||
Price history
2 events — show timeline
- 2026-05-21 Pending — IAR
- 2026-04-21 Listed $109,900 IAR
Property tax history
+80.6%/yrLatest (2025): $1,704 · +12.8% YoY. Source: county tax records.
Cash-flow waterfall
monthlySold comps — $/sqft
last 12 mo · ≤1 miLoading sold comps…