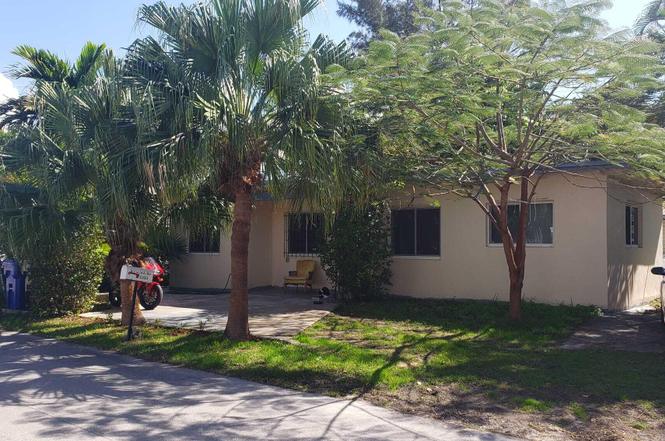
2334 NE 136th St · North Miami Beach, FL
Flood risk 9/10 · Severe
- FEMA flood zone
- AE
- Chance of flooding over 30 yrs
- 0.99%
- Est. flood insurance / yr
- $1,737 – $8,500
Fire risk 2/10 · Minimal
- Est. fire insurance / yr
- $947 – $1,759
Heat risk 10/10 · Severe
- Hot days now (above 104°F)
- 7 days/yr
- Hot days in 30 yrs
- 29 days/yr
Wind risk 10/10 · Severe
- Chance of severe wind over 30 yrs
- 99.0%
Air-quality risk 2/10 · Minimal
- Unhealthy air days now
- 1 days/yr
- Unhealthy air days in 30 yrs
- 2 days/yr
Risk factors via First Street. Map © Google.
Why this score? — see what drove the C grade
The composite is a weighted blend of 9 inputs, each scored 0–100. Each bar is that input's sub-score; the figure is the points it added to the 100-point composite (weight × sub-score).
- Cash flow +22.8/30.0
- ARV discount +7.5/15.0
- DSCR +7.3/10.0
- 1% rule +5.1/10.0
- Schools +4.2/10.0
- Livability +4.1/5.0
- Rent growth +2.5/5.0
- Condition / age +2.5/5.0
- Appreciation +0.0/10.0
$314,000
🖨 Deal sheet (PDF) 📄 Offer letter ✓ Due diligence
Listing remarks
Discover this charming single-family CBS (concrete block) home featuring 2 bedrooms and 1 bathroom, situated on two lots in a convenient and desirable neighborhood. The home offers impact windows for added security and energy efficiency, along with a new AC system. The kitchen is equipped with quality appliances including Miele appliances, an electric cooktop, microwave, and a Sub-Zero refrigerator. The double lot provides additional outdoor space and great potential for future possibilities. Ideal for investors or end users -- there is no HOA and the property can be rented right away. The location is excellent: • Close to major stores such as Target, Costco, and Home Depot • On
Key facts
- Quality appliances
- Double lot
- New ac system
Tags
Property features AI
Finance
- Other: Pets not allowed
- HOA & community: Association amenities include a basketball court
Exterior
- Parking: 5 open parking spaces
- Utilities: Public water; Water service available
- Home design: Single-family residence; One story; Faces west; Resale condition; Entry level: Main
- Construction: Block construction; Other roof
- Exterior features: Not waterfront; Waterfront features: None
Interior
- Kitchen: Microwave; Refrigerator
- Bedrooms: 2 main-level bedrooms
- Bathrooms: 1 full bathroom
- Heating & cooling: Central heating; Central air conditioning
- Interior features: Split bedroom layout; Unfurnished
Neighborhood map
What this means for you Summary
Snapshot
- This is a 1-bed/1.0-bath single-family listed at $314k.
Deal economics
- At list price, monthly cash flow is $121 ($1k/yr) — positive.
- The deal already cash-flows at list — no discount required.
- Meets the 1% rule at list price ($3k rent vs $314k).
- Recommended offer: $286k (9.0% below list) — sets the bar for market timing.
- Cap rate 8.4% vs local median 5.2% in North Miami Beach — top-decile yield for the area; either an underpriced asset or a hidden risk that comps aren't pricing in. Stress-test before assuming the spread holds.
Location & tenants
- Location reads 82/100 on livability (#71 in FL, #1,177 nationally) — a professional / high-income tenant draw. Strengths: commute A+, housing A+, health & safety A+; Watch: employment D+, crime F.
- Miami-Dade (suburban): math 45% / reading 54% proficiency, ranked #40 of 73 in FL (top 55%) — families likely to look elsewhere, expect single-tenant / working-renter base with shorter leases; 64% free/reduced lunch — lower-income household profile, screen leases tightly.
- Zoned schools: David Lawrence Jr. K-8 Center (math 43% / reading 50%, grade D-, #1,223 of 2,144 statewide, top 57%, 1,282 students, 55% FRL); John F. Kennedy Middle School (math 47% / reading 55%, grade C, #237 of 571 statewide, top 43%, 1,074 students, 67% FRL); Alonzo & Tracy Mourning Senior High School (math 38% / reading 50%, grade F, #244 of 667 statewide, top 37%, 1,597 students, 48% FRL).
- Market conditions: Rents soft (-0.1%/yr); 335 active listings in the ZIP; 10,051 units permitted in Miami-Dade County in 2024 (7,758 in 5+ unit buildings).
- At $3,183/mo this rent would consume 60% of the median local household income ($63k/yr) (locally 1914% of renters already pay >50% of income on rent) — very limited rent-growth headroom before tenants either downsize or default.
Forward outlook
- Local home prices are declining (-3.0%/yr); year-one equity from $2k of loan paydown is wiped out by about $9k of value loss. Plan a longer hold.
- Miami-Dade County population projected at +28% by 2050 — long-run rental-demand tailwind backs the buy-and-hold thesis.
Negotiation context
- It's been on market 104 days — a 9% lower offer ($286k) is reasonable based on typical stale-listing flexibility.
- Current owner paid $70k; list at $314k implies a 349% gain — meaningful room to come down on a strong offer.
Risks & watch-outs
- Watch-outs: flood insurance adds $427/mo; built in 1957 — expect roof / HVAC / electrical / plumbing capex.
- Climate carrying-cost: in FEMA flood zone AE (mandatory federal flood insurance); severe wind risk, 99% chance of damaging wind over 30y; extreme-heat days projected 7→29/yr by 2055 (HVAC capex compounding) — expect insurance premiums to compound above CPI over the hold.
Questions for the listing agent
- It's been on market 104 days. Have you received any prior offers? Is the seller open to a 9% concession, seller financing, or rate buy-down credit?
- Built in 1957 — when were the roof, HVAC, electrical panel, plumbing, and water heater last replaced?
- What's the actual annual flood-insurance premium (NFIP or private), and is the property in a SFHA with mandatory coverage?
- Why hasn't it sold? Are there any deal-killer items the seller is aware of (foundation, flood, title, zoning, code violations)?
- Is there a deadline driving the sale (1031 exchange, divorce, estate, relocation)? That informs how much negotiation room exists.
- Crime grade is F in this area — have there been break-ins, vandalism, or insurance claims at this property in the last 3 years? What carrier currently insures it and at what premium?
- What's the average days-on-market for RENTAL listings here right now (not sales)? A rising rental-DOM trend means longer vacancies and softer asking-rent achievability than the comps imply.
- What's the recent tenant-quality profile in this submarket — average credit score on applications, eviction rate, late-payment / NSF rate, and stable-employment percentage? A property-management company in the area should have these aggregated.
- How much new for-sale + rental construction is in the pipeline within 1–3 miles? Heavy new supply typically softens prices + rents 12–24 months out; constrained supply supports both.
Investment metrics
- 1% rule
- 1.01% ✓
- Cap rate
- 8.39%
- Cash-on-cash
- 7.47%
- DSCR
- 1.33
- GRM
- 8.2
CMA / ARV
No comps found within radius.
Projected returns pro-forma
-3.0% appreciation · 0.0% rent growth · sell at horizon
- IRR
- -17.4%
- Equity multiple
- 0.40×
- Total profit
- $-52,324
- Equity at exit
- $46,818
- IRR
- -17.2%
- Equity multiple
- 0.19×
- Total profit
- $-70,945
- Equity at exit
- $27,149
Cash invested: $87,920 (down + closing). Projections, not guarantees.
Landlord ↔ Tenant lean methodology
- Overall (STATE)
- 87 Strongly Landlord-Friendly
- State Florida
- 87 Strongly Landlord-Friendly · R+3
- County
- — inherits STATE
- City
- — inherits STATE
ZIP-level market 33181
- Rents YoY
- -0.1%
- Active inventory
- 335
- Price-to-rent
- 8.2×
Monthly cashflow live
- Estimated rent
- $3,183 medium interval (Pro) →
- Mortgage (P&I)
- −$1,647
- Tax from tax record
- −$190 /mo · $2,279/yr
- Insurance
- −$131
- Flood insurance flood zone
- −$427 /mo · $5,118/yr
- HOA
- −$0
- Vacancy / Maint / Mgmt
- −$668
- Net cashflow
- $121
Break-even live
Sensitivity live
| Price | -10% $299 | -5% $210 | +0% $121 | +5% $32 | +10% $-57 |
|---|---|---|---|---|---|
| Rent | -10% $-131 | -5% $-5 | +0% $121 | +5% $247 | +10% $372 |
| Rate | -1.0pp $279 | -0.5pp $201 | base $121 | +0.5pp $40 | +1.0pp $-43 |
UW: 25.0% down · 7.5% · 30yr · 1.5% tax · 5.0% vac · 8.0% maint · 8.0% mgmt
Financing live
Cash to close
- Down payment
- $78,500
- Closing costs
- $9,420
- Reserves months
- —
- Total cash needed
- —
Loan-product check · same deal, 3 products live
Conventional
25% down · 7.5% · 30yr
- Down + closing
- —
- Monthly P&I
- —
- Monthly cashflow
- —
- DSCR
- —
- Eligible?
- —
Personal DTI + credit; lowest rate.
DSCR
20% down · 8.5% · 30yr
- Down + closing
- —
- Monthly P&I
- —
- Monthly cashflow
- —
- DSCR
- —
- Eligible?
- —
No personal income docs; deal must DSCR.
Hard money
10% down · 12.0% · 12mo
- Down + closing
- —
- Monthly P&I
- —
- Monthly cashflow
- —
- DSCR
- —
- Eligible?
- —
Short-term bridge; refi at stabilization.
Listing history 16 events
-
2026-06-18days on market $314,000 Active 104 DOM
-
2026-06-17days on market $314,000 Active 103 DOM
-
2026-06-16days on market $314,000 Active 102 DOM
-
2026-06-15days on market $314,000 Active 101 DOM
-
2026-06-13days on market $314,000 Active 99 DOM
-
2026-06-09days on market $314,000 Active 95 DOM
-
2026-06-08days on market $314,000 Active 94 DOM
-
2026-06-07days on market $314,000 Active 93 DOM
-
2026-06-04days on market $314,000 Active 90 DOM
-
2026-06-03days on market $314,000 Active 89 DOM
-
2026-06-02days on market $314,000 Active 88 DOM
-
2026-06-01days on market $314,000 Active 87 DOM
-
2026-05-31days on market $314,000 Active 86 DOM
-
2026-04-17price $314,000
-
2026-03-06$324,000 Active
-
2005-04-21soldstatus $70,000
ⓘ Source: listings_history table (triggers on properties + properties_extension) + one-shot
backfill from property_details.listing_events for pre-trigger history.
Tax reassessment forecast FL · Resets to sale price
- Current annual tax
- $2,279 · $190/mo
- Projected year-2 tax
- $2,606 · $217/mo
- Expected delta
- +$328/yr (+$27/mo · 14.4%)
ⓘ Screening estimate from a state-policy table — verify with the county assessor before closing.
Climate risk First Street
- Flood 9/10 Extreme FEMA zone AE · 99% chance over 30 yrs
- Wildfire 2/10 Low
- Heat 10/10 Extreme 7 d/yr ≥104°F today · 29 d/yr by 30 yrs out
- Wind 10/10 Extreme 99% chance of damaging wind over 30 yrs
- Air quality 2/10 Low 1 unhealthy d/yr today · 2 by 30 yrs out
Nearby sold comps map
Loading sold comps map…
Walkable amenities ~0.75 mi
Loading nearby amenities…
Taxation est. · year 1
- Rental income
- $38,200
- − Mortgage interest
- −$17,589
- − Property taxes
- −$2,279
- − Insurance
- −$6,688
- − Repairs & maintenance
- −$3,056
- − Management
- −$3,056
- − Depreciation
- −$9,135
- Taxable loss
- −$3,603
- Est. tax savings @ 24.0%
- +$865
- After-tax cash flow
- $2,316/yr
For passive investors: Depreciation is non-cash, so a rental often shows a tax loss while cash-flowing — sheltering income. Rental losses are passive: they offset passive income freely, and up to $25,000/yr can offset ordinary (W-2) income if you actively participate and your MAGI is under $100k (phasing out to $0 by $150k); unused losses carry forward. On sale, claimed depreciation is recaptured at up to 25%, and gains may owe capital-gains tax (a 1031 exchange can defer both). Figures are a year-1 estimate at your 24.0% rate — not tax advice; consult a CPA.
Schools (NCES district)
- District
- Miami-Dade
- NCES district ID
- 1200390
- Math proficiency
- 45% ▼ -16.00%
- Reading proficiency
- 54% ▼ -5.00%
- Median HH income
- $43,928
- Composite
- 41.76/100
- National rank
- #3397
- State rank
- #40 of 73 in FL
Livability — North Miami Beach
- Score
- 82/100
- State rank
- #71
- US rank
- #1177
Category grades
Schools grade is shown separately in the Schools card above.
Census & demographics
- Census place
- North Miami Beach, FL
- County
- Miami-Dade County · 2,697,751 people
- City population
- 90,324
- Metro
- Miami-Fort Lauderdale-Pompano Beach, FL
- Population (ZIP)
- 20,848
- Household income
- $63,275
- Rent vs Own
- Severe rent burden
- 1914.0
Population outlook (Miami-Dade County) Hauer SSP2
- Today (2025)
- 3,126,439 people
- By 2030
- 3,325,765 · +6.4%
- By 2040
- 3,697,561 · +18.3%
- By 2050
- 4,012,134 · +28.3%
- By 2075
- 4,605,612 · +47.3%
- By 2100
- 4,866,598 · +55.7%
Race, ethnicity, and origin ACS 2023
- Neighborhood character
- Diverse neighborhood (Simpson 0.67)
- Race & ethnicity
- Hispanic / Latino 44% Black 29% Two or more races 23% White 22% Asian 1%
- Hispanic origin (detail)
- Puerto Rican 2% Cuban 8% Dominican 2% Salvadoran 3%
- Common ancestry
- Hispanic 18% Lithuanian 3% Italian 1%
- Foreign-born
- 51% · Canada, Jamaica, Dominican Republic
- Languages at home
- 28% English-only · Spanish 44% French/Haitian/Cajun 18% Other Indo-European 4%
Political lean MEDSL · Miami-Dade
- 2024 margin
- R (+11.4) · D 43.9% · R 55.4%
- 2008→2024 swing
- -27.6pp toward R · 2008: 16.1pp · 2024: -11.4pp
- All cycles
- 2024: R+11.4 2020: D+7.3 2016: D+29.6 2012: D+23.7 2008: D+16.1
Not yet ingested
- Civics
- —
Market trends
- HPI YoY
- ▼ -334.57%
- Current HPI
- 341.3285
- Rent YoY
- ▼ -0.11%
- Metro
- Miami-Fort Lauderdale-Pompano Beach, FL
- State GDP YoY
- ▲ 3.28%
- F500 in state
- 36
Industry mix (Fortune 500 HQ in FL)
| Industry | F500 HQs | Revenue |
|---|---|---|
| Industrial Technology | 2 | $29B |
|
||
| Insurance | 2 | $17B |
|
||
| Retail | 1 | $60B |
|
||
| Technology Distribution | 1 | $58B |
|
||
| Homebuilding | 1 | $35B |
|
||
| Technology Manufacturing | 1 | $35B |
|
||
Price history
+348.6% since first listed3 events — show timeline
- 2026-04-17 Price Changed $314,000 Beaches MLS
- 2026-03-06 Listed $324,000 Beaches MLS
- 2005-04-21 Sold (Public Records) $70,000 Public Records
Property tax history
+7.5%/yrLatest (2025): $2,279 · -13.0% YoY. Source: county tax records.
Cash-flow waterfall
monthlySold comps — $/sqft
last 12 mo · ≤1 miLoading sold comps…