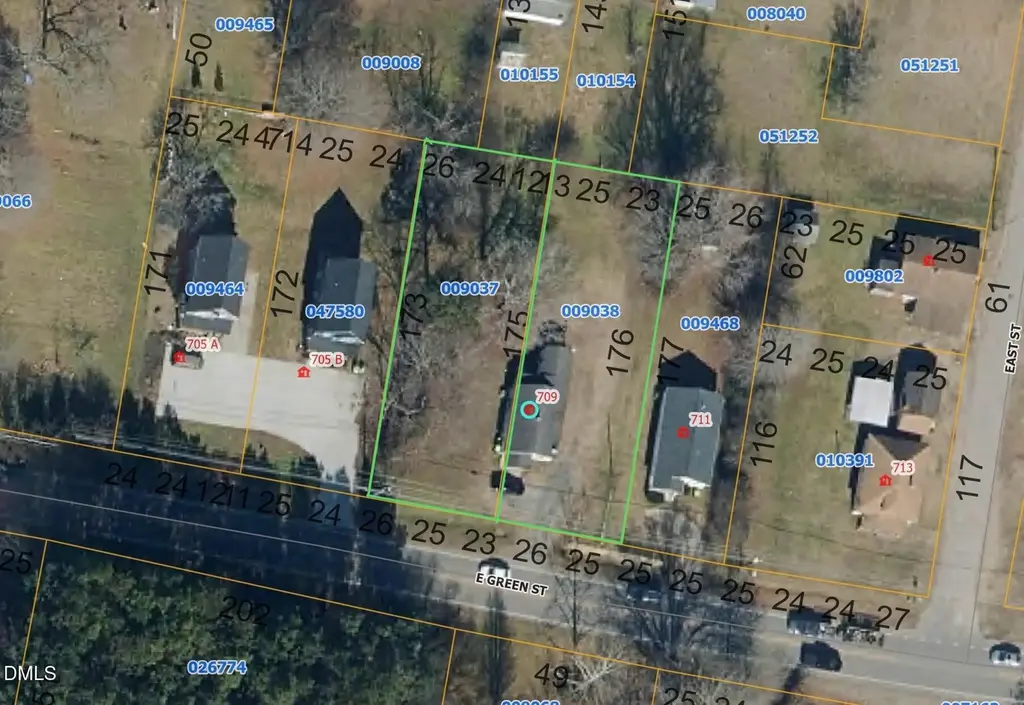
709 E Green St · Franklinton, NC
Flood risk 1/10 · Minimal
- FEMA flood zone
- X (unshaded)
- Chance of flooding over 30 yrs
- 0.0%
- Est. flood insurance / yr
- $507 – $1,088
Fire risk 2/10 · Minimal
- Est. fire insurance / yr
- $906 – $1,684
Heat risk 6/10 · Moderate
- Hot days now (above 106°F)
- 7 days/yr
- Hot days in 30 yrs
- 17 days/yr
Wind risk 6/10 · Moderate
- Chance of severe wind over 30 yrs
- 48.0%
Air-quality risk 2/10 · Minimal
- Unhealthy air days now
- 1 days/yr
- Unhealthy air days in 30 yrs
- 1 days/yr
Risk factors via First Street. Map © Google.
Why this score? — see what drove the A grade
The composite is a weighted blend of 9 inputs, each scored 0–100. Each bar is that input's sub-score; the figure is the points it added to the 100-point composite (weight × sub-score).
- Cash flow +30.0/30.0
- ARV discount +15.0/15.0
- 1% rule +10.0/10.0
- DSCR +10.0/10.0
- Appreciation +9.2/10.0
- Livability +3.1/5.0
- Schools +3.0/10.0
- Rent growth +2.5/5.0
- Condition / age +2.5/5.0
$119,000
🖨 Deal sheet (PDF) 📄 Offer letter ✓ Due diligence
Listing remarks
Builder & Investment Opportunity with Endless Potential on Two Subdivided Lots! Nestled on approximately 0.49 acres, this unique property offers incredible flexibility for builders, investors, or buyers looking to create something special. Property consists of TWO subdivided lots totaling approximately 0.49 acres that must be sold together. Existing 3-bedroom, 1-bath home is currently situated across both parcels and offers potential for renovation, rental income, or future redevelopment. Whether you envision renovating the current home for personal use or rental income, or exploring the potential for future redevelopment, this property presents a rare opportunity in a growing ar
Key facts
- Two subdivided lots
- Future redevelopment
- Rental income
Tags
Property features AI
Finance
- Other: Lot approximately 0.49 acres (zoned RSH)
- HOA & community: No homeowners association
Exterior
- Utilities: Public water; Public sewer
- Home design: Single-story house; Facing direction not specified
- Construction: See remarks for construction materials
- Exterior features: Shingle roof; Publicly maintained road access
Interior
- Bedrooms: Three bedrooms (all on the main level)
- Flooring: Carpet
- Bathrooms: One full bathroom
- Heating & cooling: Central heating; Central air conditioning
- Interior features: Carpet flooring
Neighborhood map
What this means for you Summary
Snapshot
- This is a 3-bed/1.0-bath single-family listed at $119k.
Deal economics
- At list price, monthly cash flow is $588 ($7k/yr) — positive.
- The deal already cash-flows at list — no discount required.
- Meets the 1% rule at list price ($2k rent vs $119k).
- Cap rate 12.2% vs local median 3.1% in Franklinton — top-decile yield for the area; either an underpriced asset or a hidden risk that comps aren't pricing in. Stress-test before assuming the spread holds.
Location & tenants
- Location reads 61/100 on livability (#491 in NC) — a middle-class / working-renter tenant base. Strengths: cost of living A+, housing A+; Watch: crime D, amenities F, commute F.
- Franklin County Schools (rural): math 34% / reading 37% proficiency, ranked #128 of 178 in NC (top 72%) — families likely to look elsewhere, expect single-tenant / working-renter base with shorter leases.
- Zoned schools: Franklinton Elementary (math 29% / reading 25%, grade F, #1,033 of 1,410 statewide, top 76%, 522 students, 81% FRL); Franklinton Middle (math 26% / reading 27%, grade F, #381 of 475 statewide, top 81%, 247 students, 78% FRL); Franklinton High (math 57% / reading 60%, grade C, #235 of 535 statewide, top 45%, 1,182 students, 48% FRL).
- Market conditions: 251 active listings in the ZIP; 948 units permitted in Franklin County in 2024 (0 in 5+ unit buildings).
Forward outlook
- In year one you build about $11k of equity ($823 loan paydown + $10k appreciation (8.4% local appreciation)).
- Franklin County population projected at +13% by 2050 — modest demand growth; plan on rents tracking national, not racing it.
- At projected returns (8.4% appreciation + 3.0% rent growth), your $33k cash investment doubles in ~2 years — after that, you're playing with house money.
- By year 4, paydown + projected appreciation supports a ~$38k cash-out refi (75% LTV) — recoverable capital for the next deal without selling this one.
Negotiation context
- Only 3 days on market — expect competitive offers; lowballing is unlikely to land.
Risks & watch-outs
- Watch-outs: built in 1956 — expect roof / HVAC / electrical / plumbing capex.
- Climate carrying-cost: major wind risk, 48% chance of damaging wind over 30y; extreme-heat days projected 7→17/yr by 2055 (HVAC capex compounding) — expect insurance premiums to compound above CPI over the hold.
Questions for the listing agent
- Built in 1956 — when were the roof, HVAC, electrical panel, plumbing, and water heater last replaced?
- Is there a deadline driving the sale (1031 exchange, divorce, estate, relocation)? That informs how much negotiation room exists.
- Schools are F-rated, which usually means shorter tenancies and higher turnover. Who's the typical renter profile here, and what's been the actual vacancy rate?
- Crime grade is D in this area — have there been break-ins, vandalism, or insurance claims at this property in the last 3 years? What carrier currently insures it and at what premium?
- What's the average days-on-market for RENTAL listings here right now (not sales)? A rising rental-DOM trend means longer vacancies and softer asking-rent achievability than the comps imply.
- What's the recent tenant-quality profile in this submarket — average credit score on applications, eviction rate, late-payment / NSF rate, and stable-employment percentage? A property-management company in the area should have these aggregated.
- How much new for-sale + rental construction is in the pipeline within 1–3 miles? Heavy new supply typically softens prices + rents 12–24 months out; constrained supply supports both.
Investment metrics
- 1% rule
- 1.50% ✓
- Cap rate
- 12.23%
- Cash-on-cash
- 21.19%
- DSCR
- 1.94
- GRM
- 5.6
CMA / ARV
- ARV (on-the-fly)
- $189,024
- Comps found
- 12
Show comp detail 12 sales within ~0.75 mi
| Address | Dist | Beds/Ba | Sqft | Sold | Price | $/sf | Match |
|---|---|---|---|---|---|---|---|
| 206 Layton St | 0.11mi | 3/1.0 | 1,086 (+3%) | 7mo | $190,000 | $175 | 85 |
| 807 E Green St | 0.10mi | 2/1.0 (-1) | 963 (-9%) | 4mo | $79,900 | $83 | 72 |
| 707 E Mason St | 0.16mi | 2/1.0 (-1) | 965 (-9%) | 4mo | $175,000 | $181 | 70 |
| 2 Dover St | 0.33mi | 3/1.0 | 1,145 (+8%) | 8mo | $190,000 | $166 | 64 |
| 16 Dover St | 0.38mi | 2/1.0 (-1) | 1,008 (-4%) | 9mo | $180,000 | $179 | 62 |
| 306 Mitchell Ave | 0.20mi | 3/1.0 | 1,183 (+12%) | 11mo | $210,000 | $178 | 62 |
| 20 Dover St | 0.42mi | 3/2.0 | 1,147 (+9%) | 9mo | $289,000 | $252 | 55 |
| 4428 West River Rd | 0.61mi | 3/1.0 | 982 (-7%) | 10mo | $210,000 | $214 | 52 |
| 210 E Green St | 0.56mi | 3/1.0 | 914 (-13%) | 3mo | $195,000 | $213 | 49 |
| 5063 Nc-56 Hwy | 0.57mi | 2/1.5 (-1) | 954 (-10%) | 7mo | $140,000 | $147 | 44 |
| 119 Oak Ridge Rd | 0.47mi | 3/2.0 | 1,202 (+14%) | 12mo | $314,900 | $262 | 41 |
| 4 Second St | 0.46mi | 2/1.0 (-1) | 1,200 (+14%) | 13mo | $152,500 | $127 | 40 |
Match score weights: distance 35% · size 25% · config 20% · recency 20%. Top-matched comps best support the ARV.
Projected returns pro-forma
8.42% appreciation · 3.0% rent growth · sell at horizon
- IRR
- 37.4%
- Equity multiple
- 3.69×
- Total profit
- $89,748
- Equity at exit
- $93,839
- IRR
- 33.1%
- Equity multiple
- 7.99×
- Total profit
- $232,814
- Equity at exit
- $189,642
Cash invested: $33,320 (down + closing). Projections, not guarantees.
Landlord ↔ Tenant lean methodology
- Overall (STATE)
- 85 Strongly Landlord-Friendly
- State North Carolina
- 85 Strongly Landlord-Friendly · R+3
- County
- — inherits STATE
- City
- — inherits STATE
ZIP-level market 27525
- Home prices YoY
- 3.0%
- Active inventory
- 251
- Price-to-rent
- 5.6×
Monthly cashflow live
- Estimated rent
- $1,782 medium interval (Pro) →
- Mortgage (P&I)
- −$624
- Tax from tax record
- −$146 /mo · $1,746/yr
- Insurance
- −$50
- HOA
- −$0
- Vacancy / Maint / Mgmt
- −$374
- Net cashflow
- $588
Break-even live
Sensitivity live
| Price | -10% $656 | -5% $622 | +0% $588 | +5% $555 | +10% $521 |
|---|---|---|---|---|---|
| Rent | -10% $448 | -5% $518 | +0% $588 | +5% $659 | +10% $729 |
| Rate | -1.0pp $648 | -0.5pp $619 | base $588 | +0.5pp $558 | +1.0pp $526 |
UW: 25.0% down · 7.5% · 30yr · 1.5% tax · 5.0% vac · 8.0% maint · 8.0% mgmt
Financing live
Cash to close
- Down payment
- $29,750
- Closing costs
- $3,570
- Reserves months
- —
- Total cash needed
- —
Loan-product check · same deal, 3 products live
Conventional
25% down · 7.5% · 30yr
- Down + closing
- —
- Monthly P&I
- —
- Monthly cashflow
- —
- DSCR
- —
- Eligible?
- —
Personal DTI + credit; lowest rate.
DSCR
20% down · 8.5% · 30yr
- Down + closing
- —
- Monthly P&I
- —
- Monthly cashflow
- —
- DSCR
- —
- Eligible?
- —
No personal income docs; deal must DSCR.
Hard money
10% down · 12.0% · 12mo
- Down + closing
- —
- Monthly P&I
- —
- Monthly cashflow
- —
- DSCR
- —
- Eligible?
- —
Short-term bridge; refi at stabilization.
Listing history 2 events
-
2026-05-31remarks 695-char remark
-
2026-05-31$119,000 Pending 3 DOM
ⓘ Source: listings_history table (triggers on properties + properties_extension) + one-shot
backfill from property_details.listing_events for pre-trigger history.
Tax reassessment forecast NC · Resets to sale price
- Current annual tax
- $1,746 · $146/mo
- Projected year-2 tax
- $1,746 · $146/mo
- Expected delta
- $0/yr ($0/mo · 0.0%)
ⓘ Screening estimate from a state-policy table — verify with the county assessor before closing.
Climate risk First Street
- Flood 1/10 Low FEMA zone X (unshaded) · 0% chance over 30 yrs
- Wildfire 2/10 Low
- Heat 6/10 Major 7 d/yr ≥106°F today · 17 d/yr by 30 yrs out
- Wind 6/10 Major 48% chance of damaging wind over 30 yrs
- Air quality 2/10 Low 1 unhealthy d/yr today · 1 by 30 yrs out
Nearby sold comps map
Loading sold comps map…
Walkable amenities ~0.75 mi
Loading nearby amenities…
Taxation est. · year 1
- Rental income
- $21,381
- − Mortgage interest
- −$6,666
- − Property taxes
- −$1,746
- − Insurance
- −$595
- − Repairs & maintenance
- −$1,710
- − Management
- −$1,710
- − Depreciation
- −$3,462
- Taxable income
- $5,491
- Est. tax owed @ 24.0%
- −$1,318
- After-tax cash flow
- $5,743/yr
For passive investors: Depreciation is non-cash, so a rental often shows a tax loss while cash-flowing — sheltering income. Rental losses are passive: they offset passive income freely, and up to $25,000/yr can offset ordinary (W-2) income if you actively participate and your MAGI is under $100k (phasing out to $0 by $150k); unused losses carry forward. On sale, claimed depreciation is recaptured at up to 25%, and gains may owe capital-gains tax (a 1031 exchange can defer both). Figures are a year-1 estimate at your 24.0% rate — not tax advice; consult a CPA.
Schools (NCES district)
- District
- Franklin County Schools
- NCES district ID
- 3701530
- Math proficiency
- 34% ▬ 0.00%
- Reading proficiency
- 37% ▼ -4.00%
- Median HH income
- $44,630
- Composite
- 30.25/100
- National rank
- #6286
- State rank
- #128 of 178 in NC
Livability — Franklinton
- Score
- 61/100
- State rank
- #491
- US rank
- #18002
Category grades
Schools grade is shown separately in the Schools card above.
Census & demographics
- Census place
- Franklinton, NC
- County
- Franklin County · 64,885 people
- City population
- 17,110
- Metro
- Raleigh-Cary, NC
- Population (ZIP)
- 17,110
- Household income
- $73,036
- Rent vs Own
- Severe rent burden
- 446.0
Population outlook (Franklin County) Hauer SSP2
- Today (2025)
- 69,848 people
- By 2030
- 72,480 · +3.8%
- By 2040
- 76,682 · +9.8%
- By 2050
- 78,993 · +13.1%
- By 2075
- 82,888 · +18.7%
- By 2100
- 80,784 · +15.7%
Race, ethnicity, and origin ACS 2023
- Neighborhood character
- Predominantly White (66%)
- Race & ethnicity
- White 66% Black 24% Hispanic / Latino 6% Two or more races 5%
- Hispanic origin (detail)
- Mexican 3% Cuban 2%
- Common ancestry
- Slovak 3% Serbian 2% Italian 2%
- Foreign-born
- 3% · Canada
- Languages at home
- 94% English-only · Spanish 3% German/W. Germanic 1%
Political lean MEDSL · Franklin
- 2024 margin
- R (+13.6) · D 42.7% · R 56.3%
- 2008→2024 swing
- -12.9pp toward R · 2008: -0.7pp · 2024: -13.6pp
- All cycles
- 2024: R+13.6 2020: R+13.4 2016: R+11.7 2012: R+4.2 2008: R+0.7
Not yet ingested
- Civics
- —
Market trends
- HPI YoY
- ▲ 8.42%
- Current HPI
- 294.1531
- Rent YoY
- —
- Metro
- Raleigh-Cary, NC
- State GDP YoY
- ▲ 3.28%
- F500 in state
- 26
Industry mix (Fortune 500 HQ in NC)
| Industry | F500 HQs | Revenue |
|---|---|---|
| Financial Services | 2 | $213B |
|
||
| Retail | 2 | $95B |
|
||
| Industrial Conglomerate | 1 | $38B |
|
||
| Metals / Steel | 1 | $35B |
|
||
| Utilities | 1 | $30B |
|
||
| Industrial Machinery | 1 | $19B |
|
||
Price history
+1090.0% since first listed4 events — show timeline
- 2026-05-25 Pending — TMLS
- 2026-05-22 Listed $119,000 TMLS
- 2020-11-24 Sold (Public Records) $119,000 Public Records
- 2001-07-05 Sold (Public Records) $10,000 Public Records
Property tax history
+5.6%/yrLatest (2025): $1,746 · -1.1% YoY. Source: county tax records.
Cash-flow waterfall
monthlySold comps — $/sqft
last 12 mo · ≤1 miLoading sold comps…