17159 State Highway 108 · Pelican Rapids, MN
Flood risk 1/10 · Minimal
- FEMA flood zone
- —
- Chance of flooding over 30 yrs
- 0.0%
- Est. flood insurance / yr
- —
Fire risk 1/10 · Minimal
- Est. fire insurance / yr
- $888 – $1,650
Heat risk 1/10 · Minimal
- Hot days now (above 96°F)
- 7 days/yr
- Hot days in 30 yrs
- 12 days/yr
Wind risk 2/10 · Minimal
- Chance of severe wind over 30 yrs
- —
Air-quality risk 3/10 · Minor
- Unhealthy air days now
- 2 days/yr
- Unhealthy air days in 30 yrs
- 3 days/yr
Risk factors via First Street. Map © Google.
Why this score? — see what drove the B grade
The composite is a weighted blend of 9 inputs, each scored 0–100. Each bar is that input's sub-score; the figure is the points it added to the 100-point composite (weight × sub-score).
- Cash flow +30.0/30.0
- 1% rule +10.0/10.0
- DSCR +10.0/10.0
- ARV discount +7.5/15.0
- Schools +4.3/10.0
- Livability +3.9/5.0
- Rent growth +2.5/5.0
- Condition / age +2.5/5.0
- Appreciation +0.0/10.0
$79,900
🖨 Deal sheet (PDF) 📄 Offer letter ✓ Due diligence
Listing remarks
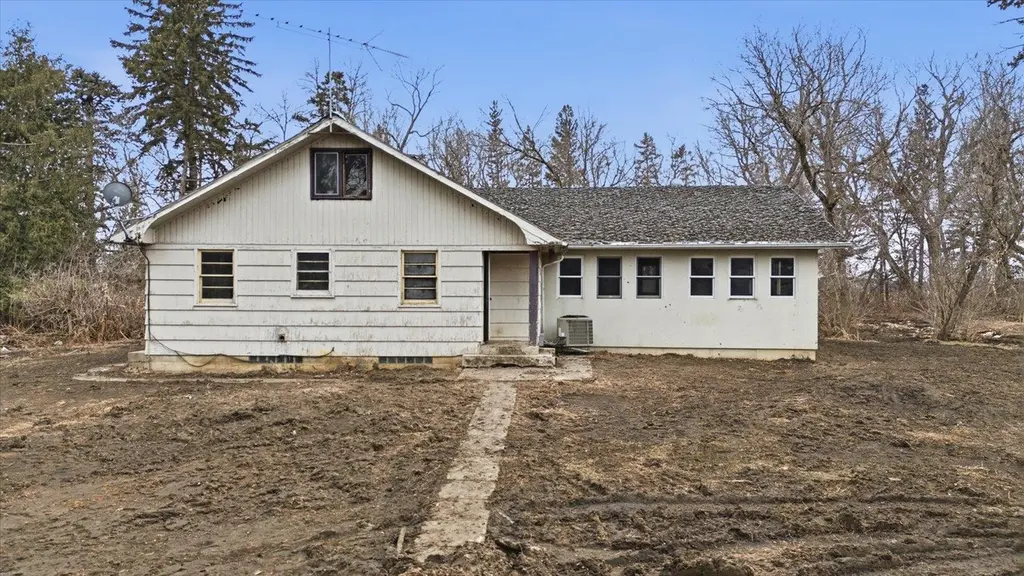
Rural property offering 4 bedrooms and 3 bathrooms with approximately 1,700 finished square feet situated on 9+ acres. Features include a detached 2-car garage and multiple outbuildings including barn(s), storage sheds, and additional utility structures. Property offers a combination of open and wooded areas with direct access from a state highway location. Provides a flexible layout with main-level living space and additional bedrooms. .
Key facts
- Flexible layout
- 9.06 acre lot
- 2 garage spots
Tags
Property features AI
Finance
- Other: Lot of about 9.06 acres; Multiple outbuildings included
Exterior
- Parking: Detached 2-car garage (garage dimensions 22.4 x 26.2)
- Utilities: Well water; Private septic tank with drainage field; Propane
- Home design: Residential property; One and one-half stories; Main living area on the main level; Approximately 1,766 above-grade living area
- Construction: Built on block foundation; Wood construction
- Exterior features: Wood exterior; Barn(s); Grain bin; Storage shed; Highway road frontage
Interior
- Kitchen: Kitchen located on main level
- Bedrooms: 4 bedrooms, all on the main level
- Bathrooms: 2 full bathrooms; 1 half bathroom
- Heating & cooling: Forced air heating; No central air
- Interior features: Unfinished basement; Block foundation
- Laundry & utility: Propane fuel
Neighborhood map
What this means for you Summary
Snapshot
- This is a 4-bed/3.0-bath single-family listed at $80k.
Deal economics
- At list price, monthly cash flow is $846 ($10k/yr) — positive.
- The deal already cash-flows at list — no discount required.
- Meets the 1% rule at list price ($2k rent vs $80k).
- Cap rate 19.0% vs local median 1.4% in Pelican Rapids — top-decile yield for the area; either an underpriced asset or a hidden risk that comps aren't pricing in. Stress-test before assuming the spread holds.
Location & tenants
- Location reads 78/100 on livability (#114 in MN, #2,581 nationally) — a middle-class / working-renter tenant base. Strengths: crime A+, cost of living A+, housing A+; Watch: amenities F, commute F.
- Pelican Rapids Public School District (rural): math 45% / reading 54% proficiency, ranked #123 of 301 in MN (top 41%) — families likely to look elsewhere, expect single-tenant / working-renter base with shorter leases.
- Zoned schools: Viking Elementary School (math 58% / reading 62%, grade B-, #209 of 857 statewide, top 25%, 460 students, 61% FRL); Pelican Rapids Alt Center Mid-Level (math 10% / reading 10%); Pelican Rapids Secondary (math 32% / reading 47%, grade F, #246 of 471 statewide, top 59%, 405 students, 56% FRL) — zoned schools average 58% FRL vs 39% district-wide (20 pts higher); higher-poverty schools than district average — tighter screening recommended.
- Zoned-school proficiency averages 36% at this address vs 50% district-wide (-13 pts) — the specific schools serving this property underperform the Pelican Rapids Public School District average; the district grade overstates school quality for this exact location.
- Market conditions: 175 active listings in the ZIP; 140 units permitted in Otter Tail County in 2024 (48 in 5+ unit buildings).
Forward outlook
- Local home prices are declining (-3.0%/yr); year-one equity from $552 of loan paydown is wiped out by about $2k of value loss. Plan a longer hold.
- At projected returns (-3.0% appreciation + 3.0% rent growth), your $22k cash investment doubles in ~3 years — after that, you're playing with house money.
Negotiation context
- Only 11 days on market — expect competitive offers; lowballing is unlikely to land.
- 2 sale attempts since 18y ago with the ask held roughly flat each time — persistent listings suggest the price (not the market) is what's stuck; bring a comps-based counter.
Risks & watch-outs
- Watch-outs: built in 1950 — expect roof / HVAC / electrical / plumbing capex.
Questions for the listing agent
- Built in 1950 — when were the roof, HVAC, electrical panel, plumbing, and water heater last replaced?
- Is there a deadline driving the sale (1031 exchange, divorce, estate, relocation)? That informs how much negotiation room exists.
- What's the average days-on-market for RENTAL listings here right now (not sales)? A rising rental-DOM trend means longer vacancies and softer asking-rent achievability than the comps imply.
- What's the recent tenant-quality profile in this submarket — average credit score on applications, eviction rate, late-payment / NSF rate, and stable-employment percentage? A property-management company in the area should have these aggregated.
- How much new for-sale + rental construction is in the pipeline within 1–3 miles? Heavy new supply typically softens prices + rents 12–24 months out; constrained supply supports both.
Investment metrics
- 1% rule
- 2.30% ✓
- Cap rate
- 19.00%
- Cash-on-cash
- 45.38%
- DSCR
- 3.02
- GRM
- 3.6
CMA / ARV
No comps found within radius.
Projected returns pro-forma
-3.0% appreciation · 3.0% rent growth · sell at horizon
- IRR
- 42.5%
- Equity multiple
- 2.83×
- Total profit
- $40,999
- Equity at exit
- $11,913
- IRR
- 48.7%
- Equity multiple
- 5.71×
- Total profit
- $105,338
- Equity at exit
- $6,908
Cash invested: $22,372 (down + closing). Projections, not guarantees.
Landlord ↔ Tenant lean methodology
- Overall (STATE)
- 46 Balanced
- State Minnesota
- 46 Balanced · D+2
- County
- — inherits STATE
- City
- — inherits STATE
ZIP-level market 56572
- Home prices YoY
- -14.1%
- Active inventory
- 175
- Price-to-rent
- 3.6×
Monthly cashflow live
- Estimated rent
- $1,841 medium interval (Pro) →
- Mortgage (P&I)
- −$419
- Tax from tax record
- −$156 /mo · $1,872/yr
- Insurance
- −$33
- HOA
- −$0
- Vacancy / Maint / Mgmt
- −$387
- Net cashflow
- $846
Break-even live
Sensitivity live
| Price | -10% $891 | -5% $869 | +0% $846 | +5% $823 | +10% $801 |
|---|---|---|---|---|---|
| Rent | -10% $701 | -5% $773 | +0% $846 | +5% $919 | +10% $991 |
| Rate | -1.0pp $886 | -0.5pp $866 | base $846 | +0.5pp $825 | +1.0pp $804 |
UW: 25.0% down · 7.5% · 30yr · 1.5% tax · 5.0% vac · 8.0% maint · 8.0% mgmt
Financing live
Cash to close
- Down payment
- $19,975
- Closing costs
- $2,397
- Reserves months
- —
- Total cash needed
- —
Loan-product check · same deal, 3 products live
Conventional
25% down · 7.5% · 30yr
- Down + closing
- —
- Monthly P&I
- —
- Monthly cashflow
- —
- DSCR
- —
- Eligible?
- —
Personal DTI + credit; lowest rate.
DSCR
20% down · 8.5% · 30yr
- Down + closing
- —
- Monthly P&I
- —
- Monthly cashflow
- —
- DSCR
- —
- Eligible?
- —
No personal income docs; deal must DSCR.
Hard money
10% down · 12.0% · 12mo
- Down + closing
- —
- Monthly P&I
- —
- Monthly cashflow
- —
- DSCR
- —
- Eligible?
- —
Short-term bridge; refi at stabilization.
Listing history 6 events
-
2026-05-05status Pending
-
2026-04-30historical Contingent - Third Party Approval
-
2026-04-24$79,900 Active
-
2009-10-28soldstatus $179,000
-
2008-11-17soldstatus $179,000
-
2008-03-17$179,000
ⓘ Source: listings_history table (triggers on properties + properties_extension) + one-shot
backfill from property_details.listing_events for pre-trigger history.
Tax reassessment forecast MN · Partial reset (capped growth)
- Current annual tax
- $1,872 · $156/mo
- Projected year-2 tax
- $1,872 · $156/mo
- Expected delta
- $0/yr ($0/mo · 0.0%)
ⓘ Screening estimate from a state-policy table — verify with the county assessor before closing.
Climate risk First Street
- Flood 1/10 Low 0% chance over 30 yrs
- Wildfire 1/10 Low
- Heat 1/10 Low 7 d/yr ≥96°F today · 12 d/yr by 30 yrs out
- Wind 2/10 Low
- Air quality 3/10 Moderate 2 unhealthy d/yr today · 3 by 30 yrs out
Nearby sold comps map
Loading sold comps map…
Walkable amenities ~0.75 mi
Loading nearby amenities…
Taxation est. · year 1
- Rental income
- $22,091
- − Mortgage interest
- −$4,476
- − Property taxes
- −$1,872
- − Insurance
- −$400
- − Repairs & maintenance
- −$1,767
- − Management
- −$1,767
- − Depreciation
- −$2,324
- Taxable income
- $9,485
- Est. tax owed @ 24.0%
- −$2,276
- After-tax cash flow
- $7,876/yr
For passive investors: Depreciation is non-cash, so a rental often shows a tax loss while cash-flowing — sheltering income. Rental losses are passive: they offset passive income freely, and up to $25,000/yr can offset ordinary (W-2) income if you actively participate and your MAGI is under $100k (phasing out to $0 by $150k); unused losses carry forward. On sale, claimed depreciation is recaptured at up to 25%, and gains may owe capital-gains tax (a 1031 exchange can defer both). Figures are a year-1 estimate at your 24.0% rate — not tax advice; consult a CPA.
Schools (NCES district)
- District
- Pelican Rapids Public School District
- NCES district ID
- 2728170
- Math proficiency
- 45% ▼ -11.00%
- Reading proficiency
- 54% ▼ -3.00%
- Median HH income
- $51,933
- Composite
- 42.52/100
- National rank
- #3203
- State rank
- #123 of 301 in MN
Livability — Pelican Rapids
- Score
- 78/100
- State rank
- #114
- US rank
- #2581
Category grades
Schools grade is shown separately in the Schools card above.
Census & demographics
- Population (ZIP)
- 5,900
Population outlook (Otter Tail County) Hauer SSP2
- Today (2025)
- 58,183 people
- By 2030
- 58,267 · +0.1%
- By 2040
- 57,999 · -0.3%
- By 2050
- 57,183 · -1.7%
- By 2075
- 57,638 · -0.9%
- By 2100
- 54,697 · -6.0%
Race, ethnicity, and origin ACS 2023
- Neighborhood character
- Predominantly White (78%)
- Race & ethnicity
- White 78% Hispanic / Latino 13% Two or more races 8% Black 4%
- Hispanic origin (detail)
- Mexican 9% Puerto Rican 1%
- Common ancestry
- Portuguese 30% Scottish 2% Romanian 2%
- Foreign-born
- 9% · Canada
- Languages at home
- 87% English-only · Spanish 7% Russian/Polish/Slavic 1% German/W. Germanic 0%
Political lean MEDSL · Otter Tail
- 2024 margin
- Solid R (+34.2) · D 32.1% · R 66.3% · Other 1.6%
- 2008→2024 swing
- -21.3pp toward R · 2008: -12.9pp · 2024: -34.2pp
- All cycles
- 2024: R+34.2 2020: R+32.5 2016: R+35.9 2012: R+21.2 2008: R+12.9
Not yet ingested
- Civics
- —
Market trends
- HPI YoY
- ▼ -37.55%
- Current HPI
- 229.1081
- Rent YoY
- —
- Metro
- —
- State GDP YoY
- ▲ 2.41%
- F500 in state
- 34
Industry mix (Fortune 500 HQ in MN)
| Industry | F500 HQs | Revenue |
|---|---|---|
| Healthcare | 2 | $407B |
|
||
| Retail | 2 | $150B |
|
||
| Consumer Goods | 2 | $32B |
|
||
| Industrial Machinery | 2 | $6B |
|
||
| Agriculture | 1 | $40B |
|
||
| Healthcare / Medical Devices | 1 | $32B |
|
||
Price history
-55.4% since first listed6 events — show timeline
- 2026-05-05 Pending — NORTHSTARMLS as Distributed by MLS Grid
- 2026-04-30 Contingent — NORTHSTARMLS as Distributed by MLS Grid
- 2026-04-24 Listed $79,900 NORTHSTARMLS as Distributed by MLS Grid
- 2009-10-28 Sold (Public Records) $179,000 Public Records
- 2008-11-17 Sold (Public Records) $179,000 Public Records
- 2008-03-17 Listed $179,000 NORTHSTARMLS as Distributed by MLS Grid
Property tax history
+41.2%/yrLatest (2025): $1,872 · -1.6% YoY. Source: county tax records.
Cash-flow waterfall
monthlySold comps — $/sqft
last 12 mo · ≤1 miLoading sold comps…