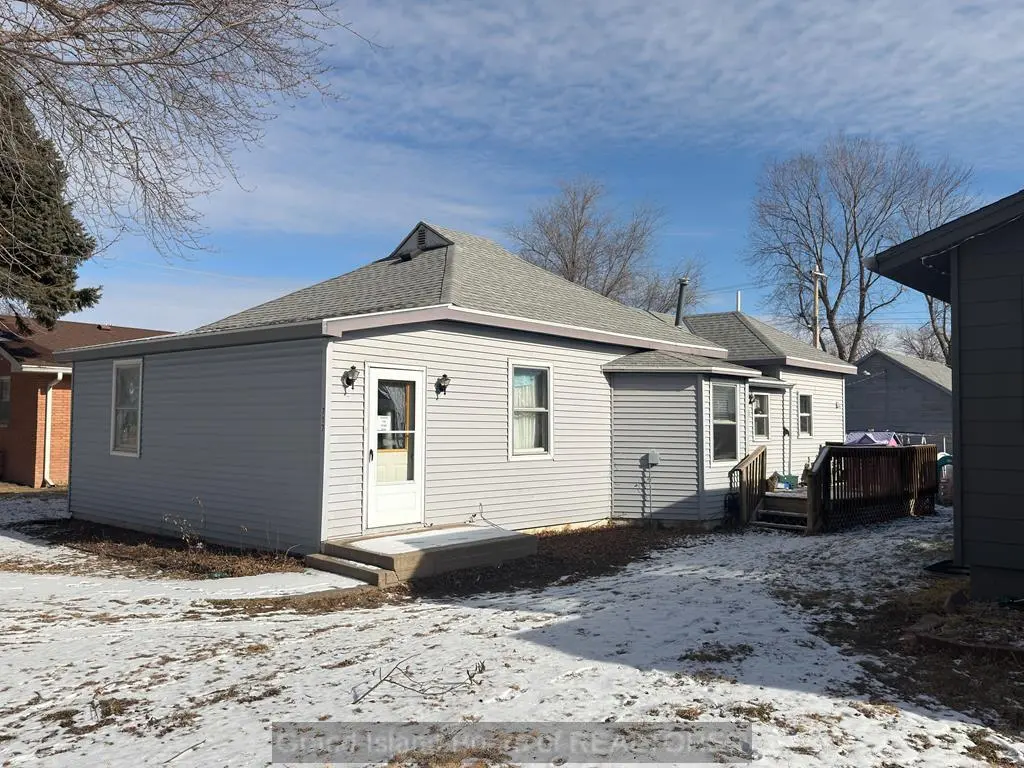
717 Verona Ave · Ravenna, NE
Flood risk 1/10 · Minimal
- FEMA flood zone
- X (unshaded)
- Chance of flooding over 30 yrs
- 0.0%
- Est. flood insurance / yr
- $507 – $1,088
Fire risk 5/10 · Moderate
- Est. fire insurance / yr
- $1,161 – $2,155
Heat risk 3/10 · Minor
- Hot days now (above 102°F)
- 7 days/yr
- Hot days in 30 yrs
- 16 days/yr
Wind risk 2/10 · Minimal
- Chance of severe wind over 30 yrs
- —
Air-quality risk 2/10 · Minimal
- Unhealthy air days now
- 1 days/yr
- Unhealthy air days in 30 yrs
- 1 days/yr
Risk factors via First Street. Map © Google.
Why this score? — see what drove the C+ grade
The composite is a weighted blend of 9 inputs, each scored 0–100. Each bar is that input's sub-score; the figure is the points it added to the 100-point composite (weight × sub-score).
- Cash flow +22.8/30.0
- ARV discount +15.0/15.0
- DSCR +7.3/10.0
- 1% rule +5.1/10.0
- Schools +4.8/10.0
- Livability +3.6/5.0
- Rent growth +2.5/5.0
- Condition / age +2.5/5.0
- Appreciation +0.0/10.0
$102,000
🖨 Deal sheet 📄 Offer letter ✓ Due diligence
Listing remarks MLS
Investment Opportunity! Brand new roof on house and garage, and vinyl siding on north side of house in 2025. Furnace and A/C new in 2020. Two bedrooms plus a playroom that could easily be a third bedroom. There is vinyl siding on the house but the garage is wood.
Key facts
- New furnace
- New a c
- Vinyl siding
Tags
Neighborhood map
What this means for you Summary
Snapshot
- This is a 2-bed/1.0-bath single-family listed at $102k.
Deal economics
- At list price, monthly cash flow is $178 ($2k/yr) — positive.
- The deal already cash-flows at list — no discount required.
- Meets the 1% rule at list price ($1k rent vs $102k).
- Recommended offer: $90k (12.0% below list) — sets the bar for market timing.
Location & tenants
- Location reads 71/100 on livability (#199 in NE) — a middle-class / working-renter tenant base. Strengths: crime A+, cost of living A+, housing A+; Watch: health & safety C-, amenities F, commute F.
- Ravenna Public Schools (rural): math 60% / reading 50% proficiency, ranked #113 of 245 in NE (top 46%) — acceptable for families but not a draw, mixed tenant base, ~2y average lease.
- Market conditions: 23 active listings in the ZIP; 125 units permitted in Buffalo County in 2024 (0 in 5+ unit buildings).
Forward outlook
- Local home prices are declining (-3.0%/yr); year-one equity from $705 of loan paydown is wiped out by about $3k of value loss. Plan a longer hold.
- Buffalo County population projected at +31% by 2050 — long-run rental-demand tailwind backs the buy-and-hold thesis.
Negotiation context
- It's been on market 139 days — a 12% lower offer ($90k) is reasonable based on typical stale-listing flexibility.
- 2 sale attempts since 8y ago; this cycle's ask has dropped $10k (9%) from the opening price — seller is motivated, your offer sets the floor, not the list.
- Current owner paid $18k; list at $102k implies a 467% gain — meaningful room to come down on a strong offer.
Risks & watch-outs
- Watch-outs: built in 1920 — expect roof / HVAC / electrical / plumbing capex.
- Climate carrying-cost: moderate wildfire risk — expect insurance premiums to compound above CPI over the hold.
Questions for the listing agent
- It's been on market 139 days. Have you received any prior offers? Is the seller open to a 12% concession, seller financing, or rate buy-down credit?
- Built in 1920 — when were the roof, HVAC, electrical panel, plumbing, and water heater last replaced?
- Why hasn't it sold? Are there any deal-killer items the seller is aware of (foundation, flood, title, zoning, code violations)?
- Is there a deadline driving the sale (1031 exchange, divorce, estate, relocation)? That informs how much negotiation room exists.
- What's the average days-on-market for RENTAL listings here right now (not sales)? A rising rental-DOM trend means longer vacancies and softer asking-rent achievability than the comps imply.
- What's the recent tenant-quality profile in this submarket — average credit score on applications, eviction rate, late-payment / NSF rate, and stable-employment percentage? A property-management company in the area should have these aggregated.
- How much new for-sale + rental construction is in the pipeline within 1–3 miles? Heavy new supply typically softens prices + rents 12–24 months out; constrained supply supports both.
Investment metrics
- 1% rule
- 1.01% ✓
- Cap rate
- 8.39%
- Cash-on-cash
- 7.49%
- DSCR
- 1.33
- GRM
- 8.2
CMA / ARV
- ARV (median comp)
- $127,972
- List price
- $102,000
- Delta
- -20.29%
- Verdict
- UNDERPRICED
- Comps
- 18 within 1.0 mi
Show comp detail 8 sales within ~0.75 mi
| Address | Dist | Beds/Ba | Sqft | Sold | Price | $/sf | Match |
|---|---|---|---|---|---|---|---|
| 414 W Genoa St | 0.34mi | 2/1.0 | 1,220 (-2%) | 1mo | $145,000 | $119 | 80 |
| 312 Alba Ave | 0.29mi | 3/1.0 (+1) | 1,206 (-3%) | 6mo | $145,900 | $121 | 71 |
| 323 Milan Ave | 0.34mi | 3/1.0 (+1) | 1,284 (+3%) | 5mo | $60,000 | $47 | 69 |
| 524 Kufus Ave | 0.22mi | 2/1.0 | 1,140 (-8%) | 9mo | $180,000 | $158 | 69 |
| 508 Padua Ave | 0.19mi | 2/2.0 | 1,288 (+4%) | 23mo | $120,000 | $93 | 62 |
| 323 Padua Ave | 0.27mi | 3/2.0 (+1) | 1,256 (+1%) | 18mo | $102,000 | $81 | 61 |
| 502 Kufus Ave | 0.25mi | 2/1.0 | 1,404 (+13%) | 7mo | $121,000 | $86 | 61 |
| 524 Padua Ave | 0.16mi | 2/1.0 | 1,112 (-10%) | 20mo | $105,000 | $94 | 58 |
Match score weights: distance 35% · size 25% · config 20% · recency 20%. Top-matched comps best support the ARV.
Projected returns pro-forma
-3.0% appreciation · 3.0% rent growth · sell at horizon
- IRR
- -4.9%
- Equity multiple
- 0.82×
- Total profit
- $-5,206
- Equity at exit
- $15,209
- IRR
- 4.8%
- Equity multiple
- 1.35×
- Total profit
- $9,979
- Equity at exit
- $8,819
Cash invested: $28,560 (down + closing). Projections, not guarantees.
Landlord ↔ Tenant lean methodology
- Overall (STATE)
- 83 Strongly Landlord-Friendly
- State Nebraska
- 83 Strongly Landlord-Friendly · R+13
- County
- — inherits STATE
- City
- — inherits STATE
ZIP-level market 68869
- Home prices YoY
- -21.9%
- Active inventory
- 23
- Price-to-rent
- 8.2×
Monthly cashflow live
- Estimated rent
- $1,035 medium interval (Pro) →
- Mortgage (P&I)
- −$535
- Tax from tax record
- −$62 /mo · $747/yr
- Insurance
- −$42
- HOA
- −$0
- Vacancy / Maint / Mgmt
- −$217
- Net cashflow
- $178
Break-even live
UW: 25.0% down · 7.5% · 30yr · 1.5% tax · 5.0% vac · 8.0% maint · 8.0% mgmt
Financing live
Cash to close
- Down payment
- $25,500
- Closing costs
- $3,060
- Reserves months
- —
- Total cash needed
- —
Loan-product check · same deal, 3 products live
Conventional
25% down · 7.5% · 30yr
- Down + closing
- —
- Monthly P&I
- —
- Monthly cashflow
- —
- DSCR
- —
- Eligible?
- —
Personal DTI + credit; lowest rate.
DSCR
20% down · 8.5% · 30yr
- Down + closing
- —
- Monthly P&I
- —
- Monthly cashflow
- —
- DSCR
- —
- Eligible?
- —
No personal income docs; deal must DSCR.
Hard money
10% down · 12.0% · 12mo
- Down + closing
- —
- Monthly P&I
- —
- Monthly cashflow
- —
- DSCR
- —
- Eligible?
- —
Short-term bridge; refi at stabilization.
Listing history 20 events
-
2026-06-18days on market $102,000 Active 139 DOM
-
2026-06-17days on market $102,000 Active 138 DOM
-
2026-06-16days on market $102,000 Active 137 DOM
-
2026-06-15days on market $102,000 Active 136 DOM
-
2026-06-13days on market $102,000 Active 134 DOM
-
2026-06-12days on market $102,000 Active 133 DOM
-
2026-06-09days on market $102,000 Active 130 DOM
-
2026-06-09price $102,000 Active 129 DOM
-
2026-06-08days on market $107,000 Active 129 DOM
-
2026-06-07days on market $107,000 Active 128 DOM
-
2026-06-05days on market $107,000 Active 126 DOM
-
2026-06-04days on market $107,000 Active 124 DOM
-
2026-06-02days on market $107,000 Active 123 DOM
-
2026-06-01days on market $107,000 Active 122 DOM
-
2026-05-31days on market $107,000 Active 121 DOM
-
2026-04-06price $107,000 263-char remark
Show marketing remark (263 chars)
Investment Opportunity! Brand new roof on house and garage, and vinyl siding on north side of house in 2025. Furnace and A/C new in 2020. Two bedrooms plus a playroom that could easily be a third bedroom. There is vinyl siding on the house but the garage is wood.
-
2026-01-29$112,000 Active 263-char remark
Show marketing remark (263 chars)
Investment Opportunity! Brand new roof on house and garage, and vinyl siding on north side of house in 2025. Furnace and A/C new in 2020. Two bedrooms plus a playroom that could easily be a third bedroom. There is vinyl siding on the house but the garage is wood.
-
2019-03-15soldstatus $18,000
-
2019-03-01soldstatus $18,000 160-char remark
Show marketing remark (160 chars)
Seller is moving and wants to sell property quickly. Any of you looking for a winter project this might be your baby! Come take a look and see what you think!!
-
2018-11-13$24,900 160-char remark
Show marketing remark (160 chars)
Seller is moving and wants to sell property quickly. Any of you looking for a winter project this might be your baby! Come take a look and see what you think!!
ⓘ Source: listings_history table (triggers on properties + properties_extension) + one-shot
backfill from property_details.listing_events for pre-trigger history.
Tax reassessment forecast NE · Resets to sale price
- Current annual tax
- $747 · $62/mo
- Projected year-2 tax
- $1,765 · $147/mo
- Expected delta
- +$1,017/yr (+$85/mo · 136.2%)
ⓘ Screening estimate from a state-policy table — verify with the county assessor before closing.
Climate risk First Street
- Flood 1/10 Low FEMA zone X (unshaded) · 0% chance over 30 yrs
- Wildfire 5/10 Major
- Heat 3/10 Moderate 7 d/yr ≥102°F today · 16 d/yr by 30 yrs out
- Wind 2/10 Low
- Air quality 2/10 Low 1 unhealthy d/yr today · 1 by 30 yrs out
Nearby sold comps map
Loading sold comps map…
Walkable amenities ~0.75 mi
Loading nearby amenities…
Taxation est. · year 1
- Rental income
- $12,423
- − Mortgage interest
- −$5,714
- − Property taxes
- −$747
- − Insurance
- −$510
- − Repairs & maintenance
- −$994
- − Management
- −$994
- − Depreciation
- −$2,967
- Taxable income
- $497
- Est. tax owed @ 24.0%
- −$119
- After-tax cash flow
- $2,019/yr
For passive investors: Depreciation is non-cash, so a rental often shows a tax loss while cash-flowing — sheltering income. Rental losses are passive: they offset passive income freely, and up to $25,000/yr can offset ordinary (W-2) income if you actively participate and your MAGI is under $100k (phasing out to $0 by $150k); unused losses carry forward. On sale, claimed depreciation is recaptured at up to 25%, and gains may owe capital-gains tax (a 1031 exchange can defer both). Figures are a year-1 estimate at your 24.0% rate — not tax advice; consult a CPA.
Schools (NCES district)
- District
- Ravenna Public Schools
- NCES district ID
- 3175960
- Math proficiency
- 60% ▲ 15.00%
- Reading proficiency
- 50% ▼ -1.00%
- Median HH income
- $42,945
- Composite
- 48.09/100
- National rank
- #4760
- State rank
- #113 of 245 in NE
Livability — Ravenna
- Score
- 71/100
- State rank
- #199
- US rank
- #7147
Category grades
Schools grade is shown separately in the Schools card above.
Census & demographics
- Census place
- Ravenna, NE
- Population (ZIP)
- 2,158
Population outlook (Buffalo County) Hauer SSP2
- Today (2025)
- 54,980 people
- By 2030
- 58,298 · +6.0%
- By 2040
- 64,975 · +18.2%
- By 2050
- 72,054 · +31.1%
- By 2075
- 90,838 · +65.2%
- By 2100
- 106,838 · +94.3%
Race, ethnicity, and origin ACS 2023
- Neighborhood character
- Predominantly White (93%)
- Race & ethnicity
- White 93% Two or more races 6% Hispanic / Latino 1%
- Common ancestry
- Romanian 6% Portuguese 3% Slovak 1%
- Foreign-born
- 1% · South Korea
Political lean MEDSL · Buffalo
- 2024 margin
- Solid R (+44.9) · D 26.9% · R 71.8% · Other 1.3%
- 2008→2024 swing
- -7.5pp toward R · 2008: -37.5pp · 2024: -44.9pp
- All cycles
- 2024: R+44.9 2020: R+43.4 2016: R+47.5 2012: R+42.6 2008: R+37.5
Not yet ingested
- Civics
- —
Market trends
- HPI YoY
- ▼ -51.72%
- Current HPI
- 183.9479
- Rent YoY
- —
- Metro
- —
- State GDP YoY
- ▲ 0.68%
- F500 in state
- 2
Industry mix (Fortune 500 HQ in NE)
| Industry | F500 HQs | Revenue |
|---|---|---|
| Conglomerate | 1 | $371B |
|
||
Price history
+329.7% since first listed5 events — show timeline
- 2026-04-06 Price Changed $107,000 GIBOR
- 2026-01-29 Listed $112,000 GIBOR
- 2019-03-15 Sold (Public Records) $18,000 Public Records
- 2019-03-01 Sold (MLS) $18,000 GMNMLS
- 2018-11-13 Listed $24,900 GMNMLS
Property tax history
+0.5%/yrLatest (2025): $747 · +8.0% YoY. Source: county tax records.
Cash-flow waterfall
monthlySold comps — $/sqft
last 12 mo · ≤1 miLoading sold comps…