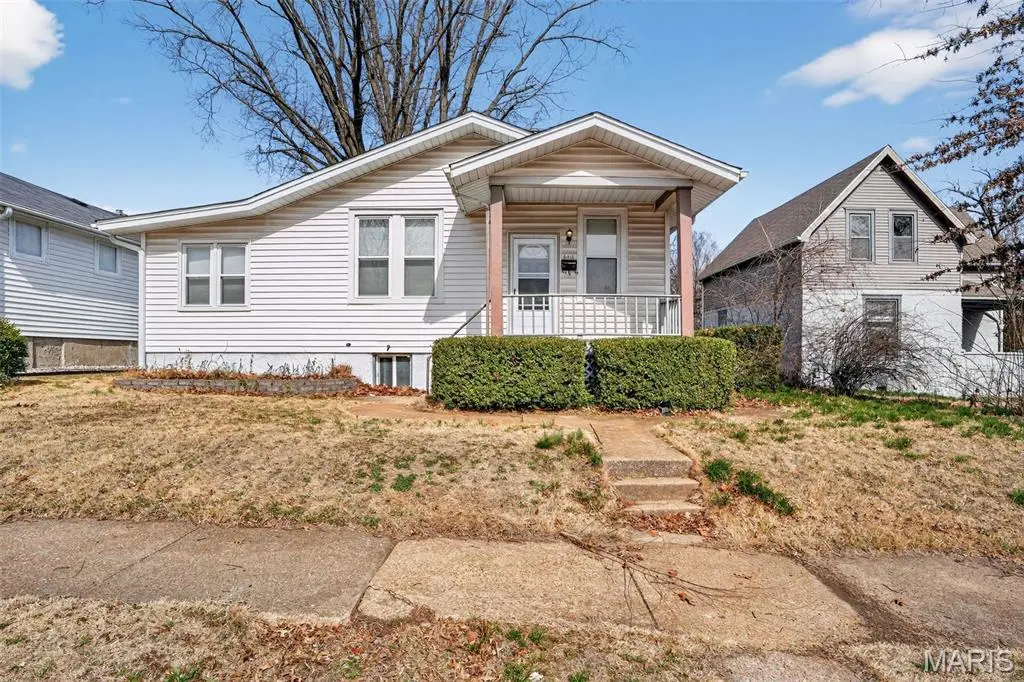
6815 Etzel Ave · University City, MO
Flood risk 1/10 · Minimal
- FEMA flood zone
- X (unshaded)
- Chance of flooding over 30 yrs
- 0.0%
- Est. flood insurance / yr
- $473 – $860
Fire risk 1/10 · Minimal
- Est. fire insurance / yr
- $1,054 – $1,958
Heat risk 5/10 · Moderate
- Hot days now (above 107°F)
- 7 days/yr
- Hot days in 30 yrs
- 21 days/yr
Wind risk 2/10 · Minimal
- Chance of severe wind over 30 yrs
- 1.0%
Air-quality risk 4/10 · Minor
- Unhealthy air days now
- 4 days/yr
- Unhealthy air days in 30 yrs
- 5 days/yr
Risk factors via First Street. Map © Google.
Why this score? — see what drove the B grade
The composite is a weighted blend of 9 inputs, each scored 0–100. Each bar is that input's sub-score; the figure is the points it added to the 100-point composite (weight × sub-score).
- Cash flow +30.0/30.0
- ARV discount +14.9/15.0
- DSCR +10.0/10.0
- 1% rule +8.2/10.0
- Livability +3.7/5.0
- Rent growth +3.4/5.0
- Condition / age +2.5/5.0
- Schools +1.9/10.0
- Appreciation +0.0/10.0
$129,900
🖨 Deal sheet 📄 Offer letter ✓ Due diligence
Listing remarks MLS
Welcome home to this charming one-story single-family residence in St. Louis featuring inviting curb appeal and a covered front entry. Inside, you'll find neutral colors and abundant natural light that create a warm and welcoming atmosphere throughout. The home offers a comfortable blend of tile, hardwood, and carpet flooring, adding both style and functionality. The spacious living room flows into the formal dining area, creating a great space for gatherings and everyday living. The dining room also features a beautiful built-in buffet—perfect for displaying special occasion china or treasured keepsakes. The updated kitchen is a standout, showcasing gorgeous granite countertops, a stylish tile backsplash, and modern appliances including a gas stove, dishwasher, and refrigerator. With 3 bedrooms and 1 bathroom, this home provides comfortable living space along with a full basement that includes laundry hookups and plenty of room for storage or future possibilities. This home blends classic charm with thoughtful updates—ready for you to move in and enjoy!
Key facts
- Built-in buffet
- Modern appliances
- Full basement
Tags
Neighborhood map
What this means for you Summary
Snapshot
- This is a 3-bed/1.0-bath single-family listed at $130k.
Deal economics
- At list price, monthly cash flow is $488 ($6k/yr) — positive.
- The deal already cash-flows at list — no discount required.
- Meets the 1% rule at list price ($2k rent vs $130k).
- Recommended offer: $118k (9.0% below list) — sets the bar for market timing.
- Cap rate 10.8% vs local median 4.9% in University City — top-decile yield for the area; either an underpriced asset or a hidden risk that comps aren't pricing in. Stress-test before assuming the spread holds.
Location & tenants
- Location reads 73/100 on livability (#84 in MO) — a middle-class / working-renter tenant base. Strengths: employment A+, housing A+, cost of living B; Watch: amenities D-, commute D-, health & safety F.
- University City (suburban): math 15% / reading 26% proficiency, ranked #297 of 324 in MO (top 92%) — low school quality limits family demand, transient renter base, plan for 1-2y turnover; 67% free/reduced lunch — lower-income household profile, screen leases tightly.
- Market conditions: Rents rising (+3.6%/yr); 162 active listings in the ZIP; 40 comparable units currently listed for rent nearby; rentals at typical pace (median 24d on market — plan ~3-4 weeks tenant-placement turnaround); 40% of comp listings sitting > 30 days — soft ceiling on asking rent; solid renter incomes; 920 units permitted in St. Louis County in 2024 (250 in 5+ unit buildings).
Forward outlook
- Local home prices are declining (-3.0%/yr); year-one equity from $898 of loan paydown is wiped out by about $4k of value loss. Plan a longer hold.
- At projected returns (-3.0% appreciation + 3.6% rent growth), your $36k cash investment doubles in ~8 years — after that, you're playing with house money.
Negotiation context
- It's been on market 104 days — a 9% lower offer ($118k) is reasonable based on typical stale-listing flexibility.
- 2 sale attempts since 6y ago; this cycle's ask has dropped $15k (10%) from the opening price — seller is motivated, your offer sets the floor, not the list.
- Current owner paid $78k; list at $130k implies a 67% gain — meaningful room to come down on a strong offer.
Risks & watch-outs
- Watch-outs: built in 1917 — expect roof / HVAC / electrical / plumbing capex.
- Climate carrying-cost: extreme-heat days projected 7→21/yr by 2055 (HVAC capex compounding) — expect insurance premiums to compound above CPI over the hold.
Questions for the listing agent
- It's been on market 104 days. Have you received any prior offers? Is the seller open to a 9% concession, seller financing, or rate buy-down credit?
- Built in 1917 — when were the roof, HVAC, electrical panel, plumbing, and water heater last replaced?
- Why hasn't it sold? Are there any deal-killer items the seller is aware of (foundation, flood, title, zoning, code violations)?
- Is there a deadline driving the sale (1031 exchange, divorce, estate, relocation)? That informs how much negotiation room exists.
- Schools are B-rated — typically a magnet for longer-tenancy family renters. What's the average tenant stay here, and is there a school-zone premium baked into asking?
- What's the average days-on-market for RENTAL listings here right now (not sales)? A rising rental-DOM trend means longer vacancies and softer asking-rent achievability than the comps imply.
- What's the recent tenant-quality profile in this submarket — average credit score on applications, eviction rate, late-payment / NSF rate, and stable-employment percentage? A property-management company in the area should have these aggregated.
- How much new for-sale + rental construction is in the pipeline within 1–3 miles? Heavy new supply typically softens prices + rents 12–24 months out; constrained supply supports both.
Investment metrics
- 1% rule
- 1.32% ✓
- Cap rate
- 10.80%
- Cash-on-cash
- 16.09%
- DSCR
- 1.72
- GRM
- 6.3
CMA / ARV
- ARV (median comp)
- $155,380
- List price
- $129,900
- Delta
- -16.40%
- Verdict
- UNDERPRICED
- Comps
- 20 within 1.0 mi
Show comp detail 12 sales within ~0.75 mi
| Address | Dist | Beds/Ba | Sqft | Sold | Price | $/sf | Match |
|---|---|---|---|---|---|---|---|
| 6934 Julian Ave | 0.25mi | 2/1.0 (-1) | 1,158 (-1%) | 1mo | $130,000 | $112 | 81 |
| 7039 Plymouth Ave | 0.37mi | 4/1.5 (+1) | 1,152 (-2%) | 1mo | $126,500 | $110 | 72 |
| 7048 Arcadia Ave | 0.37mi | 3/1.0 | 1,232 (+5%) | 3mo | $219,000 | $178 | 71 |
| 7033 Camden Ct | 0.60mi | 3/1.0 | 1,151 (-2%) | 2mo | $164,900 | $143 | 67 |
| 6736 Julian Ave | 0.24mi | 3/2.0 | 1,055 (-10%) | 3mo | $139,900 | $133 | 66 |
| 6534 Whitney Ave | 0.48mi | 2/1.0 (-1) | 1,126 (-4%) | 0mo | $65,000 | $58 | 66 |
| 7155 Willow Tree Ln | 0.71mi | 3/1.5 | 1,200 (+3%) | 3mo | $210,000 | $175 | 58 |
| 6821 Primrose Ave | 0.41mi | 3/1.0 | 1,344 (+15%) | 2mo | $48,500 | $36 | 55 |
| 7034 Plymouth Ave | 0.35mi | 2/1.0 (-1) | 1,025 (-12%) | 6mo | $160,000 | $156 | 53 |
| 6959 Dartmouth Ave | 0.41mi | 3/2.0 | 1,331 (+14%) | 2mo | $294,000 | $221 | 52 |
| 1239 Meyer St | 0.64mi | 2/1.0 (-1) | 1,296 (+11%) | 1mo | $138,900 | $107 | 46 |
| 6996 Robbins Ave | 0.71mi | 3/1.0 | 1,344 (+15%) | 6mo | $180,000 | $134 | 38 |
Match score weights: distance 35% · size 25% · config 20% · recency 20%. Top-matched comps best support the ARV.
Projected returns pro-forma
-3.0% appreciation · 3.61% rent growth · sell at horizon
- IRR
- 7.7%
- Equity multiple
- 1.30×
- Total profit
- $11,079
- Equity at exit
- $19,369
- IRR
- 17.5%
- Equity multiple
- 2.49×
- Total profit
- $54,056
- Equity at exit
- $11,231
Cash invested: $36,372 (down + closing). Projections, not guarantees.
Landlord ↔ Tenant lean methodology
- Overall (STATE)
- 81 Strongly Landlord-Friendly
- State Missouri
- 81 Strongly Landlord-Friendly · R+10
- County
- — inherits STATE
- City
- — inherits STATE
ZIP-level market 63130
- Rents YoY
- 3.6%
- Active inventory
- 162
- Price-to-rent
- 6.3×
Monthly cashflow live
- Estimated rent
- $1,709 high interval (Pro) →
- Mortgage (P&I)
- −$681
- Tax from tax record
- −$127 /mo · $1,527/yr
- Insurance
- −$54
- HOA
- −$0
- Vacancy / Maint / Mgmt
- −$359
- Net cashflow
- $488
Break-even live
UW: 25.0% down · 7.5% · 30yr · 1.5% tax · 5.0% vac · 8.0% maint · 8.0% mgmt
Financing live
Cash to close
- Down payment
- $32,475
- Closing costs
- $3,897
- Reserves months
- —
- Total cash needed
- —
Loan-product check · same deal, 3 products live
Conventional
25% down · 7.5% · 30yr
- Down + closing
- —
- Monthly P&I
- —
- Monthly cashflow
- —
- DSCR
- —
- Eligible?
- —
Personal DTI + credit; lowest rate.
DSCR
20% down · 8.5% · 30yr
- Down + closing
- —
- Monthly P&I
- —
- Monthly cashflow
- —
- DSCR
- —
- Eligible?
- —
No personal income docs; deal must DSCR.
Hard money
10% down · 12.0% · 12mo
- Down + closing
- —
- Monthly P&I
- —
- Monthly cashflow
- —
- DSCR
- —
- Eligible?
- —
Short-term bridge; refi at stabilization.
Rent comps 40 comps
| Address | Beds | Baths | Sqft | Rent | $/sqft | DOM | Units | Dist |
|---|---|---|---|---|---|---|---|---|
| 6913 Etzel Ave Unit 1496954P University City, MO | 3.0 | 2.0 | 1399 | $5,767 | $4.12 | 7d | 1 | 0.16mi |
| 6827 Melrose Ave Saint Louis, MO | 2.0 | 1.0 | 1200 | $1,300 | $1.08 | 7d | 1 | 0.22mi |
| 6704 Etzel Ave Saint Louis, MO | 2.0 | 1.0 | 825 | $1,325 | $1.61 | 44d | 1 | 0.23mi |
| 6636 Etzel Ave Saint Louis, MO | 3.0 | 1.5 | 1019 | $1,350 | $1.32 | 7d | 1 | 0.27mi |
| 6636 Etzel Ave Saint Louis, MO | 3.0 | 2.0 | 1019 | $1,350 | $1.32 | 20d | 1 | 0.27mi |
| 6936 Melrose Ave Saint Louis, MO | 4.0 | 2.0 | 1396 | $1,858 | $1.33 | 23d | 1 | 0.27mi |
| 7034 Corbitt Ave Saint Louis, MO | 2.0 | 2.0 | 870 | $1,450 | $1.67 | 23d | 1 | 0.34mi |
| 6543 Etzel Ave Saint Louis, MO | 3.0 | 1.0 | 967 | $1,600 | $1.65 | 18d | 1 | 0.36mi |
| 6614 Chamberlain Ave Saint Louis, MO | 3.0 | 2.0 | 1000 | $1,820 | $1.82 | 23d | 1 | 0.45mi |
| 7055 Dartmouth Ave Unit 1 University City, MO | 2.0 | 1.0 | 1320 | $2,100 | $1.59 | 44d | 1 | 0.54mi |
| 7055 Dartmouth Ave Unit 2 University City, MO | 2.0 | 1.0 | 1320 | $2,100 | $1.59 | 44d | 1 | 0.54mi |
| 7125 Dartmouth Ave Saint Louis, MO | 2.0 | 1.0 | 1242 | $1,550 | $1.25 | 44d | 1 | 0.59mi |
| 7120 Dartmouth Ave Unit A University City, MO | 2.0 | 1.0 | 1200 | $1,345 | $1.12 | 3d | 1 | 0.60mi |
| 7104 Tulane Ave Saint Louis, MO | 2.0 | 1.0 | 1400 | $1,745 | $1.25 | 44d | 1 | 0.61mi |
| 7104 Tulane Ave Unit 1 University City, MO | 2.0 | 1.0 | 1200 | $1,900 | $1.58 | 23d | 1 | 0.61mi |
| 1115 Backer St Saint Louis, MO | 3.0 | 1.0 | 984 | $1,495 | $1.52 | 23d | 1 | 0.63mi |
| 7156 Tulane Ave Unit 56A University City, MO | 2.0 | 1.0 | 1000 | $1,295 | $1.29 | 22d | 1 | 0.70mi |
| 6318 Cabanne Ave Apt 1w University City, MO | 2.0 | 1.0 | 950 | $1,250 | $1.32 | 4d | 1 | 0.70mi |
| 7204 Tulane Ave Unit 7204-B Tulane University City, MO | 2.0 | 1.0 | 1100 | $1,100 | $1.00 | 44d | 1 | 0.72mi |
| 6312 Cates Ave Unit 2E University City, MO | 2.0 | 1.0 | 900 | $1,300 | $1.44 | 44d | 1 | 0.77mi |
| 7254 Tulane Ave #1 University City, MO | 2.0 | 1.0 | 1144 | $1,600 | $1.40 | 18d | 1 | 0.81mi |
| 716 Westgate Ave Unit 3 University City, MO | 3.0 | 2.0 | 1500 | $2,995 | $2.00 | 44d | 1 | 0.81mi |
| 908 Eastgate Ave Unit 2N University City, MO | 2.0 | 1.0 | 900 | $1,300 | $1.44 | 4d | 1 | 0.82mi |
| 900 Eastgate Ave Saint Louis, MO | 2.0 | 1.0 | 900 | $1,095 | $1.22 | 44d | 1 | 0.83mi |
| 6274 Cates Ave Saint Louis, MO | 3.0 | 2.0 | 1400 | $2,295 | $1.64 | 44d | 1 | 0.84mi |
| 6650 Delmar Blvd Saint Louis, MO | 3.0 | 1.0–3.0 | 760 | $2,095 | $2.76 | 2d | 1 | 0.85mi |
| 6409 Enright Ave University City, MO | 3.0 | 1.5 | 1320 | $2,420 | $1.83 | 2d | 2 | 0.86mi |
| 6261 Clemens Ave Saint Louis, MO | 3.0 | 1.0 | 1200 | $1,700 | $1.42 | 44d | 1 | 0.86mi |
| 603 Westgate Ave University City, MO | 2.0 | 2.5 | 1290 | $1,750 | $1.36 | 44d | 1 | 0.89mi |
| 1019 N Skinker Pkwy St. Louis, MO | 1.0–3.0 | 1.0–3.0 | 1137 | $2,795 | $2.46 | 2d | 9 | 0.93mi |
| 7350 Amherst Ave Unit 1E University City, MO | 2.0 | 1.0 | 1100 | $1,795 | $1.63 | 18d | 1 | 0.96mi |
| 7261 Delmar Blvd University City, MO | 3.0 | 1.0 | 1416 | $1,950 | $1.38 | 2d | 1 | 0.96mi |
| 1131 Hodiamont Ave Unit 1135-2D St. Louis, MO | 3.0 | 1.0 | 840 | $1,225 | $1.46 | 44d | 1 | 0.98mi |
| 1131 Hodiamont Ave St. Louis, MO | 2.0 | 1.0 | 700 | $1,050 | $1.50 | 44d | 1 | 0.98mi |
| 7361 Melrose Ave Saint Louis, MO | 3.0 | 2.0 | 1278 | $2,095 | $1.64 | 44d | 1 | 1.00mi |
| 1535 N Jackson Ave Saint Louis, MO | 2.0 | 1.0 | 988 | $1,450 | $1.47 | 44d | 1 | 1.04mi |
| 6043 Clemens Ave Apt 2E St. Louis, MO | 2.0 | 1.0 | 1023 | $1,075 | $1.05 | 23d | 1 | 1.15mi |
| 6105 Delmar Blvd Saint Louis, MO | 1.0–3.0 | 1.0–3.0 | 931 | $2,610 | $2.80 | 4d | 1 | 1.17mi |
| 5989 Julian Ave Unit 37 St. Louis, MO | 2.0 | 1.0 | 780 | $1,200 | $1.54 | 18d | 1 | 1.18mi |
| 7430 Canton Ave Saint Louis, MO | 3.0 | 1.0 | 1075 | $1,450 | $1.35 | 23d | 1 | 1.19mi |
Listing history 30 events
-
2026-06-18days on market $129,900 Active 104 DOM
-
2026-06-17days on market $129,900 Active 103 DOM
-
2026-06-16days on market $129,900 Active 102 DOM
-
2026-06-15days on market $129,900 Active 101 DOM
-
2026-06-13days on market $129,900 Active 99 DOM
-
2026-06-13days on market $129,900 Active 98 DOM
-
2026-06-09days on market $129,900 Active 95 DOM
-
2026-06-08days on market $129,900 Active 94 DOM
-
2026-06-07days on market $129,900 Active 93 DOM
-
2026-06-05days on market $129,900 Active 90 DOM
-
2026-06-03days on market $129,900 Active 89 DOM
-
2026-06-02days on market $129,900 Active 88 DOM
-
2026-06-01days on market $129,900 Active 87 DOM
-
2026-05-31days on market $129,900 Active 86 DOM
-
2026-05-15price $139,900 1085-char remark
Show marketing remark (1085 chars)
Welcome home to this charming one-story single-family residence in St. Louis featuring inviting curb appeal and a covered front entry. Inside, you'll find neutral colors and abundant natural light that create a warm and welcoming atmosphere throughout. The home offers a comfortable blend of tile, hardwood, and carpet flooring, adding both style and functionality. The spacious living room flows into the formal dining area, creating a great space for gatherings and everyday living. The dining room also features a beautiful built-in buffet—perfect for displaying special occasion china or treasured keepsakes. The updated kitchen is a standout, showcasing gorgeous granite countertops, a stylish tile backsplash, and modern appliances including a gas stove, dishwasher, and refrigerator. With 3 bedrooms and 1 bathroom, this home provides comfortable living space along with a full basement that includes laundry hookups and plenty of room for storage or future possibilities. This home blends classic charm with thoughtful updates—ready for you to move in and enjoy!
-
2026-03-06$144,900 Active 1085-char remark
Show marketing remark (1085 chars)
Welcome home to this charming one-story single-family residence in St. Louis featuring inviting curb appeal and a covered front entry. Inside, you'll find neutral colors and abundant natural light that create a warm and welcoming atmosphere throughout. The home offers a comfortable blend of tile, hardwood, and carpet flooring, adding both style and functionality. The spacious living room flows into the formal dining area, creating a great space for gatherings and everyday living. The dining room also features a beautiful built-in buffet—perfect for displaying special occasion china or treasured keepsakes. The updated kitchen is a standout, showcasing gorgeous granite countertops, a stylish tile backsplash, and modern appliances including a gas stove, dishwasher, and refrigerator. With 3 bedrooms and 1 bathroom, this home provides comfortable living space along with a full basement that includes laundry hookups and plenty of room for storage or future possibilities. This home blends classic charm with thoughtful updates—ready for you to move in and enjoy!
-
2020-04-23soldstatus $78,000
-
2020-04-02soldstatus Closed 267-char remark
Show marketing remark (267 chars)
Bright and spacious three bedroom 1 bath home in University City. New roof and upgraded kitchen renovation with granite with new appliances. Main floor bath upgraded with new shower and fixtures. Large flat yard and 2 car detached garage. Washer & dryer stay!
-
2020-03-20status Pending 267-char remark
Show marketing remark (267 chars)
Bright and spacious three bedroom 1 bath home in University City. New roof and upgraded kitchen renovation with granite with new appliances. Main floor bath upgraded with new shower and fixtures. Large flat yard and 2 car detached garage. Washer & dryer stay!
-
2020-03-11$99,000 Active 267-char remark
Show marketing remark (267 chars)
Bright and spacious three bedroom 1 bath home in University City. New roof and upgraded kitchen renovation with granite with new appliances. Main floor bath upgraded with new shower and fixtures. Large flat yard and 2 car detached garage. Washer & dryer stay!
-
2019-12-12price $79,000
-
2019-11-01price $85,000
-
2018-12-18price $75,000
-
2018-11-28price $79,900
-
2018-11-07price $84,900
-
2018-10-24price $89,900
-
2018-06-14soldstatus $41,000
-
2003-06-17soldstatus $76,900
-
2001-10-04soldstatus $57,000
-
1992-09-28soldstatus
ⓘ Source: listings_history table (triggers on properties + properties_extension) + one-shot
backfill from property_details.listing_events for pre-trigger history.
Tax reassessment forecast MO · Resets to sale price
- Current annual tax
- $1,527 · $127/mo
- Projected year-2 tax
- $1,527 · $127/mo
- Expected delta
- $0/yr ($0/mo · 0.0%)
ⓘ Screening estimate from a state-policy table — verify with the county assessor before closing.
Climate risk First Street
- Flood 1/10 Low FEMA zone X (unshaded) · 0% chance over 30 yrs
- Wildfire 1/10 Low
- Heat 5/10 Major 7 d/yr ≥107°F today · 21 d/yr by 30 yrs out
- Wind 2/10 Low 100% chance of damaging wind over 30 yrs
- Air quality 4/10 Moderate 4 unhealthy d/yr today · 5 by 30 yrs out
Nearby sold comps map
Loading sold comps map…
Walkable amenities ~0.75 mi
Loading nearby amenities…
Taxation est. · year 1
- Rental income
- $20,513
- − Mortgage interest
- −$7,276
- − Property taxes
- −$1,527
- − Insurance
- −$650
- − Repairs & maintenance
- −$1,641
- − Management
- −$1,641
- − Depreciation
- −$3,779
- Taxable income
- $3,999
- Est. tax owed @ 24.0%
- −$960
- After-tax cash flow
- $4,894/yr
For passive investors: Depreciation is non-cash, so a rental often shows a tax loss while cash-flowing — sheltering income. Rental losses are passive: they offset passive income freely, and up to $25,000/yr can offset ordinary (W-2) income if you actively participate and your MAGI is under $100k (phasing out to $0 by $150k); unused losses carry forward. On sale, claimed depreciation is recaptured at up to 25%, and gains may owe capital-gains tax (a 1031 exchange can defer both). Figures are a year-1 estimate at your 24.0% rate — not tax advice; consult a CPA.
Schools (NCES district)
- District
- University City
- NCES district ID
- 2930660
- Math proficiency
- 15% ▼ -10.00%
- Reading proficiency
- 26% ▼ -7.00%
- Median HH income
- $52,927
- Composite
- 18.57/100
- National rank
- #8910
- State rank
- #297 of 324 in MO
Livability — University City
- Score
- 73/100
- State rank
- #84
- US rank
- #5618
Category grades
Schools grade is shown separately in the Schools card above.
Census & demographics
- Census place
- University City, MO
- County
- Saint Louis County · 888,823 people
- City population
- 28,910
- Metro
- St. Louis, MO-IL
- Population (ZIP)
- 28,910
- Household income
- $85,823
- Rent vs Own
- Severe rent burden
- 893.0
Population outlook (St. Louis County) Hauer SSP2
- Today (2025)
- 1,025,227 people
- By 2030
- 1,028,023 · +0.3%
- By 2040
- 1,020,940 · -0.4%
- By 2050
- 1,007,280 · -1.8%
- By 2075
- 987,277 · -3.7%
- By 2100
- 921,984 · -10.1%
Race, ethnicity, and origin ACS 2023
- Neighborhood character
- Diverse neighborhood (Simpson 0.61)
- Race & ethnicity
- White 54% Black 31% Asian 6% Two or more races 6% Hispanic / Latino 4%
- Common ancestry
- Italian 3% Romanian 3% Lithuanian 2%
- Foreign-born
- 11% · China, Canada, Vietnam
- Languages at home
- 89% English-only · Chinese 4% Spanish 2% French/Haitian/Cajun 1%
Political lean MEDSL · St. Louis
- 2024 margin
- Strong D (+23.4) · D 60.8% · R 37.4% · Other 1.7%
- 2008→2024 swing
- +3.5pp toward D · 2008: 19.9pp · 2024: 23.4pp
- All cycles
- 2024: D+23.4 2020: D+24.0 2016: D+16.2 2012: D+13.7 2008: D+19.9
Not yet ingested
- Civics
- —
Market trends
- HPI YoY
- ▼ -436.88%
- Current HPI
- 185.599
- Rent YoY
- ▲ 3.61%
- Metro
- St. Louis, MO-IL
- State GDP YoY
- ▲ 1.84%
- F500 in state
- 20
Industry mix (Fortune 500 HQ in MO)
| Industry | F500 HQs | Revenue |
|---|---|---|
| Healthcare | 1 | $163B |
|
||
| Insurance | 1 | $21B |
|
||
| Industrial Technology | 1 | $17B |
|
||
| Retail | 1 | $16B |
|
||
| Industrial Distribution | 1 | $10B |
|
||
| Utilities | 1 | $9B |
|
||
Price history
+145.4% since first listed16 events — show timeline
- 2026-05-15 Price Changed $139,900 MARIS as Distributed by MLS Grid
- 2026-03-06 Listed $144,900 MARIS as Distributed by MLS Grid
- 2020-04-23 Sold (Public Records) $78,000 Public Records
- 2020-04-02 Sold (MLS) — MARIS as Distributed by MLS Grid
- 2020-03-20 Pending — MARIS as Distributed by MLS Grid
- 2020-03-11 Listed $99,000 MARIS as Distributed by MLS Grid
- 2019-12-12 Price Changed $79,000 MARIS as Distributed by MLS Grid
- 2019-11-01 Price Changed $85,000 MARIS as Distributed by MLS Grid
- 2018-12-18 Price Changed $75,000 MARIS as Distributed by MLS Grid
- 2018-11-28 Price Changed $79,900 MARIS as Distributed by MLS Grid
- 2018-11-07 Price Changed $84,900 MARIS as Distributed by MLS Grid
- 2018-10-24 Price Changed $89,900 MARIS as Distributed by MLS Grid
- 2018-06-14 Sold (Public Records) $41,000 Public Records
- 2003-06-17 Sold (Public Records) $76,900 Public Records
- 2001-10-04 Sold (Public Records) $57,000 Public Records
- 1992-09-28 Sold (Public Records) — Public Records
Property tax history
+4.7%/yrLatest (2022): $1,527 · +1.0% YoY. Source: county tax records.
Cash-flow waterfall
monthlySold comps — $/sqft
last 12 mo · ≤1 miLoading sold comps…