4509 NE 44th Ter · Kansas City, MO
Flood risk 1/10 · Minimal
- FEMA flood zone
- X (unshaded)
- Chance of flooding over 30 yrs
- 0.0%
- Est. flood insurance / yr
- $473 – $860
Fire risk 1/10 · Minimal
- Est. fire insurance / yr
- $1,054 – $1,958
Heat risk 4/10 · Minor
- Hot days now (above 108°F)
- 7 days/yr
- Hot days in 30 yrs
- 17 days/yr
Wind risk 2/10 · Minimal
- Chance of severe wind over 30 yrs
- —
Air-quality risk 3/10 · Minor
- Unhealthy air days now
- 2 days/yr
- Unhealthy air days in 30 yrs
- 3 days/yr
Risk factors via First Street. Map © Google.
Why this score? — see what drove the C grade
The composite is a weighted blend of 9 inputs, each scored 0–100. Each bar is that input's sub-score; the figure is the points it added to the 100-point composite (weight × sub-score).
- Cash flow +19.4/30.0
- ARV discount +15.0/15.0
- DSCR +6.1/10.0
- 1% rule +4.8/10.0
- Livability +3.9/5.0
- Schools +3.8/10.0
- Rent growth +2.6/5.0
- Condition / age +2.5/5.0
- Appreciation +0.0/10.0
$144,900
🖨 Deal sheet (PDF) 📄 Offer letter ✓ Due diligence
Listing remarks
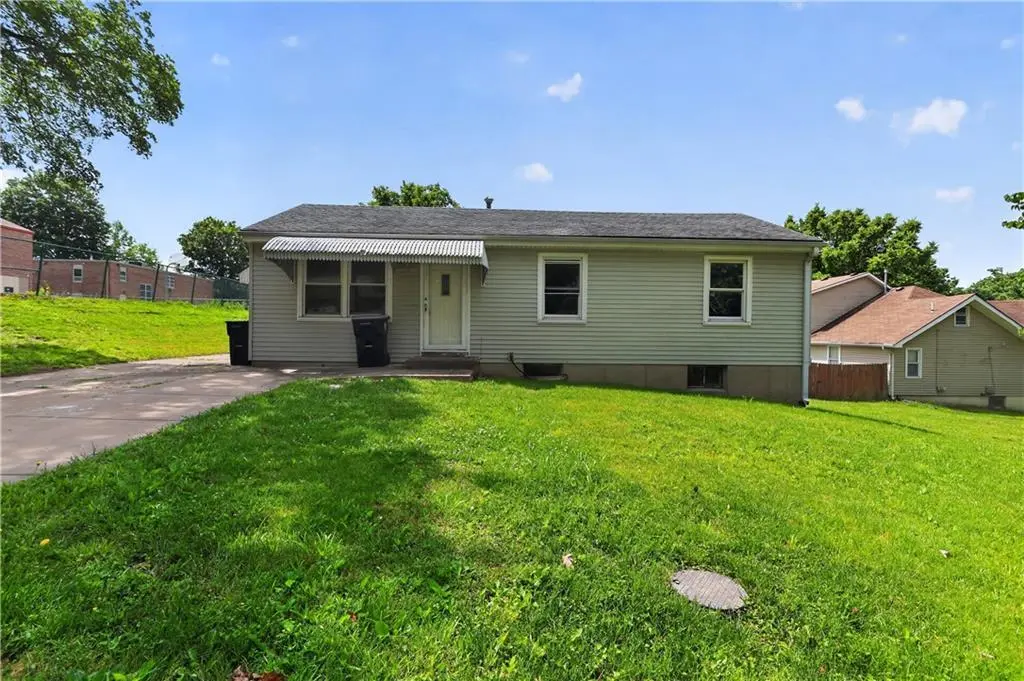
Charming ranch-style home located in the established neighborhood of Kansas City! This 3-bedroom home offers a functional layout, and a full basement with additional storage or recreation potential. This home is being sold AS-IS
Key facts
- Ranch-style home
- Full basement
- 0.26 acre lot
Tags
Property features AI
Finance
- Other: Living area reported as 876; Property age approximately 51–75 years
- HOA & community: No association fees; No community maintenance provided
Exterior
- Parking: Attached parking
- Utilities: Public water; Public sewer
- Home design: Single-family residence; Ranch style; One story
- Construction: Frame construction with vinyl siding; Composition roof
- Exterior features: Yard on a 11,326 sq ft lot; Not in a flood plain
Interior
- Kitchen: Kitchen on main level
- Bedrooms: 3 bedrooms (all on the main level)
- Flooring: Carpet
- Bathrooms: 1 full bathroom
- Heating & cooling: Forced air heating (natural gas); Electric cooling
- Interior features: Ranch floor plan; Concrete, unfinished basement
Neighborhood map
What this means for you Summary
Snapshot
- This is a 3-bed/1.0-bath single-family listed at $145k.
Deal economics
- At list price, monthly cash flow is $161 ($2k/yr) — positive.
- The deal already cash-flows at list — no discount required.
- To meet the 1% rule (rent ≥ 1% of price), the offer needs to be $142k (2.3% below list).
- Recommended offer: $142k (2.3% below list) — sets the bar for 1% rule.
- Cap rate 7.6% vs local median 3.9% in Kansas City — top-decile yield for the area; either an underpriced asset or a hidden risk that comps aren't pricing in. Stress-test before assuming the spread holds.
Location & tenants
- Location reads 78/100 on livability (#28 in MO, #2,671 nationally) — a middle-class / working-renter tenant base. Strengths: amenities A+, commute A+, cost of living A+; Watch: crime F.
- North Kansas City 74 (urban): math 38% / reading 49% proficiency, ranked #98 of 324 in MO (top 30%) — families likely to look elsewhere, expect single-tenant / working-renter base with shorter leases.
- Zoned schools: Topping Elementary (math 22% / reading 32%, grade F, #850 of 1,115 statewide, top 78%, 318 students, 70% FRL); Winnetonka High (math 16% / reading 51%, grade F, #349 of 521 statewide, top 67%, 1,284 students, 60% FRL) — zoned schools average 65% FRL vs 37% district-wide (27 pts higher); higher-poverty schools than district average — tighter screening recommended.
- Zoned-school proficiency averages 30% at this address vs 44% district-wide (-13 pts) — the specific schools serving this property underperform the North Kansas City 74 average; the district grade overstates school quality for this exact location.
- Market conditions: Rents flat; 50 active listings in the ZIP; 9 comparable units currently listed for rent nearby; rentals at typical pace (median 24d on market — plan ~3-4 weeks tenant-placement turnaround); 341 units permitted in Clay County in 2024 (40 in 5+ unit buildings).
Forward outlook
- Local home prices are declining (-3.0%/yr); year-one equity from $1k of loan paydown is wiped out by about $4k of value loss. Plan a longer hold.
- Clay County population projected at +24% by 2050 — long-run rental-demand tailwind backs the buy-and-hold thesis.
Negotiation context
- Only 10 days on market — expect competitive offers; lowballing is unlikely to land.
Questions for the listing agent
- Built in 1961 — when were the roof, HVAC, electrical panel, plumbing, and water heater last replaced?
- Is there a deadline driving the sale (1031 exchange, divorce, estate, relocation)? That informs how much negotiation room exists.
- Crime grade is F in this area — have there been break-ins, vandalism, or insurance claims at this property in the last 3 years? What carrier currently insures it and at what premium?
- What's the average days-on-market for RENTAL listings here right now (not sales)? A rising rental-DOM trend means longer vacancies and softer asking-rent achievability than the comps imply.
- What's the recent tenant-quality profile in this submarket — average credit score on applications, eviction rate, late-payment / NSF rate, and stable-employment percentage? A property-management company in the area should have these aggregated.
- How much new for-sale + rental construction is in the pipeline within 1–3 miles? Heavy new supply typically softens prices + rents 12–24 months out; constrained supply supports both.
Investment metrics
- 1% rule
- 0.98% ✗
- Cap rate
- 7.63%
- Cash-on-cash
- 4.77%
- DSCR
- 1.21
- GRM
- 8.5
CMA / ARV
- ARV (on-the-fly)
- $191,844
- Comps found
- 12
Show comp detail 12 sales within ~0.75 mi
| Address | Dist | Beds/Ba | Sqft | Sold | Price | $/sf | Match |
|---|---|---|---|---|---|---|---|
| 4437 N Jackson Ave | 0.19mi | 3/1.0 | 925 (+6%) | 1mo | $169,900 | $184 | 81 |
| 4412 N Jackson Ave | 0.21mi | 3/1.0 | 831 (-5%) | 0mo | $170,000 | $205 | 81 |
| 4420 N Jackson Ave | 0.21mi | 2/1.0 (-1) | 912 (+4%) | 2mo | $164,950 | $181 | 77 |
| 4712 NE 46th Ter | 0.32mi | 2/1.0 (-1) | 864 (-1%) | 5mo | $165,000 | $191 | 74 |
| 5008 NE 46th St | 0.39mi | 3/2.0 | 912 (+4%) | 3mo | $150,000 | $164 | 68 |
| 4357 N Drury Ave | 0.60mi | 3/1.0 | 864 (-1%) | 3mo | $210,000 | $243 | 67 |
| 4609 NE 43rd Ter | 0.21mi | 3/2.0 | 976 (+11%) | 5mo | $223,800 | $229 | 63 |
| 5111 NE 44th Ter | 0.41mi | 3/2.0 | 960 (+10%) | 4mo | $230,000 | $240 | 58 |
| 5301 NE 42nd Ter | 0.54mi | 3/2.0 | 936 (+7%) | 2mo | $216,000 | $231 | 58 |
| 4418 NE 49th St | 0.66mi | 3/1.0 | 936 (+7%) | 3mo | $205,000 | $219 | 55 |
| 5012 NE 42nd St | 0.48mi | 3/2.0 | 960 (+10%) | 3mo | $220,000 | $229 | 55 |
| 5115 NE 46th St | 0.44mi | 2/1.5 (-1) | 996 (+14%) | 1mo | $185,000 | $186 | 49 |
Match score weights: distance 35% · size 25% · config 20% · recency 20%. Top-matched comps best support the ARV.
Projected returns pro-forma
-3.0% appreciation · 0.49% rent growth · sell at horizon
- IRR
- -11.6%
- Equity multiple
- 0.59×
- Total profit
- $-16,696
- Equity at exit
- $21,605
- IRR
- -6.4%
- Equity multiple
- 0.63×
- Total profit
- $-14,939
- Equity at exit
- $12,528
Cash invested: $40,572 (down + closing). Projections, not guarantees.
Landlord ↔ Tenant lean methodology
- Overall (STATE)
- 81 Strongly Landlord-Friendly
- State Missouri
- 81 Strongly Landlord-Friendly · R+10
- County
- — inherits STATE
- City
- — inherits STATE
ZIP-level market 64117
- Rents YoY
- 0.5%
- Active inventory
- 50
- Price-to-rent
- 8.5×
Monthly cashflow live
- Estimated rent
- $1,416 high interval (Pro) →
- Mortgage (P&I)
- −$760
- Tax from tax record
- −$137 /mo · $1,640/yr
- Insurance
- −$60
- HOA
- −$0
- Vacancy / Maint / Mgmt
- −$297
- Net cashflow
- $161
Break-even live
Sensitivity live
| Price | -10% $243 | -5% $202 | +0% $161 | +5% $120 | +10% $79 |
|---|---|---|---|---|---|
| Rent | -10% $50 | -5% $105 | +0% $161 | +5% $217 | +10% $273 |
| Rate | -1.0pp $234 | -0.5pp $198 | base $161 | +0.5pp $124 | +1.0pp $86 |
UW: 25.0% down · 7.5% · 30yr · 1.5% tax · 5.0% vac · 8.0% maint · 8.0% mgmt
Financing live
Cash to close
- Down payment
- $36,225
- Closing costs
- $4,347
- Reserves months
- —
- Total cash needed
- —
Loan-product check · same deal, 3 products live
Conventional
25% down · 7.5% · 30yr
- Down + closing
- —
- Monthly P&I
- —
- Monthly cashflow
- —
- DSCR
- —
- Eligible?
- —
Personal DTI + credit; lowest rate.
DSCR
20% down · 8.5% · 30yr
- Down + closing
- —
- Monthly P&I
- —
- Monthly cashflow
- —
- DSCR
- —
- Eligible?
- —
No personal income docs; deal must DSCR.
Hard money
10% down · 12.0% · 12mo
- Down + closing
- —
- Monthly P&I
- —
- Monthly cashflow
- —
- DSCR
- —
- Eligible?
- —
Short-term bridge; refi at stabilization.
Rent comps 9 comps
| Address | Beds | Baths | Sqft | Rent | $/sqft | DOM | Units | Dist |
|---|---|---|---|---|---|---|---|---|
| 4431 NE Winn Rd Kansas City, MO | 2.0 | 1.0 | 600 | $1,000 | $1.67 | 24d | 1 | 0.24mi |
| 4515 NE 46th Ter Kansas City, MO | 3.0 | 1.0 | 1047 | $1,585 | $1.51 | 24d | 1 | 0.27mi |
| 4623 NE Winn Rd Kansas City, MO | 2.0 | 1.0–2.0 | 852 | $1,185 | $1.39 | 3d | 18 | 0.40mi |
| 4140 N Walrond Ave Unit 1-40010 Kansas City, MO | 2.0 | 1.0 | 732 | $1,000 | $1.37 | 21d | 1 | 0.85mi |
| 3622 N Chouteau Trfy Kansas City, MO | 2.0 | 2.0 | 1000 | $1,125 | $1.12 | 44d | 1 | 0.98mi |
| 3735 N Walrond Ave Kansas City, MO | 3.0 | 1.5 | 936 | $1,175 | $1.26 | 20d | 1 | 1.15mi |
| 5042 N Bellaire Ave Kansas City, MO | 2.0 | 1.0 | 900 | $1,391 | $1.55 | 24d | 1 | 1.18mi |
| 3501 N Drury Ave Kansas City, MO | 2.0 | 1.0 | 890 | $1,295 | $1.46 | 22d | 1 | 1.21mi |
| 5322 N Bales Ave Kansas City, MO | 3.0 | 1.0 | 912 | $1,495 | $1.64 | 24d | 1 | 1.31mi |
Listing history 8 events
-
2026-06-09status $144,900 Pending 10 DOM
-
2026-06-08days on market $144,900 Active 10 DOM
-
2026-06-07days on market $144,900 Active 9 DOM
-
2026-06-05days on market $144,900 Active 6 DOM
-
2026-06-03days on market $144,900 Active 5 DOM
-
2026-06-02days on market $144,900 Active 4 DOM
-
2026-06-01days on market $144,900 Active 3 DOM
-
2026-05-31days on market $144,900 Active 2 DOM
ⓘ Source: listings_history table (triggers on properties + properties_extension) + one-shot
backfill from property_details.listing_events for pre-trigger history.
Tax reassessment forecast MO · Resets to sale price
- Current annual tax
- $1,640 · $137/mo
- Projected year-2 tax
- $1,640 · $137/mo
- Expected delta
- $0/yr ($0/mo · 0.0%)
ⓘ Screening estimate from a state-policy table — verify with the county assessor before closing.
Climate risk First Street
- Flood 1/10 Low FEMA zone X (unshaded) · 0% chance over 30 yrs
- Wildfire 1/10 Low
- Heat 4/10 Moderate 7 d/yr ≥108°F today · 17 d/yr by 30 yrs out
- Wind 2/10 Low
- Air quality 3/10 Moderate 2 unhealthy d/yr today · 3 by 30 yrs out
Nearby sold comps map
Loading sold comps map…
Walkable amenities ~0.75 mi
Loading nearby amenities…
Taxation est. · year 1
- Rental income
- $16,986
- − Mortgage interest
- −$8,117
- − Property taxes
- −$1,640
- − Insurance
- −$724
- − Repairs & maintenance
- −$1,359
- − Management
- −$1,359
- − Depreciation
- −$4,215
- Taxable loss
- −$428
- Est. tax savings @ 24.0%
- +$103
- After-tax cash flow
- $2,039/yr
For passive investors: Depreciation is non-cash, so a rental often shows a tax loss while cash-flowing — sheltering income. Rental losses are passive: they offset passive income freely, and up to $25,000/yr can offset ordinary (W-2) income if you actively participate and your MAGI is under $100k (phasing out to $0 by $150k); unused losses carry forward. On sale, claimed depreciation is recaptured at up to 25%, and gains may owe capital-gains tax (a 1031 exchange can defer both). Figures are a year-1 estimate at your 24.0% rate — not tax advice; consult a CPA.
Schools (NCES district)
- District
- North Kansas City 74
- NCES district ID
- 2922800
- Math proficiency
- 38% ▼ -11.00%
- Reading proficiency
- 49% ▼ -3.00%
- Median HH income
- $55,444
- Composite
- 37.88/100
- National rank
- #4321
- State rank
- #98 of 324 in MO
Livability — Kansas City
- Score
- 78/100
- State rank
- #28
- US rank
- #2671
Category grades
Schools grade is shown separately in the Schools card above.
Census & demographics
- Census place
- Kansas City, MO
- County
- Clay County · 220,651 people
- City population
- 439,467
- Metro
- Kansas City, MO-KS
- Population (ZIP)
- 14,919
- Household income
- $59,601
- Rent vs Own
- Severe rent burden
- 788.0
Population outlook (Clay County) Hauer SSP2
- Today (2025)
- 266,022 people
- By 2030
- 280,057 · +5.3%
- By 2040
- 306,153 · +15.1%
- By 2050
- 328,630 · +23.5%
- By 2075
- 375,182 · +41.0%
- By 2100
- 392,861 · +47.7%
Race, ethnicity, and origin ACS 2023
- Neighborhood character
- Diverse neighborhood (Simpson 0.56)
- Race & ethnicity
- White 63% Hispanic / Latino 15% Black 14% Two or more races 8% Asian 2%
- Hispanic origin (detail)
- Mexican 9%
- Common ancestry
- Arab 3% Lithuanian 2% Serbian 1%
- Foreign-born
- 13% · Canada
- Languages at home
- 84% English-only · Spanish 9% Other Indo-European 3% Arabic 2%
Political lean MEDSL · Clay
- 2024 margin
- Lean R (+5.6) · D 46.4% · R 52.0% · Other 1.6%
- 2008→2024 swing
- -4.9pp toward R · 2008: -0.7pp · 2024: -5.6pp
- All cycles
- 2024: R+5.6 2020: R+4.1 2016: R+11.1 2012: R+8.4 2008: R+0.7
Not yet ingested
- Civics
- —
Market trends
- HPI YoY
- ▼ -229.68%
- Current HPI
- 304.5632
- Rent YoY
- ▲ 0.49%
- Metro
- Kansas City, MO-KS
- State GDP YoY
- ▲ 1.84%
- F500 in state
- 20
Industry mix (Fortune 500 HQ in MO)
| Industry | F500 HQs | Revenue |
|---|---|---|
| Healthcare | 1 | $163B |
|
||
| Insurance | 1 | $21B |
|
||
| Industrial Technology | 1 | $17B |
|
||
| Retail | 1 | $16B |
|
||
| Industrial Distribution | 1 | $10B |
|
||
| Utilities | 1 | $9B |
|
||
Price history
+13.2% since first listed2 events — show timeline
- 2026-05-29 Listed $144,900 Heartland MLS as Distributed by MLS Grid
- 2022-08-17 Sold (Public Records) $128,000 Public Records
Property tax history
+3.1%/yrLatest (2025): $1,640 · +9.0% YoY. Source: county tax records.
Cash-flow waterfall
monthlySold comps — $/sqft
last 12 mo · ≤1 miLoading sold comps…