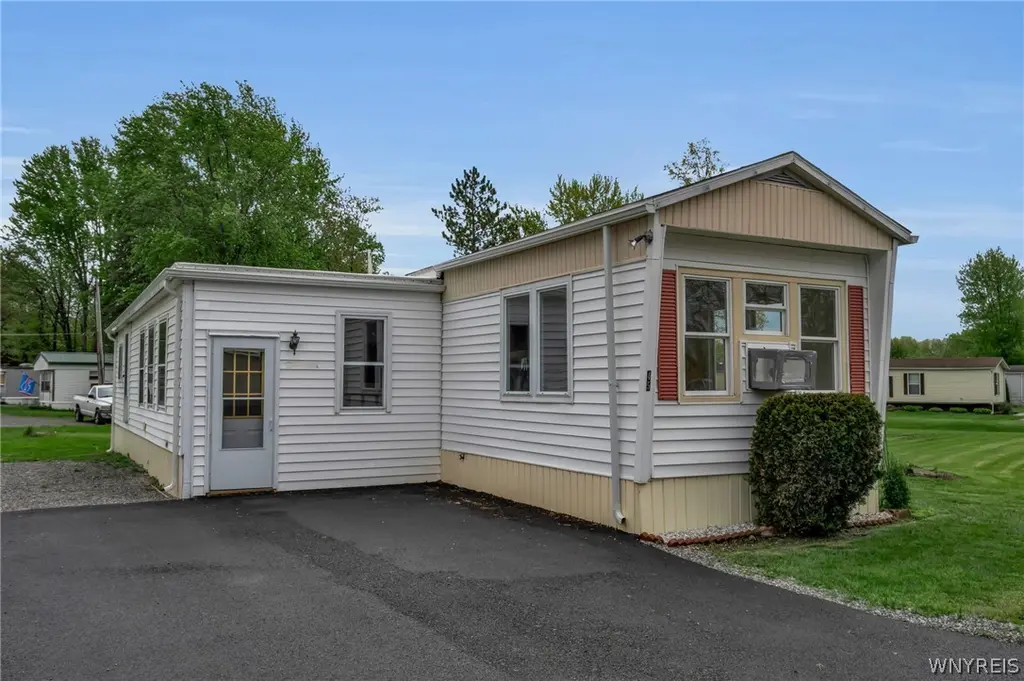
45 Nicole · Ransomville, NY
Flood risk 1/10 · Minimal
- FEMA flood zone
- X (unshaded)
- Chance of flooding over 30 yrs
- 0.0%
- Est. flood insurance / yr
- $507 – $1,088
Fire risk 3/10 · Minor
- Est. fire insurance / yr
- $691 – $1,283
Heat risk 2/10 · Minimal
- Hot days now (above 95°F)
- 7 days/yr
- Hot days in 30 yrs
- 14 days/yr
Wind risk 1/10 · Minimal
- Chance of severe wind over 30 yrs
- —
Air-quality risk 2/10 · Minimal
- Unhealthy air days now
- 1 days/yr
- Unhealthy air days in 30 yrs
- 2 days/yr
Risk factors via First Street. Map © Google.
Why this score? — see what drove the B grade
The composite is a weighted blend of 9 inputs, each scored 0–100. Each bar is that input's sub-score; the figure is the points it added to the 100-point composite (weight × sub-score).
- Cash flow +20.5/30.0
- ARV discount +15.0/15.0
- Appreciation +10.0/10.0
- DSCR +6.5/10.0
- 1% rule +5.4/10.0
- Schools +4.6/10.0
- Condition / age +3.8/5.0
- Livability +3.4/5.0
- Rent growth +2.5/5.0
$99,000
🖨 Deal sheet (PDF) 📄 Offer letter ✓ Due diligence
Listing remarks
Completely refreshed and move-in ready 3 bedroom, 1 bath home in Rainbow Park! This fully updated home offers stylish upgrades throughout. Including brand new vinyl flooring, new carpet, modern light fixtures, and windows - this is one you don't want to miss! Additional major updates include a newer roof and furnace. Situated on a spacious lot with room to enjoy the outdoors, this home combines comfort, affordability, and peace of mind.
Key facts
- New furnace
- Vinyl flooring
- New carpet
Tags
Property features AI
Finance
- Financial info: Land lease payment: $530
- HOA & community: Has land lease
Exterior
- Parking: No garage; Driveway parking
- Utilities: Electricity connected (circuit breakers); Public water connected; Sewer connected
- Home design: Single-wide mobile home; Single-story; Existing/resale property; Private road frontage
- Construction: Vinyl siding; Asphalt shingle roof; Built as existing structure
- Exterior features: Enclosed porch; Open porch; Blacktop driveway; Gravel driveway; Shed(s) and storage
Interior
- Kitchen: Gas range; Gas oven; Range hood; Exhaust fan; Refrigerator
- Bedrooms: 3 bedrooms on the main level
- Flooring: Carpet; Luxury vinyl; Varies
- Bathrooms: 1 full bathroom on the main level
- Heating & cooling: Propane heating; Forced air heating; Window and wall air conditioning units
- Interior features: Ceiling fans; Eat-in kitchen; Kitchen/family room combo; Solid surface counters; Bedroom on main level; Sunroom/Florida room
- Laundry & utility: Main level laundry; Washer; Propane water heater
Neighborhood map
What this means for you Summary
Snapshot
- This is a 3-bed/1.0-bath manufactured listed at $99k. Condition is rated good.
Deal economics
- At list price, monthly cash flow is $131 ($2k/yr) — positive.
- The deal already cash-flows at list — no discount required.
- Meets the 1% rule at list price ($1k rent vs $99k).
- Recommended offer: $96k (3.0% below list) — sets the bar for market timing.
- Cap rate 7.9% vs local median 2.6% in Ransomville — top-decile yield for the area; either an underpriced asset or a hidden risk that comps aren't pricing in. Stress-test before assuming the spread holds.
Location & tenants
- Location reads 68/100 on livability (#548 in NY) — a middle-class / working-renter tenant base. Strengths: employment A+, housing A+, crime A; Watch: amenities F, commute F, health & safety F.
- Wilson Central School District (town): math 52% / reading 55% proficiency, ranked #319 of 590 in NY (top 54%) — acceptable for families but not a draw, mixed tenant base, ~2y average lease.
- Zoned schools: Wilson Elementary School (math 57% / reading 57%, grade C+, #842 of 2,108 statewide, top 43%, 466 students, 46% FRL); Wilson Middle/High School (math 49% / reading 52%, grade D+, #972 of 1,100 statewide, top 88%, 514 students, 41% FRL) — zoned schools average 43% FRL vs 27% district-wide (16 pts higher); higher-poverty schools than district average — tighter screening recommended.
- Market conditions: 32 active listings in the ZIP; 167 units permitted in Niagara County in 2024 (0 in 5+ unit buildings).
Forward outlook
- In year one you build about $11k of equity ($684 loan paydown + $10k appreciation (10.0% local appreciation)).
- Niagara County population projected at -19% by 2050 — secular population decline; favor cash flow + early exit over multi-decade hold.
- At projected returns (10.0% appreciation + 3.0% rent growth), your $28k cash investment doubles in ~3 years — after that, you're playing with house money.
- By year 4, paydown + projected appreciation supports a ~$38k cash-out refi (75% LTV) — recoverable capital for the next deal without selling this one.
Negotiation context
- It's been on market 38 days — a 3% lower offer ($96k) is reasonable based on typical stale-listing flexibility.
Questions for the listing agent
- It's been on market 38 days. Have you received any prior offers? Is the seller open to a 3% concession, seller financing, or rate buy-down credit?
- Built in 1972 — when were the roof, HVAC, electrical panel, plumbing, and water heater last replaced?
- Is there a deadline driving the sale (1031 exchange, divorce, estate, relocation)? That informs how much negotiation room exists.
- Schools are F-rated, which usually means shorter tenancies and higher turnover. Who's the typical renter profile here, and what's been the actual vacancy rate?
- What's the average days-on-market for RENTAL listings here right now (not sales)? A rising rental-DOM trend means longer vacancies and softer asking-rent achievability than the comps imply.
- What's the recent tenant-quality profile in this submarket — average credit score on applications, eviction rate, late-payment / NSF rate, and stable-employment percentage? A property-management company in the area should have these aggregated.
- How much new for-sale + rental construction is in the pipeline within 1–3 miles? Heavy new supply typically softens prices + rents 12–24 months out; constrained supply supports both.
Investment metrics
- 1% rule
- 1.04% ✓
- Cap rate
- 7.88%
- Cash-on-cash
- 5.66%
- DSCR
- 1.25
- GRM
- 8.0
CMA / ARV
- ARV (median comp)
- $156,737
- List price
- $99,000
- Delta
- -36.84%
- Verdict
- UNDERPRICED
- Comps
- 2 within 1.0 mi
Show comp detail 1 sale within ~0.75 mi
| Address | Dist | Beds/Ba | Sqft | Sold | Price | $/sf | Match |
|---|---|---|---|---|---|---|---|
| 15 Rainbow Park | 0.06mi | 2/1.0 (-1) | 980 (+3%) | 13mo | $68,000 | $69 | 76 |
Match score weights: distance 35% · size 25% · config 20% · recency 20%. Top-matched comps best support the ARV.
Projected returns pro-forma
10.0% appreciation · 3.0% rent growth · sell at horizon
- IRR
- 28.4%
- Equity multiple
- 3.25×
- Total profit
- $62,258
- Equity at exit
- $89,187
- IRR
- 24.7%
- Equity multiple
- 7.38×
- Total profit
- $176,824
- Equity at exit
- $192,335
Cash invested: $27,720 (down + closing). Projections, not guarantees.
Landlord ↔ Tenant lean methodology
- Overall (STATE)
- 15 Strongly Tenant-Friendly
- State New York
- 15 Strongly Tenant-Friendly · D+10
- County
- — inherits STATE
- City
- — inherits STATE
ZIP-level market 14131
- Home prices YoY
- 7.8%
- Active inventory
- 32
- Price-to-rent
- 8.0×
Monthly cashflow live
- Estimated rent
- $1,031 medium interval (Pro) →
- Mortgage (P&I)
- −$519
- Tax est. 1.5%
- −$124 /mo · $1,485/yr
- Insurance
- −$41
- HOA
- −$0
- Vacancy / Maint / Mgmt
- −$217
- Net cashflow
- $131
Break-even live
Sensitivity live
| Price | -10% $199 | -5% $165 | +0% $131 | +5% $96 | +10% $62 |
|---|---|---|---|---|---|
| Rent | -10% $49 | -5% $90 | +0% $131 | +5% $171 | +10% $212 |
| Rate | -1.0pp $181 | -0.5pp $156 | base $131 | +0.5pp $105 | +1.0pp $79 |
UW: 25.0% down · 7.5% · 30yr · 1.5% tax · 5.0% vac · 8.0% maint · 8.0% mgmt
Financing live
Cash to close
- Down payment
- $24,750
- Closing costs
- $2,970
- Reserves months
- —
- Total cash needed
- —
Loan-product check · same deal, 3 products live
Conventional
25% down · 7.5% · 30yr
- Down + closing
- —
- Monthly P&I
- —
- Monthly cashflow
- —
- DSCR
- —
- Eligible?
- —
Personal DTI + credit; lowest rate.
DSCR
20% down · 8.5% · 30yr
- Down + closing
- —
- Monthly P&I
- —
- Monthly cashflow
- —
- DSCR
- —
- Eligible?
- —
No personal income docs; deal must DSCR.
Hard money
10% down · 12.0% · 12mo
- Down + closing
- —
- Monthly P&I
- —
- Monthly cashflow
- —
- DSCR
- —
- Eligible?
- —
Short-term bridge; refi at stabilization.
Listing history 16 events
-
2026-06-21days on market $99,000 Active 38 DOM
-
2026-06-18days on market $99,000 Active 35 DOM
-
2026-06-17days on market $99,000 Active 34 DOM
-
2026-06-16days on market $99,000 Active 33 DOM
-
2026-06-15days on market $99,000 Active 32 DOM
-
2026-06-13days on market $99,000 Active 30 DOM
-
2026-06-13days on market $99,000 Active 29 DOM
-
2026-06-10pricedays on market $99,000 Active 27 DOM
-
2026-06-09days on market $122,500 Active 26 DOM
-
2026-06-08days on market $122,500 Active 25 DOM
-
2026-06-07days on market $122,500 Active 24 DOM
-
2026-06-03days on market $122,500 Active 20 DOM
-
2026-06-02days on market $122,500 Active 19 DOM
-
2026-06-01pricedays on market $122,500 Active 18 DOM
-
2026-05-31days on market $124,900 Active 17 DOM
-
2026-05-14$124,900 Active 440-char remark
ⓘ Source: listings_history table (triggers on properties + properties_extension) + one-shot
backfill from property_details.listing_events for pre-trigger history.
Climate risk First Street
- Flood 1/10 Low FEMA zone X (unshaded) · 0% chance over 30 yrs
- Wildfire 3/10 Moderate
- Heat 2/10 Low 7 d/yr ≥95°F today · 14 d/yr by 30 yrs out
- Wind 1/10 Low
- Air quality 2/10 Low 1 unhealthy d/yr today · 2 by 30 yrs out
Nearby sold comps map
Loading sold comps map…
Walkable amenities ~0.75 mi
Loading nearby amenities…
Taxation est. · year 1
- Rental income
- $12,378
- − Mortgage interest
- −$5,546
- − Property taxes
- −$1,485
- − Insurance
- −$495
- − Repairs & maintenance
- −$990
- − Management
- −$990
- − Depreciation
- −$2,880
- Taxable loss
- −$8
- Est. tax savings @ 24.0%
- +$2
- After-tax cash flow
- $1,570/yr
For passive investors: Depreciation is non-cash, so a rental often shows a tax loss while cash-flowing — sheltering income. Rental losses are passive: they offset passive income freely, and up to $25,000/yr can offset ordinary (W-2) income if you actively participate and your MAGI is under $100k (phasing out to $0 by $150k); unused losses carry forward. On sale, claimed depreciation is recaptured at up to 25%, and gains may owe capital-gains tax (a 1031 exchange can defer both). Figures are a year-1 estimate at your 24.0% rate — not tax advice; consult a CPA.
Condition & rehab AI · 2 photos
This fully updated mobile home is move-in ready with recent major upgrades, including a new roof and furnace. It offers a good condition score and is situated on a spacious lot with a well-maintained lawn and landscaping.
Value-add opportunities
- Both Painting the exterior — Enhances curb appeal and can increase both resale and rental value
- Both Landscaping improvements — Enhances curb appeal and can increase both resale and rental value
Renovation cost estimate screening
Value-add ROI direction
- Both Painting the exterior — Enhances curb appeal and can increase both resale and rental value ↑
- Both Landscaping improvements — Enhances curb appeal and can increase both resale and rental value ↑
ⓘ Cost ranges are severity-bucket heuristics (US national rule-of-thumb). Get contractor quotes + a written scope before underwriting a rehab budget.
Schools (NCES district)
- District
- Wilson Central School District
- NCES district ID
- 3631560
- Math proficiency
- 52% ▼ -7.00%
- Reading proficiency
- 55% ▲ 3.00%
- Median HH income
- $57,181
- Composite
- 46.37/100
- National rank
- #2462
- State rank
- #319 of 590 in NY
Livability — Ransomville
- Score
- 68/100
- State rank
- #548
- US rank
- #9859
Category grades
Schools grade is shown separately in the Schools card above.
Census & demographics
- City population
- 5,339
- Population (ZIP)
- 5,339
Population outlook (Niagara County) Hauer SSP2
- Today (2025)
- 204,149 people
- By 2030
- 197,900 · -3.1%
- By 2040
- 182,239 · -10.7%
- By 2050
- 165,198 · -19.1%
- By 2075
- 129,416 · -36.6%
- By 2100
- 96,222 · -52.9%
Race, ethnicity, and origin ACS 2023
- Neighborhood character
- Predominantly White (94%)
- Race & ethnicity
- White 94% Two or more races 4% Hispanic / Latino 3% Black 2%
- Common ancestry
- Romanian 14% Slovak 4% Lithuanian 2%
- Foreign-born
- 2% · Canada
- Languages at home
- 98% English-only · Spanish 1%
Political lean MEDSL · Niagara
- 2024 margin
- R (+14.9) · D 42.5% · R 57.5%
- 2008→2024 swing
- -15.9pp toward R · 2008: 1.0pp · 2024: -14.9pp
- All cycles
- 2024: R+14.9 2020: R+9.7 2016: R+19.0 2012: D+0.6 2008: D+1.0
Not yet ingested
- Civics
- —
Market trends
- HPI YoY
- ▲ 21.41%
- Current HPI
- 297.4314
- Rent YoY
- —
- Metro
- —
- State GDP YoY
- ▲ 2.60%
- F500 in state
- 92
Industry mix (Fortune 500 HQ in NY)
| Industry | F500 HQs | Revenue |
|---|---|---|
| Financial Services | 10 | $950B |
|
||
| Consumer Goods | 9 | $162B |
|
||
| Insurance | 4 | $225B |
|
||
| Telecommunications | 2 | $144B |
|
||
| Pharmaceuticals | 2 | $112B |
|
||
| Media / Entertainment | 2 | $69B |
|
||
Price history
-20.7% since first listed3 events — show timeline
- 2026-06-09 Price Changed $99,000 WNYREIS
- 2026-06-01 Price Changed $122,500 WNYREIS
- 2026-05-14 Listed $124,900 WNYREIS
Cash-flow waterfall
monthlySold comps — $/sqft
last 12 mo · ≤1 miLoading sold comps…