 🏗️ New Construction
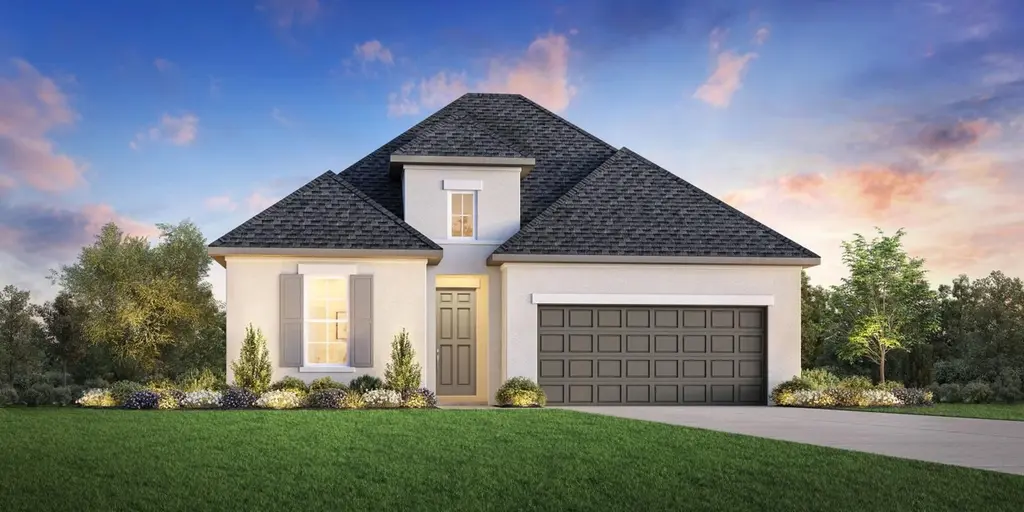
Lavaca Plan · Sienna, TX
Flood risk 4/10 · Minor
- FEMA flood zone
- X
- Chance of flooding over 30 yrs
- 0.24%
- Est. flood insurance / yr
- $507 – $1,088
Fire risk 4/10 · Minor
- Est. fire insurance / yr
- $1,222 – $2,270
Heat risk 9/10 · Severe
- Hot days now (above 111°F)
- 7 days/yr
- Hot days in 30 yrs
- 23 days/yr
Wind risk 9/10 · Severe
- Chance of severe wind over 30 yrs
- 99.0%
Air-quality risk 2/10 · Minimal
- Unhealthy air days now
- 2 days/yr
- Unhealthy air days in 30 yrs
- 2 days/yr
Risk factors via First Street. Map © Google.
Why this score? — see what drove the D grade
The composite is a weighted blend of 9 inputs, each scored 0–100. Each bar is that input's sub-score; the figure is the points it added to the 100-point composite (weight × sub-score).
- Cash flow +10.9/30.0
- ARV discount +7.5/15.0
- Condition / age +4.8/5.0
- Schools +4.5/10.0
- Appreciation +4.2/10.0
- 1% rule +3.2/10.0
- DSCR +3.2/10.0
- Rent growth +2.5/5.0
- Livability +2.5/5.0
$458,995
🖨 Deal sheet (PDF) 📄 Offer letter ✓ Due diligence
Listing remarks
The Lavaca's welcoming porch and inviting foyer hallway with tray ceilings open onto the elegant formal dining room, offering views to the expansive great room and desirable covered patio. The well-appointed kitchen overlooks a bright casual dining area, and is complete with a large center island with breakfast bar, plenty of counter and cabinet space, and enormous walk-in pantry. The impressive primary bedroom suite is enhanced by a gorgeous cathedral ceiling, dual walk-in closets, and deluxe primary bath with dual-sink vanity, large soaking tub, luxe shower with seat, and private water closet. Secondary bedrooms feature sizable closets, one with private bath, two with shared hall bath. Ad
Key facts
- Expansive great room
- Welcoming porch
- 2 garage spots
Tags
Property features AI
Finance
- Financial info: List price $458,995
Exterior
- Parking: 2 total parking spaces; 2-car garage
- Home design: Plan: Lavaca; New construction (Plan inventory)
Interior
- Bedrooms: 4 bedrooms
- Bathrooms: 3 full bathrooms
- Interior features: Living area of 2,496
Neighborhood map
What this means for you Summary
Snapshot
- This is a 4-bed/3.0-bath single-family listed at $459k. Condition is rated excellent.
Deal economics
- At list price, monthly cash flow is $-206 ($-2k/yr) — negative.
- To cash-flow at today's rent, offer at most $436k (5.1% below list).
- To meet the 1% rule (rent ≥ 1% of price), the offer needs to be $381k (17.0% below list).
- Recommended offer: $381k (17.0% below list) — sets the bar for 1% rule.
- Cap rate 5.8% vs local median 3.3% in Sienna — top-decile yield for the area; either an underpriced asset or a hidden risk that comps aren't pricing in. Stress-test before assuming the spread holds.
Location & tenants
- Location reads: area grade D — affects rentability + tenant quality, not the cash-flow math above.
- Fort Bend ISD (suburban): math 44% / reading 53% proficiency, ranked #140 of 826 in TX (top 17%) — families likely to look elsewhere, expect single-tenant / working-renter base with shorter leases.
- Zoned schools: Heritage Rose El (math 29% / reading 28%, grade F, #2,706 of 4,322 statewide, top 63%, 1,209 students, 83% FRL); Billy Baines Middle (math 47% / reading 53%, grade C, #347 of 1,662 statewide, top 21%, 1,296 students, 37% FRL); Ridge Point H S (math 61% / reading 69%, grade B, #198 of 1,632 statewide, top 12%, 3,170 students, 31% FRL) — zoned schools average 50% FRL vs 35% district-wide (15 pts higher); higher-poverty schools than district average — tighter screening recommended.
- Market conditions: Rents soft (-0.1%/yr); 1229 active listings in the ZIP; 3 comparable units currently listed for rent nearby; rentals at typical pace (median 24d on market — plan ~3-4 weeks tenant-placement turnaround); high-income renter base; 12,093 units permitted in Fort Bend County in 2024 (815 in 5+ unit buildings).
- This rent runs 35% of the median local income ($129k/yr) — at the standard rent-burdened threshold; future hikes will face affordability resistance.
Forward outlook
- Local home prices are declining (-1.7%/yr); year-one equity from $3k of loan paydown is wiped out by about $8k of value loss. Plan a longer hold.
- Fort Bend County population projected at +75% by 2050 — long-run rental-demand tailwind backs the buy-and-hold thesis.
Negotiation context
- It's been on market 45 days — a 3% lower offer ($445k) is reasonable based on typical stale-listing flexibility.
Risks & watch-outs
- Climate carrying-cost: severe wind risk, 99% chance of damaging wind over 30y; extreme-heat days projected 7→23/yr by 2055 (HVAC capex compounding) — expect insurance premiums to compound above CPI over the hold.
Questions for the listing agent
- What do current leases actually rent for vs. the listed asking? Can we see a recent rent roll and the last 12 months of T-12 income?
- It's been on market 45 days. Have you received any prior offers? Is the seller open to a 17% concession, seller financing, or rate buy-down credit?
- Is there a deadline driving the sale (1031 exchange, divorce, estate, relocation)? That informs how much negotiation room exists.
- The area grade is low — what's the realistic commute time and amenity access for the typical tenant pool here? Any planned neighborhood developments (good or bad) we should know about?
- What's the average days-on-market for RENTAL listings here right now (not sales)? A rising rental-DOM trend means longer vacancies and softer asking-rent achievability than the comps imply.
- What's the recent tenant-quality profile in this submarket — average credit score on applications, eviction rate, late-payment / NSF rate, and stable-employment percentage? A property-management company in the area should have these aggregated.
- How much new for-sale + rental construction is in the pipeline within 1–3 miles? Heavy new supply typically softens prices + rents 12–24 months out; constrained supply supports both.
Investment metrics
- 1% rule
- 0.82% ✗
- Cap rate
- 5.76%
- Cash-on-cash
- -1.90%
- DSCR
- 0.92
- GRM
- 10.2
CMA / ARV
- ARV (median comp)
- $465,451
- List price
- $458,995
- Delta
- -1.39%
- Verdict
- FAIR
- Comps
- 20 within 1.0 mi
Show comp detail 12 sales within ~0.75 mi
| Address | Dist | Beds/Ba | Sqft | Sold | Price | $/sf | Match |
|---|---|---|---|---|---|---|---|
| 10147 Deerpark Dr | 0.17mi | 4/3.0 | 2,572 (+3%) | 11mo | $405,000 | $157 | 78 |
| 10534 Emory Park | 0.46mi | 4/3.0 | 2,538 (+2%) | 7mo | $439,655 | $173 | 70 |
| 2023 Green Haven Ct | 0.37mi | 4/3.0 | 2,623 (+5%) | 8mo | $450,000 | $172 | 68 |
| 10723 Kingston Spring Dr | 0.69mi | 4/3.0 | 2,525 (+1%) | 1mo | $449,000 | $178 | 65 |
| 10751 Kingston Spg | 0.74mi | 4/3.0 | 2,472 (-1%) | 1mo | $424,000 | $172 | 63 |
| 2006 Laurelwood Trl | 0.51mi | 3/3.0 (-1) | 2,408 (-4%) | 5mo | $399,900 | $166 | 61 |
| 1610 Country Air Ln | 0.72mi | 4/3.0 | 2,388 (-4%) | 0mo | $369,900 | $155 | 59 |
| 1518 Country Air Ln | 0.68mi | 4/3.0 | 2,388 (-4%) | 10mo | $405,000 | $170 | 53 |
| 10203 Wylde Point Ln | 0.40mi | 4/2.5 | 2,764 (+11%) | 11mo | $585,000 | $212 | 53 |
| 10502 William Park Dr | 0.54mi | 3/2.5 (-1) | 2,350 (-6%) | 6mo | $420,000 | $179 | 53 |
| 10519 Lantana Pass | 0.51mi | 3/2.5 (-1) | 2,743 (+10%) | 6mo | $464,999 | $170 | 48 |
| 1506 Country Air Ln | 0.65mi | 4/3.5 | 2,808 (+12%) | 4mo | $425,000 | $151 | 44 |
Match score weights: distance 35% · size 25% · config 20% · recency 20%. Top-matched comps best support the ARV.
Projected returns pro-forma
-1.67% appreciation · 0.0% rent growth · sell at horizon
- IRR
- -14.2%
- Equity multiple
- 0.44×
- Total profit
- $-73,146
- Equity at exit
- $97,619
- IRR
- -10.6%
- Equity multiple
- 0.24×
- Total profit
- $-99,469
- Equity at exit
- $90,418
Cash invested: $130,326 (down + closing). Projections, not guarantees.
Landlord ↔ Tenant lean methodology
- Overall (STATE)
- 87 Strongly Landlord-Friendly
- State Texas
- 87 Strongly Landlord-Friendly · R+5
- County
- — inherits STATE
- City
- — inherits STATE
ZIP-level market 77459
- Home prices YoY
- -0.8%
- Rents YoY
- -0.1%
- Active inventory
- 1229
- Price-to-rent
- 10.0×
Monthly cashflow live
- Estimated rent
- $3,811 medium interval (Pro) →
- Mortgage (P&I)
- −$2,441
- Tax est. 1.5%
- −$582 /mo · $6,982/yr
- Insurance
- −$194
- HOA
- −$0
- Vacancy / Maint / Mgmt
- −$800
- Net cashflow
- $-206
Break-even live
Sensitivity live
| Price | -10% $115 | -5% $-45 | +0% $-206 | +5% $-367 | +10% $-528 |
|---|---|---|---|---|---|
| Rent | -10% $-507 | -5% $-357 | +0% $-206 | +5% $-56 | +10% $95 |
| Rate | -1.0pp $28 | -0.5pp $-88 | base $-206 | +0.5pp $-327 | +1.0pp $-450 |
UW: 25.0% down · 7.5% · 30yr · 1.5% tax · 5.0% vac · 8.0% maint · 8.0% mgmt
Financing live
Cash to close
- Down payment
- $116,363
- Closing costs
- $13,964
- Reserves months
- —
- Total cash needed
- —
Loan-product check · same deal, 3 products live
Conventional
25% down · 7.5% · 30yr
- Down + closing
- —
- Monthly P&I
- —
- Monthly cashflow
- —
- DSCR
- —
- Eligible?
- —
Personal DTI + credit; lowest rate.
DSCR
20% down · 8.5% · 30yr
- Down + closing
- —
- Monthly P&I
- —
- Monthly cashflow
- —
- DSCR
- —
- Eligible?
- —
No personal income docs; deal must DSCR.
Hard money
10% down · 12.0% · 12mo
- Down + closing
- —
- Monthly P&I
- —
- Monthly cashflow
- —
- DSCR
- —
- Eligible?
- —
Short-term bridge; refi at stabilization.
Rent comps 3 comps
| Address | Beds | Baths | Sqft | Rent | $/sqft | DOM | Units | Dist |
|---|---|---|---|---|---|---|---|---|
| 1714 Forest Mist Dr Missouri City, TX | 3.0 | 3.0 | 1979 | $3,000 | $1.52 | 45d | 1 | 0.27mi |
| 8719 Fox Trail Dr Missouri City, TX | 4.0 | 3.5 | 2143 | $6,000 | $2.80 | 24d | 1 | 0.97mi |
| 2142 Ironwood Pass Dr Missouri City, TX | 4.0 | 3.0 | 2140 | $6,000 | $2.80 | 0d | 1 | 1.02mi |
Listing history 14 events
-
2026-06-21days on market $458,995 Active 45 DOM
-
2026-06-18days on market $458,995 Active 42 DOM
-
2026-06-17days on market $458,995 Active 41 DOM
-
2026-06-16days on market $458,995 Active 40 DOM
-
2026-06-15days on market $458,995 Active 39 DOM
-
2026-06-13days on market $458,995 Active 37 DOM
-
2026-06-09days on market $458,995 Active 33 DOM
-
2026-06-07days on market $458,995 Active 31 DOM
-
2026-06-04days on market $458,995 Active 28 DOM
-
2026-06-03days on market $458,995 Active 27 DOM
-
2026-06-02days on market $458,995 Active 26 DOM
-
2026-06-01days on market $458,995 Active 25 DOM
-
2026-05-31days on market $458,995 Active 24 DOM
-
2026-05-07$458,995 Active 806-char remark
ⓘ Source: listings_history table (triggers on properties + properties_extension) + one-shot
backfill from property_details.listing_events for pre-trigger history.
Climate risk First Street
- Flood 4/10 Moderate FEMA zone X · 24% chance over 30 yrs
- Wildfire 4/10 Moderate
- Heat 9/10 Extreme 7 d/yr ≥111°F today · 23 d/yr by 30 yrs out
- Wind 9/10 Extreme 99% chance of damaging wind over 30 yrs
- Air quality 2/10 Low 2 unhealthy d/yr today · 2 by 30 yrs out
Nearby sold comps map
Loading sold comps map…
Walkable amenities ~0.75 mi
Loading nearby amenities…
Taxation est. · year 1
- Rental income
- $45,727
- − Mortgage interest
- −$26,073
- − Property taxes
- −$6,982
- − Insurance
- −$2,327
- − Repairs & maintenance
- −$3,658
- − Management
- −$3,658
- − Depreciation
- −$13,540
- Taxable loss
- −$10,512
- Est. tax savings @ 24.0%
- +$2,523
- After-tax cash flow
- $47/yr
For passive investors: Depreciation is non-cash, so a rental often shows a tax loss while cash-flowing — sheltering income. Rental losses are passive: they offset passive income freely, and up to $25,000/yr can offset ordinary (W-2) income if you actively participate and your MAGI is under $100k (phasing out to $0 by $150k); unused losses carry forward. On sale, claimed depreciation is recaptured at up to 25%, and gains may owe capital-gains tax (a 1031 exchange can defer both). Figures are a year-1 estimate at your 24.0% rate — not tax advice; consult a CPA.
Condition & rehab AI · 11 photos
This home is in excellent condition with a modern and well-maintained interior and exterior. It is move-in ready and has the potential for further value increases through minor updates.
Value-add opportunities
- Both Painting the exterior brick facade — Enhances curb appeal and can increase both resale and rental value.
- Both Landscaping improvements — Enhances curb appeal and can increase both resale and rental value.
- Both Adding smart home features — Improves convenience and can increase both resale and rental value.
- Both Upgrading the kitchen appliances — Modernizes the kitchen and can increase both resale and rental value.
- Both Adding a smart thermostat — Improves energy efficiency and can increase both resale and rental value.
Renovation cost estimate screening
Value-add ROI direction
- Both Painting the exterior brick facade — Enhances curb appeal and can increase both resale and rental value. ↑
- Both Landscaping improvements — Enhances curb appeal and can increase both resale and rental value. ↑
- Both Adding smart home features — Improves convenience and can increase both resale and rental value. ↑
- Both Upgrading the kitchen appliances — Modernizes the kitchen and can increase both resale and rental value. ↑
- Both Adding a smart thermostat — Improves energy efficiency and can increase both resale and rental value. ↑
ⓘ Cost ranges are severity-bucket heuristics (US national rule-of-thumb). Get contractor quotes + a written scope before underwriting a rehab budget.
Schools (NCES district)
- District
- Fort Bend ISD
- NCES district ID
- 4819650
- Math proficiency
- 44% ▼ -15.00%
- Reading proficiency
- 53% ▼ -4.00%
- Median HH income
- $82,360
- Composite
- 44.61/100
- National rank
- #2779
- State rank
- #140 of 826 in TX
Livability — Sienna
No livability data for this city. (Only ~50 U.S. cities are tracked.)
Census & demographics
- Census place
- Sienna, TX
- County
- Fort Bend County · 836,777 people
- Metro
- Houston-The Woodlands-Sugar Land, TX
- Population (ZIP)
- 84,221
- Household income
- $129,151
- Rent vs Own
- Severe rent burden
- 1004.0
Population outlook (Fort Bend County) Hauer SSP2
- Today (2025)
- 1,004,526 people
- By 2030
- 1,153,104 · +14.8%
- By 2040
- 1,453,718 · +44.7%
- By 2050
- 1,753,781 · +74.6%
- By 2075
- 2,455,772 · +144.5%
- By 2100
- 2,930,528 · +191.7%
Race, ethnicity, and origin ACS 2023
- Neighborhood character
- Highly diverse neighborhood (Simpson 0.75)
- Race & ethnicity
- White 34% Black 26% Asian 22% Hispanic / Latino 13% Two or more races 10%
- Hispanic origin (detail)
- Mexican 7%
- Common ancestry
- Lithuanian 2% Slovak 1% Italian 1%
- Foreign-born
- 21% · Canada, China, Vietnam
- Languages at home
- 73% English-only · Other Asian/Pacific 8% Spanish 7% Other Indo-European 5%
Political lean MEDSL · Fort Bend
- 2024 margin
- Toss-up / Even · D 49.5% · R 47.9% · Other 2.6%
- 2008→2024 swing
- +4.0pp toward D · 2008: -2.4pp · 2024: 1.6pp
- All cycles
- 2024: D+1.6 2020: D+10.6 2016: D+6.6 2012: R+6.8 2008: R+2.4
Not yet ingested
- Civics
- —
Market trends
- HPI YoY
- ▼ -1.67%
- Current HPI
- 212.3573
- Rent YoY
- ▼ -0.15%
- Metro
- Houston-The Woodlands-Sugar Land, TX
- State GDP YoY
- ▲ 3.95%
- F500 in state
- 110
Industry mix (Fortune 500 HQ in TX)
| Industry | F500 HQs | Revenue |
|---|---|---|
| Energy | 16 | $1,198B |
|
||
| Technology | 5 | $198B |
|
||
| Engineering / Construction | 4 | $72B |
|
||
| Energy Services | 3 | $60B |
|
||
| Utilities | 3 | $41B |
|
||
| Healthcare | 2 | $330B |
|
||
Cash-flow waterfall
monthlySold comps — $/sqft
last 12 mo · ≤1 miLoading sold comps…