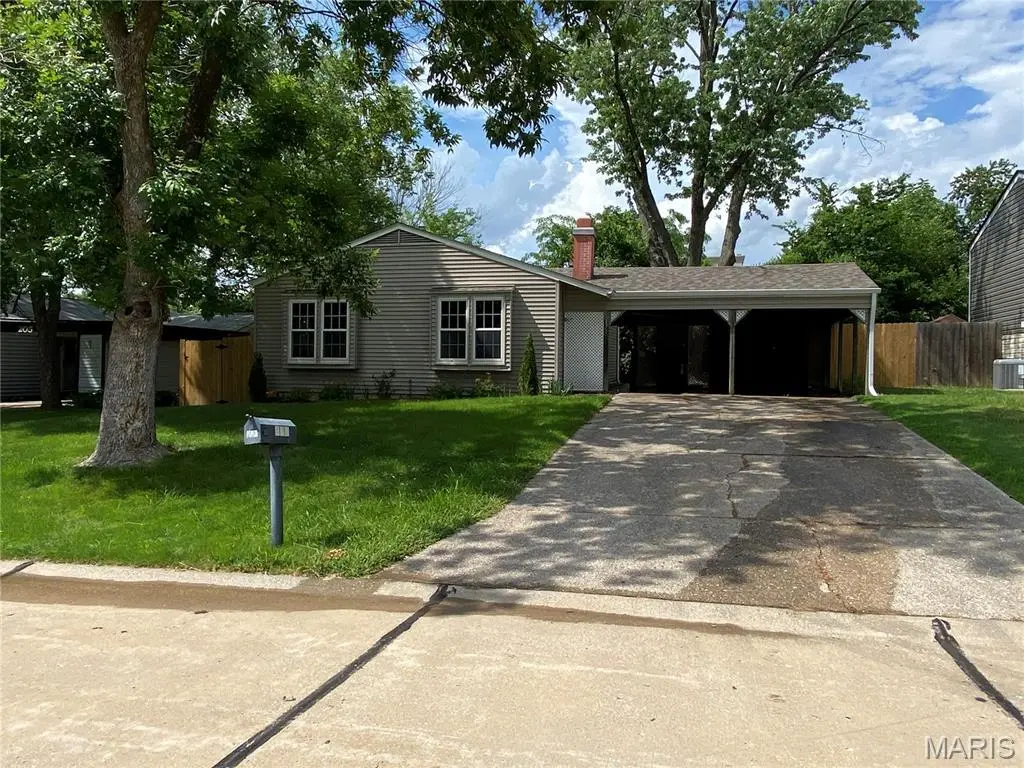
203 Wild Winds Dr · O'Fallon, MO
Flood risk 1/10 · Minimal
- FEMA flood zone
- X (unshaded)
- Chance of flooding over 30 yrs
- 0.0%
- Est. flood insurance / yr
- $507 – $1,088
Fire risk 1/10 · Minimal
- Est. fire insurance / yr
- $1,054 – $1,958
Heat risk 5/10 · Moderate
- Hot days now (above 107°F)
- 7 days/yr
- Hot days in 30 yrs
- 20 days/yr
Wind risk 2/10 · Minimal
- Chance of severe wind over 30 yrs
- 1.0%
Air-quality risk 2/10 · Minimal
- Unhealthy air days now
- 1 days/yr
- Unhealthy air days in 30 yrs
- 1 days/yr
Risk factors via First Street. Map © Google.
Why this score? — see what drove the B- grade
The composite is a weighted blend of 9 inputs, each scored 0–100. Each bar is that input's sub-score; the figure is the points it added to the 100-point composite (weight × sub-score).
- Cash flow +26.0/30.0
- ARV discount +15.0/15.0
- DSCR +8.7/10.0
- 1% rule +6.6/10.0
- Schools +5.1/10.0
- Rent growth +2.9/5.0
- Livability +2.5/5.0
- Condition / age +2.5/5.0
- Appreciation +0.0/10.0
$174,900
🖨 Deal sheet (PDF) 📄 Offer letter ✓ Due diligence
Listing remarks
Handyman special/sweat equity opportunity, priced well below market. Great starter home for someone looking to build instant equity and make it your own. Three bedroom, 1 bath ranch in great location, priced below market. Home has newer roof, windows and doors, privacy fence, and updated kitchen and bath. Home sold as-is. Buyer may obtain inspections for informational purposes. Broker-owned.
Key facts
- Newer roof
- Newer doors
- Privacy fence
Tags
Property features AI
Exterior
- Parking: Carport with space for 2 vehicles
- Utilities: Public water; Public sewer; Electricity (Ameren); Natural gas connected
- Home design: Single-family residence; One story
- Construction: Frame construction with vinyl siding
- Exterior features: Level lot
Interior
- Bedrooms: Three bedrooms, all on the main level
- Bathrooms: One full bathroom on the main level
- Heating & cooling: Forced-air heating (natural gas); Central air conditioning; Ceiling fans
- Interior features: Fireplace with wood-burning stove and blower fan; Ceiling fans; Central air
Neighborhood map
What this means for you Summary
Snapshot
- This is a 3-bed/1.0-bath single-family listed at $175k.
Deal economics
- At list price, monthly cash flow is $433 ($5k/yr) — positive.
- The deal already cash-flows at list — no discount required.
- Meets the 1% rule at list price ($2k rent vs $175k).
- Cap rate 9.3% vs local median 3.2% in O'Fallon — top-decile yield for the area; either an underpriced asset or a hidden risk that comps aren't pricing in. Stress-test before assuming the spread holds.
Location & tenants
- Location reads: area grade B — affects rentability + tenant quality, not the cash-flow math above.
- Ft. Zumwalt R-II (suburban): math 54% / reading 60% proficiency, ranked #14 of 324 in MO (top 4%) — acceptable for families but not a draw, mixed tenant base, ~2y average lease; only 18% free/reduced lunch — higher-income household profile.
- Zoned schools: Dardenne Elem. (math 47% / reading 52%, grade D, #284 of 1,115 statewide, top 30%, 412 students, 42% FRL); Ft. Zumwalt West High (math 64% / reading 72%, grade B, #13 of 521 statewide, top 2%, 1,778 students, 17% FRL).
- Market conditions: Rents rising (+1.6%/yr); 376 active listings in the ZIP; 2 comparable units currently listed for rent nearby; high-income renter base; 2,021 units permitted in St. Charles County in 2024 (568 in 5+ unit buildings).
Forward outlook
- Local home prices are declining (-3.0%/yr); year-one equity from $1k of loan paydown is wiped out by about $5k of value loss. Plan a longer hold.
- St. Charles County population projected at +22% by 2050 — long-run rental-demand tailwind backs the buy-and-hold thesis.
Negotiation context
- Only 9 days on market — expect competitive offers; lowballing is unlikely to land.
Risks & watch-outs
- Climate carrying-cost: extreme-heat days projected 7→20/yr by 2055 (HVAC capex compounding) — expect insurance premiums to compound above CPI over the hold.
Questions for the listing agent
- Built in 1972 — when were the roof, HVAC, electrical panel, plumbing, and water heater last replaced?
- Is there a deadline driving the sale (1031 exchange, divorce, estate, relocation)? That informs how much negotiation room exists.
- What's the average days-on-market for RENTAL listings here right now (not sales)? A rising rental-DOM trend means longer vacancies and softer asking-rent achievability than the comps imply.
- What's the recent tenant-quality profile in this submarket — average credit score on applications, eviction rate, late-payment / NSF rate, and stable-employment percentage? A property-management company in the area should have these aggregated.
- How much new for-sale + rental construction is in the pipeline within 1–3 miles? Heavy new supply typically softens prices + rents 12–24 months out; constrained supply supports both.
Investment metrics
- 1% rule
- 1.16% ✓
- Cap rate
- 9.27%
- Cash-on-cash
- 10.62%
- DSCR
- 1.47
- GRM
- 7.2
CMA / ARV
- ARV (on-the-fly)
- $263,588
- Comps found
- 12
Show comp detail 12 sales within ~0.75 mi
| Address | Dist | Beds/Ba | Sqft | Sold | Price | $/sf | Match |
|---|---|---|---|---|---|---|---|
| 2416 Merribrook Ln | 0.19mi | 3/1.5 | 1,040 (+8%) | 11mo | $244,900 | $235 | 66 |
| 301 Wild Winds Dr | 0.07mi | 3/2.0 | 1,046 (+9%) | 15mo | $250,000 | $239 | 66 |
| 2006 Winter Hill Dr | 0.32mi | 3/1.5 | 1,020 (+6%) | 11mo | $259,900 | $255 | 64 |
| 1908 Winter Hill Dr | 0.49mi | 3/2.0 | 948 (-2%) | 11mo | $260,000 | $274 | 61 |
| 1903 Autumn Hill Dr | 0.50mi | 3/1.5 | 1,020 (+6%) | 11mo | $244,900 | $240 | 56 |
| 1904 Pebble Brook Dr | 0.47mi | 3/1.5 | 900 (-6%) | 16mo | $249,000 | $277 | 52 |
| 2325 Sundance Dr | 0.50mi | 2/1.0 (-1) | 832 (-14%) | 3mo | $189,900 | $228 | 47 |
| 206 Cherrywood Parc Dr | 0.74mi | 3/2.0 | 1,064 (+11%) | 1mo | $299,999 | $282 | 43 |
| 279 Cherrywood Parc Dr | 0.67mi | 3/2.0 | 1,092 (+14%) | 1mo | $300,000 | $275 | 42 |
| 617 Sundance Dr | 0.69mi | 3/2.0 | 1,078 (+12%) | 4mo | $279,900 | $260 | 40 |
| 2406 Amarillo Dr | 0.54mi | 2/1.5 (-1) | 832 (-14%) | 6mo | $245,000 | $294 | 40 |
| 27 Laura Dr | 0.63mi | 4/2.0 (+1) | 1,092 (+14%) | 5mo | $325,000 | $298 | 35 |
Match score weights: distance 35% · size 25% · config 20% · recency 20%. Top-matched comps best support the ARV.
Projected returns pro-forma
-3.0% appreciation · 1.59% rent growth · sell at horizon
- IRR
- -2.0%
- Equity multiple
- 0.93×
- Total profit
- $-3,569
- Equity at exit
- $26,078
- IRR
- 6.2%
- Equity multiple
- 1.43×
- Total profit
- $21,131
- Equity at exit
- $15,122
Cash invested: $48,972 (down + closing). Projections, not guarantees.
Landlord ↔ Tenant lean methodology
- Overall (STATE)
- 81 Strongly Landlord-Friendly
- State Missouri
- 81 Strongly Landlord-Friendly · R+10
- County
- — inherits STATE
- City
- — inherits STATE
ZIP-level market 63368
- Home prices YoY
- -20.7%
- Rents YoY
- 1.6%
- Active inventory
- 376
- Price-to-rent
- 7.2×
Monthly cashflow live
- Estimated rent
- $2,033 medium interval (Pro) →
- Mortgage (P&I)
- −$917
- Tax from tax record
- −$182 /mo · $2,188/yr
- Insurance
- −$73
- HOA
- −$0
- Vacancy / Maint / Mgmt
- −$427
- Net cashflow
- $433
Break-even live
Sensitivity live
| Price | -10% $532 | -5% $483 | +0% $433 | +5% $384 | +10% $334 |
|---|---|---|---|---|---|
| Rent | -10% $273 | -5% $353 | +0% $433 | +5% $514 | +10% $594 |
| Rate | -1.0pp $522 | -0.5pp $478 | base $433 | +0.5pp $388 | +1.0pp $342 |
UW: 25.0% down · 7.5% · 30yr · 1.5% tax · 5.0% vac · 8.0% maint · 8.0% mgmt
Financing live
Cash to close
- Down payment
- $43,725
- Closing costs
- $5,247
- Reserves months
- —
- Total cash needed
- —
Loan-product check · same deal, 3 products live
Conventional
25% down · 7.5% · 30yr
- Down + closing
- —
- Monthly P&I
- —
- Monthly cashflow
- —
- DSCR
- —
- Eligible?
- —
Personal DTI + credit; lowest rate.
DSCR
20% down · 8.5% · 30yr
- Down + closing
- —
- Monthly P&I
- —
- Monthly cashflow
- —
- DSCR
- —
- Eligible?
- —
No personal income docs; deal must DSCR.
Hard money
10% down · 12.0% · 12mo
- Down + closing
- —
- Monthly P&I
- —
- Monthly cashflow
- —
- DSCR
- —
- Eligible?
- —
Short-term bridge; refi at stabilization.
Rent comps 2 comps
| Address | Beds | Baths | Sqft | Rent | $/sqft | DOM | Units | Dist |
|---|---|---|---|---|---|---|---|---|
| 25 Joan Dr Saint Peters, MO | 2.0 | 1.0 | 950 | $1,700 | $1.79 | 26d | 1 | 0.66mi |
| 43 Kingspointe Dr Saint Peters, MO | 3.0 | 2.0 | 1072 | $2,125 | $1.98 | 26d | 1 | 1.33mi |
Listing history 10 events
-
2026-06-21statusdays on market $174,900 Pending 9 DOM
-
2026-06-18days on market $174,900 Active 8 DOM
-
2026-06-17days on market $174,900 Active 7 DOM
-
2026-06-16days on market $174,900 Active 6 DOM
-
2026-06-16remarks 394-char remark
-
2026-06-15remarks 359-char remark
-
2026-06-15price $174,900 Active 5 DOM
-
2026-06-15days on market $189,900 Active 5 DOM
-
2026-06-13remarks 257-char remark
-
2026-06-13$189,900 Active 3 DOM
ⓘ Source: listings_history table (triggers on properties + properties_extension) + one-shot
backfill from property_details.listing_events for pre-trigger history.
Tax reassessment forecast MO · Resets to sale price
- Current annual tax
- $2,188 · $182/mo
- Projected year-2 tax
- $2,188 · $182/mo
- Expected delta
- $0/yr ($0/mo · 0.0%)
ⓘ Screening estimate from a state-policy table — verify with the county assessor before closing.
Climate risk First Street
- Flood 1/10 Low FEMA zone X (unshaded) · 0% chance over 30 yrs
- Wildfire 1/10 Low
- Heat 5/10 Major 7 d/yr ≥107°F today · 20 d/yr by 30 yrs out
- Wind 2/10 Low 100% chance of damaging wind over 30 yrs
- Air quality 2/10 Low 1 unhealthy d/yr today · 1 by 30 yrs out
Nearby sold comps map
Loading sold comps map…
Walkable amenities ~0.75 mi
Loading nearby amenities…
Taxation est. · year 1
- Rental income
- $24,392
- − Mortgage interest
- −$9,797
- − Property taxes
- −$2,188
- − Insurance
- −$874
- − Repairs & maintenance
- −$1,951
- − Management
- −$1,951
- − Depreciation
- −$5,088
- Taxable income
- $2,542
- Est. tax owed @ 24.0%
- −$610
- After-tax cash flow
- $4,591/yr
For passive investors: Depreciation is non-cash, so a rental often shows a tax loss while cash-flowing — sheltering income. Rental losses are passive: they offset passive income freely, and up to $25,000/yr can offset ordinary (W-2) income if you actively participate and your MAGI is under $100k (phasing out to $0 by $150k); unused losses carry forward. On sale, claimed depreciation is recaptured at up to 25%, and gains may owe capital-gains tax (a 1031 exchange can defer both). Figures are a year-1 estimate at your 24.0% rate — not tax advice; consult a CPA.
Schools (NCES district)
- District
- Ft. Zumwalt R-II
- NCES district ID
- 2908370
- Math proficiency
- 54% ▼ -7.00%
- Reading proficiency
- 60% ▼ -4.00%
- Median HH income
- $75,817
- Composite
- 51.04/100
- National rank
- #1772
- State rank
- #14 of 324 in MO
Livability — O'Fallon
No livability data for this city. (Only ~50 U.S. cities are tracked.)
Census & demographics
- County
- Saint Charles County · 399,703 people
- City population
- 45,862
- Metro
- St. Louis, MO-IL
- Population (ZIP)
- 46,966
- Household income
- $124,297
- Rent vs Own
- Severe rent burden
- 538.0
Population outlook (St. Charles County) Hauer SSP2
- Today (2025)
- 437,857 people
- By 2030
- 461,707 · +5.4%
- By 2040
- 503,222 · +14.9%
- By 2050
- 534,684 · +22.1%
- By 2075
- 597,047 · +36.4%
- By 2100
- 609,682 · +39.2%
Race, ethnicity, and origin ACS 2023
- Neighborhood character
- Predominantly White (84%)
- Race & ethnicity
- White 84% Asian 5% Two or more races 5% Black 4% Hispanic / Latino 3%
- Common ancestry
- Romanian 4% Lithuanian 3% Italian 2%
- Foreign-born
- 6% · Canada, China
- Languages at home
- 93% English-only · Other Asian/Pacific 2% Spanish 2% Other Indo-European 2%
Political lean MEDSL · St. Charles
- 2024 margin
- R (+17.0) · D 40.8% · R 57.8% · Other 1.4%
- 2008→2024 swing
- -7.2pp toward R · 2008: -9.7pp · 2024: -17.0pp
- All cycles
- 2024: R+17.0 2020: R+17.5 2016: R+26.4 2012: R+21.0 2008: R+9.7
Not yet ingested
- Civics
- —
Market trends
- HPI YoY
- ▼ -57.32%
- Current HPI
- 219.7731
- Rent YoY
- ▲ 1.59%
- Metro
- St. Louis, MO-IL
- State GDP YoY
- ▲ 1.84%
- F500 in state
- 20
Industry mix (Fortune 500 HQ in MO)
| Industry | F500 HQs | Revenue |
|---|---|---|
| Healthcare | 1 | $163B |
|
||
| Insurance | 1 | $21B |
|
||
| Industrial Technology | 1 | $17B |
|
||
| Retail | 1 | $16B |
|
||
| Industrial Distribution | 1 | $10B |
|
||
| Utilities | 1 | $9B |
|
||
Price history
+0.0% since first listed3 events — show timeline
- 2026-06-11 Listed $189,900 MARIS as Distributed by MLS Grid
- 2026-06-11 Coming Soon $189,900 MARIS as Distributed by MLS Grid
- 1987-03-01 Sold (Public Records) — Public Records
Property tax history
+4.3%/yrLatest (2025): $2,188 · +7.0% YoY. Source: county tax records.
Cash-flow waterfall
monthlySold comps — $/sqft
last 12 mo · ≤1 miLoading sold comps…