 Duplex
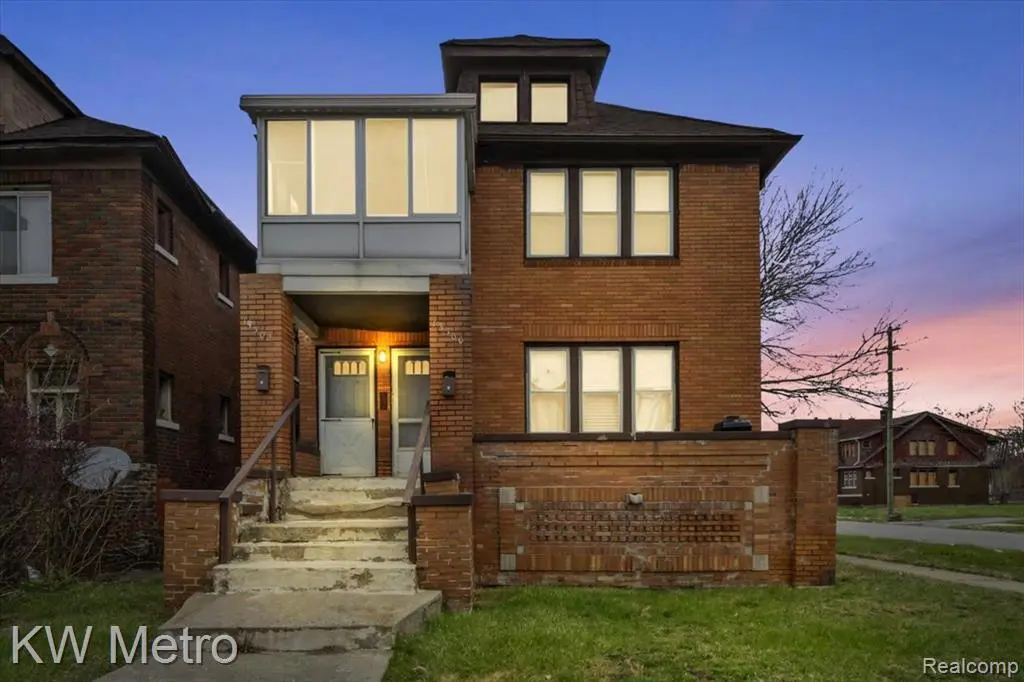
13300 La Salle Blvd · Detroit, MI
Flood risk 1/10 · Minimal
- FEMA flood zone
- X (unshaded)
- Chance of flooding over 30 yrs
- 0.0%
- Est. flood insurance / yr
- $473 – $860
Fire risk 1/10 · Minimal
- Est. fire insurance / yr
- $784 – $1,456
Heat risk 3/10 · Minor
- Hot days now (above 97°F)
- 7 days/yr
- Hot days in 30 yrs
- 15 days/yr
Wind risk 2/10 · Minimal
- Chance of severe wind over 30 yrs
- —
Air-quality risk 4/10 · Minor
- Unhealthy air days now
- 4 days/yr
- Unhealthy air days in 30 yrs
- 6 days/yr
Risk factors via First Street. Map © Google.
Why this score? — see what drove the C+ grade
The composite is a weighted blend of 9 inputs, each scored 0–100. Each bar is that input's sub-score; the figure is the points it added to the 100-point composite (weight × sub-score).
- Cash flow +28.9/30.0
- DSCR +10.0/10.0
- 1% rule +9.2/10.0
- Rent growth +4.0/5.0
- Livability +3.7/5.0
- Condition / age +2.5/5.0
- Schools +1.3/10.0
- ARV discount +0.8/15.0
- Appreciation +0.0/10.0
$179,900
🖨 Deal sheet (PDF) 📄 Offer letter ✓ Due diligence
Multi-family units
County records classify this as Multi-Family (2-4 Unit). Listing-text estimate: 2 units. confirmed
Listing remarks MLS
A true turnkey duplex offering immediate cash flow and strong rental history. Perfect for investors looking to expand their portfolios or buyers looking to house-hack and build long-term wealth. Each unit features 3 bedrooms and 1 bathroom. The lower unit has been occupied by a long-term Section 8 tenant since August 2023 with an excellent payment history. Current contract rent is $1,420 per month, with the tenant paying $358 and Section 8 covering the balance. The tenant also pays gas and electricity and has never missed a payment, consistently paying 24 to 48 hours early. The upper unit is fully renovated, vacant, and move-in ready. It was previously rented for $1,470 per month before becoming vacant in March 2026. Investors can generate approximately $2,890 per month ($34,680 annually) in gross rental income, while owner-occupants can live in the upper unit and offset their housing costs with the lower unit's rental income.
Key facts
- 4,356 sq ft lot
- 2 parking spots
- Built 1929
Property features AI
Finance
- Other: Pets not allowed; Zoned multi-family/residential; Lot roughly 0.1 acre (38 x 110); Directions: South of Davison, West of Woodward
Exterior
- Parking: 2 total parking spaces; On-street parking; Shared driveway
- Utilities: Sewer available; Water available
- Home design: Residential income property (multi-family)
- Construction: Brick construction; Block foundation; Asphalt roof; Built area above grade: 2,568
- Exterior features: Balcony; Private entrance; Back yard fencing; Paved road access
Interior
- Bathrooms: 2 full bathrooms
- Heating & cooling: Forced air heating (natural gas); No cooling
- Interior features: Gas water heater; Unfinished basement
Neighborhood map
What this means for you Summary
Snapshot
- This is a 2 × 3-bed/1.0-bath units multifamily listed at $180k.
Deal economics
- At list price, monthly cash flow is $608 ($7k/yr) — positive. Per door: $304/mo.
- The deal already cash-flows at list — no discount required.
- Meets the 1% rule at list price ($3k rent vs $180k).
- Recommended offer: $177k (1.5% below list) — sets the bar for market timing.
Location & tenants
- Location reads 73/100 on livability (#218 in MI) — a middle-class / working-renter tenant base. Strengths: amenities A+, commute A+, cost of living A+; Watch: schools F, crime F, employment F.
- Detroit Public Schools Community District (urban): math 10% / reading 24% proficiency, ranked #499 of 540 in MI (top 92%) — low school quality limits family demand, transient renter base, plan for 1-2y turnover; 90% free/reduced lunch — lower-income household profile, screen leases tightly.
- Market conditions: Rents rising fast (+6.1%/yr); 350 active listings in the ZIP; 4 comparable units currently listed for rent nearby; rentals at typical pace (median 17d on market — plan ~3-4 weeks tenant-placement turnaround); lower-income renter base — watch delinquency; 2,639 units permitted in Wayne County in 2024 (1,216 in 5+ unit buildings).
- At $2,560/mo this rent would consume 92% of the median local household income ($33k/yr) (locally 2172% of renters already pay >50% of income on rent) — very limited rent-growth headroom before tenants either downsize or default.
Forward outlook
- Local home prices are declining (-3.0%/yr); year-one equity from $1k of loan paydown is wiped out by about $5k of value loss. Plan a longer hold.
- Wayne County population projected at -17% by 2050 — secular population decline; favor cash flow + early exit over multi-decade hold.
- At projected returns (-3.0% appreciation + 6.1% rent growth), your $50k cash investment doubles in ~7 years — after that, you're playing with house money.
Negotiation context
- It's been on market 17 days — a 2% lower offer ($177k) is reasonable based on typical stale-listing flexibility.
- 16 sale attempts since 4y ago with the ask held roughly flat each time — persistent listings suggest the price (not the market) is what's stuck; bring a comps-based counter.
- Current owner paid $152k; 19% above their basis — modest negotiation headroom, anchor on the comps not their cost.
Risks & watch-outs
- Watch-outs: property tax is 2.6% of price; built in 1929 — expect roof / HVAC / electrical / plumbing capex.
Questions for the listing agent
- Can we see the unit-by-unit rent roll, current vacancy, and any below-market leases? What's the average tenancy length?
- What capital expenditures (roof, boiler, parking lot, exteriors) have been made in the last 5 years, and what's planned in the next 2?
- Built in 1929 — when were the roof, HVAC, electrical panel, plumbing, and water heater last replaced?
- Property tax is high relative to price — has the assessment been appealed recently, and will the sale trigger a re-assessment?
- Is there a deadline driving the sale (1031 exchange, divorce, estate, relocation)? That informs how much negotiation room exists.
- Schools are F-rated, which usually means shorter tenancies and higher turnover. Who's the typical renter profile here, and what's been the actual vacancy rate?
- Crime grade is F in this area — have there been break-ins, vandalism, or insurance claims at this property in the last 3 years? What carrier currently insures it and at what premium?
- What's the average days-on-market for RENTAL listings here right now (not sales)? A rising rental-DOM trend means longer vacancies and softer asking-rent achievability than the comps imply.
- What's the recent tenant-quality profile in this submarket — average credit score on applications, eviction rate, late-payment / NSF rate, and stable-employment percentage? A property-management company in the area should have these aggregated.
- How much new apartment / multifamily construction is in the pipeline within 1–3 miles? Heavy new supply (>2% of stock underway) typically softens rents 12–24 months out; light construction supports rent growth.
Investment metrics
- 1% rule
- 1.42% ✓
- Cap rate
- 10.35%
- Cash-on-cash
- 14.48%
- DSCR
- 1.64
- GRM
- 5.9
CMA / ARV
- ARV (on-the-fly)
- $156,648
- Comps found
- 12
Show comp detail 12 sales within ~0.75 mi
| Address | Dist | Beds/Ba | Sqft | Sold | Price | $/sf | Match |
|---|---|---|---|---|---|---|---|
| 2279-2281 W Grand St | 0.17mi | 6/2.5 | 2,650 (+3%) | 5mo | $180,000 | $68 | 82 |
| 2936 W Grand St | 0.42mi | 6/2.0 | 2,600 (+1%) | 4mo | $30,000 | $12 | 73 |
| 3741 Tyler St | 0.74mi | 6/2.5 | 2,600 (+1%) | 2mo | $15,000 | $6 | 62 |
| 3740 Tyler St | 0.74mi | 6/2.0 | 2,600 (+1%) | 2mo | $159,500 | $61 | 60 |
| 3005 Pasadena St | 0.49mi | 6/2.5 | 2,800 (+9%) | 5mo | $86,000 | $31 | 58 |
| 2716 Elmhurst St | 0.67mi | 6/2.0 | 2,750 (+7%) | 1mo | $225,000 | $82 | 54 |
| 3729 W Grand St | 0.74mi | 6/2.0 | 2,704 (+5%) | 3mo | $120,000 | $44 | 52 |
| 2950 Kendall St | 0.57mi | 6/2.0 | 2,250 (-12%) | 1mo | $144,000 | $64 | 50 |
| 3316 Sturtevant St | 0.70mi | 6/2.0 | 2,750 (+7%) | 5mo | $215,000 | $78 | 50 |
| 3734 W Buena Vista St | 0.74mi | 6/2.0 | 2,320 (-10%) | 2mo | $168,000 | $72 | 46 |
| 3230 Fullerton St | 0.60mi | 6/2.0 | 2,950 (+15%) | 3mo | $65,000 | $22 | 42 |
| 2952 Elmhurst St | 0.72mi | 6/2.5 | 2,950 (+15%) | 2mo | $65,000 | $22 | 40 |
Match score weights: distance 35% · size 25% · config 20% · recency 20%. Top-matched comps best support the ARV.
Projected returns pro-forma
-3.0% appreciation · 6.14% rent growth · sell at horizon
- IRR
- 8.8%
- Equity multiple
- 1.36×
- Total profit
- $18,054
- Equity at exit
- $26,824
- IRR
- 20.7%
- Equity multiple
- 3.04×
- Total profit
- $102,677
- Equity at exit
- $15,554
Cash invested: $50,372 (down + closing). Projections, not guarantees.
Landlord ↔ Tenant lean methodology
- Overall (STATE)
- 62 Landlord-Friendly
- State Michigan
- 62 Landlord-Friendly · EVEN
- County
- — inherits STATE
- City
- — inherits STATE
ZIP-level market 48238
- Home prices YoY
- -14.4%
- Rents YoY
- 6.1%
- Active inventory
- 350
- Price-to-rent
- 11.7×
Monthly cashflow live
- Estimated rent
- $2,560 high interval (Pro) →
- Mortgage (P&I)
- −$943
- Tax from tax record
- −$396 /mo · $4,753/yr
- Insurance
- −$75
- HOA
- −$0
- Vacancy / Maint / Mgmt
- −$538
- Net cashflow
- $608
Break-even live
Sensitivity live
| Price | -10% $710 | -5% $659 | +0% $608 | +5% $557 | +10% $506 |
|---|---|---|---|---|---|
| Rent | -10% $406 | -5% $507 | +0% $608 | +5% $709 | +10% $810 |
| Rate | -1.0pp $699 | -0.5pp $654 | base $608 | +0.5pp $561 | +1.0pp $514 |
2-unit breakdown (identical units grouped — click to expand)
| Units | Beds | Baths | Est. rent |
|---|---|---|---|
| 2× units | 3 | 1 | $2,560 |
| #1 | 3 | 1 | $1,280 |
| #2 | 3 | 1 | $1,280 |
| Total (2 units) | $2,560 | ||
UW: 25.0% down · 7.5% · 30yr · 1.5% tax · 5.0% vac · 8.0% maint · 8.0% mgmt
Financing live
Cash to close
- Down payment
- $44,975
- Closing costs
- $5,397
- Reserves months
- —
- Total cash needed
- —
Loan-product check · same deal, 3 products live
Conventional
25% down · 7.5% · 30yr
- Down + closing
- —
- Monthly P&I
- —
- Monthly cashflow
- —
- DSCR
- —
- Eligible?
- —
Personal DTI + credit; lowest rate.
DSCR
20% down · 8.5% · 30yr
- Down + closing
- —
- Monthly P&I
- —
- Monthly cashflow
- —
- DSCR
- —
- Eligible?
- —
No personal income docs; deal must DSCR.
Hard money
10% down · 12.0% · 12mo
- Down + closing
- —
- Monthly P&I
- —
- Monthly cashflow
- —
- DSCR
- —
- Eligible?
- —
Short-term bridge; refi at stabilization.
Rent comps 4 comps
| Address | Beds | Baths | Sqft | Rent | $/sqft | DOM | Units | Dist |
|---|---|---|---|---|---|---|---|---|
| 1699 Glynn Ct Detroit, MI | 5.0 | 3.5 | 2542 | $2,500 | $0.98 | 23d | 1 | 1.18mi |
| 13225 Santa Rosa Dr Detroit, MI | 5.0 | 2.0 | 2100 | $1,700 | $0.81 | 6d | 1 | 1.30mi |
| 41 Richton St Highland Park, MI | 5.0 | 2.0 | 1871 | $1,800 | $0.96 | 16d | 1 | 1.38mi |
| 41 Richton St Highland Park, MI | 5.0 | 2.0 | 1871 | $1,800 | $0.96 | 3d | 1 | 1.38mi |
Listing history 11 events
-
2026-06-21days on market $179,900 Active 17 DOM
-
2026-06-18days on market $179,900 Active 14 DOM
-
2026-06-17days on market $179,900 Active 13 DOM
-
2026-06-16days on market $179,900 Active 12 DOM
-
2026-06-15days on market $179,900 Active 11 DOM
-
2026-06-13days on market $179,900 Active 9 DOM
-
2026-06-13days on market $179,900 Active 8 DOM
-
2026-06-09days on market $179,900 Active 5 DOM
-
2026-06-08days on market $179,900 Active 4 DOM
-
2026-06-07remarks 699-char remark
-
2026-06-07$179,900 Active 3 DOM
ⓘ Source: listings_history table (triggers on properties + properties_extension) + one-shot
backfill from property_details.listing_events for pre-trigger history.
Tax reassessment forecast MI · Partial reset (capped growth)
- Current annual tax
- $4,753 · $396/mo
- Projected year-2 tax
- $4,753 · $396/mo
- Expected delta
- $0/yr ($0/mo · 0.0%)
ⓘ Screening estimate from a state-policy table — verify with the county assessor before closing.
Climate risk First Street
- Flood 1/10 Low FEMA zone X (unshaded) · 0% chance over 30 yrs
- Wildfire 1/10 Low
- Heat 3/10 Moderate 7 d/yr ≥97°F today · 15 d/yr by 30 yrs out
- Wind 2/10 Low
- Air quality 4/10 Moderate 4 unhealthy d/yr today · 6 by 30 yrs out
Nearby sold comps map
Loading sold comps map…
Walkable amenities ~0.75 mi
Loading nearby amenities…
Taxation est. · year 1
- Rental income
- $30,720
- − Mortgage interest
- −$10,077
- − Property taxes
- −$4,753
- − Insurance
- −$900
- − Repairs & maintenance
- −$2,458
- − Management
- −$2,458
- − Depreciation
- −$5,233
- Taxable income
- $4,841
- Est. tax owed @ 24.0%
- −$1,162
- After-tax cash flow
- $6,133/yr
For passive investors: Depreciation is non-cash, so a rental often shows a tax loss while cash-flowing — sheltering income. Rental losses are passive: they offset passive income freely, and up to $25,000/yr can offset ordinary (W-2) income if you actively participate and your MAGI is under $100k (phasing out to $0 by $150k); unused losses carry forward. On sale, claimed depreciation is recaptured at up to 25%, and gains may owe capital-gains tax (a 1031 exchange can defer both). Figures are a year-1 estimate at your 24.0% rate — not tax advice; consult a CPA.
Schools (NCES district)
- District
- Detroit Public Schools Community District
- NCES district ID
- 2601103
- Math proficiency
- 10% ▼ -2.00%
- Reading proficiency
- 24% ▲ 6.00%
- Median HH income
- $25,815
- Composite
- 13.06/100
- National rank
- #9564
- State rank
- #499 of 540 in MI
Livability — Detroit
- Score
- 73/100
- State rank
- #218
- US rank
- #5427
Category grades
Schools grade is shown separately in the Schools card above.
Census & demographics
- Census place
- Detroit, MI
- County
- Wayne County · 1,562,939 people
- City population
- 572,865
- Metro
- Detroit-Warren-Dearborn, MI
- Population (ZIP)
- 24,731
- Household income
- $33,315
- Rent vs Own
- Severe rent burden
- 2172.0
Population outlook (Wayne County) Hauer SSP2
- Today (2025)
- 1,675,273 people
- By 2030
- 1,620,300 · -3.3%
- By 2040
- 1,502,341 · -10.3%
- By 2050
- 1,384,039 · -17.4%
- By 2075
- 1,124,592 · -32.9%
- By 2100
- 881,193 · -47.4%
Race, ethnicity, and origin ACS 2023
- Neighborhood character
- Predominantly Black (94%)
- Race & ethnicity
- Black 94% Two or more races 3% White 1%
- Foreign-born
- 1%
Political lean MEDSL · Wayne
- 2024 margin
- Strong D (+29.0) · D 62.7% · R 33.7% · Other 3.6%
- 2008→2024 swing
- -20.5pp toward R · 2008: 49.5pp · 2024: 29.0pp
- All cycles
- 2024: D+29.0 2020: D+38.1 2016: D+37.3 2012: D+46.9 2008: D+49.5
Not yet ingested
- Civics
- —
Market trends
- HPI YoY
- ▼ -31.96%
- Current HPI
- 189.6227
- Rent YoY
- ▲ 6.14%
- Metro
- Detroit-Warren-Dearborn, MI
- State GDP YoY
- ▲ 1.37%
- F500 in state
- 28
Industry mix (Fortune 500 HQ in MI)
| Industry | F500 HQs | Revenue |
|---|---|---|
| Automotive Parts | 3 | $48B |
|
||
| Automotive | 2 | $372B |
|
||
| Chemicals | 1 | $45B |
|
||
| Automotive Retail | 1 | $29B |
|
||
| Healthcare / Medical Devices | 1 | $23B |
|
||
| Automotive Technology | 1 | $20B |
|
||
Price history
+106.8% since first listed58 events — show timeline
- 2026-06-03 Listed $179,900 REALCOMP
- 2026-06-03 Listed $179,900 MiRealSource-MiMLS
- 2023-12-18 Sold (Public Records) $151,500 Public Records
- 2023-12-08 Pending — REALCOMP
- 2023-12-08 Sold (MLS) $151,500 MiRealSource-MiMLS
- 2023-12-08 Sold (MLS) $151,500 REALCOMP
- 2023-11-22 Listing Removed — MiRealSource-MiMLS
- 2023-11-22 Relisted — MiRealSource-MiMLS
- 2023-10-28 Listing Removed — MiRealSource-MiMLS
- 2023-10-28 Relisted — MiRealSource-MiMLS
- 2023-10-27 Price Changed $147,500 MiRealSource-MiMLS
- 2023-10-27 Price Changed $147,500 MiRealSource-MiMLS
- 2023-10-27 Price Changed $147,500 REALCOMP
- 2023-10-27 Relisted — MiRealSource-MiMLS
- 2023-10-27 Relisted — REALCOMP
- 2023-10-26 Listing Removed — MiRealSource-MiMLS
- 2023-10-26 Pending — MiRealSource-MiMLS
- 2023-10-25 Pending — MiRealSource-MiMLS
- 2023-10-25 Pending — REALCOMP
- 2023-09-21 Listing Removed — MiRealSource-MiMLS
- 2023-09-21 Relisted — MiRealSource-MiMLS
- 2023-09-21 Price Changed $150,000 MiRealSource-MiMLS
- 2023-09-21 Price Changed $150,000 MiRealSource-MiMLS
- 2023-09-20 Price Changed $150,000 REALCOMP
- 2023-09-05 Listing Removed — MiRealSource-MiMLS
- 2023-09-05 Price Changed $159,900 MiRealSource-MiMLS
- 2023-09-05 Price Changed $159,900 MiRealSource-MiMLS
- 2023-09-05 Relisted — MiRealSource-MiMLS
- 2023-09-05 Price Changed $159,900 REALCOMP
- 2023-08-30 Listing Removed — MiRealSource-MiMLS
- 2023-08-30 Relisted — MiRealSource-MiMLS
- 2023-08-29 Price Changed $175,000 MiRealSource-MiMLS
- 2023-08-29 Price Changed $175,000 MiRealSource-MiMLS
- 2023-08-29 Price Changed $175,000 REALCOMP
- 2023-08-19 Listing Removed — MiRealSource-MiMLS
- 2023-08-19 Relisted — MiRealSource-MiMLS
- 2023-08-09 Listing Removed — MiRealSource-MiMLS
- 2023-08-09 Relisted — MiRealSource-MiMLS
- 2023-08-08 Listing Removed — MiRealSource-MiMLS
- 2023-08-07 Listed $200,000 MiRealSource-MiMLS
- 2023-08-07 Listed $200,000 MiRealSource-MiMLS
- 2023-08-07 Listed $200,000 REALCOMP
- 2023-06-23 Sold (MLS) $40,000 MiRealSource-MiMLS
- 2023-06-23 Sold (MLS) $40,000 REALCOMP
- 2023-06-14 Pending — MiRealSource-MiMLS
- 2023-06-14 Pending — REALCOMP
- 2023-06-08 Price Changed $49,000 MiRealSource-MiMLS
- 2023-06-08 Price Changed $49,000 REALCOMP
- 2023-05-04 Price Changed $58,000 MiRealSource-MiMLS
- 2023-05-03 Price Changed $58,000 REALCOMP
- 2023-03-20 Price Changed $68,900 MiRealSource-MiMLS
- 2023-03-19 Price Changed $68,900 REALCOMP
- 2022-12-14 Price Changed $74,900 MiRealSource-MiMLS
- 2022-12-13 Price Changed $74,900 REALCOMP
- 2022-11-02 Listed $87,000 MiRealSource-MiMLS
- 2022-11-02 Listed $87,000 REALCOMP
- 2022-10-28 Coming Soon $87,000 MiRealSource-MiMLS
- 2022-10-28 Coming Soon $87,000 REALCOMP
Property tax history
+8.5%/yrLatest (2025): $4,753 · +2.9% YoY. Source: county tax records.
Cash-flow waterfall
monthlySold comps — $/sqft
last 12 mo · ≤1 miLoading sold comps…