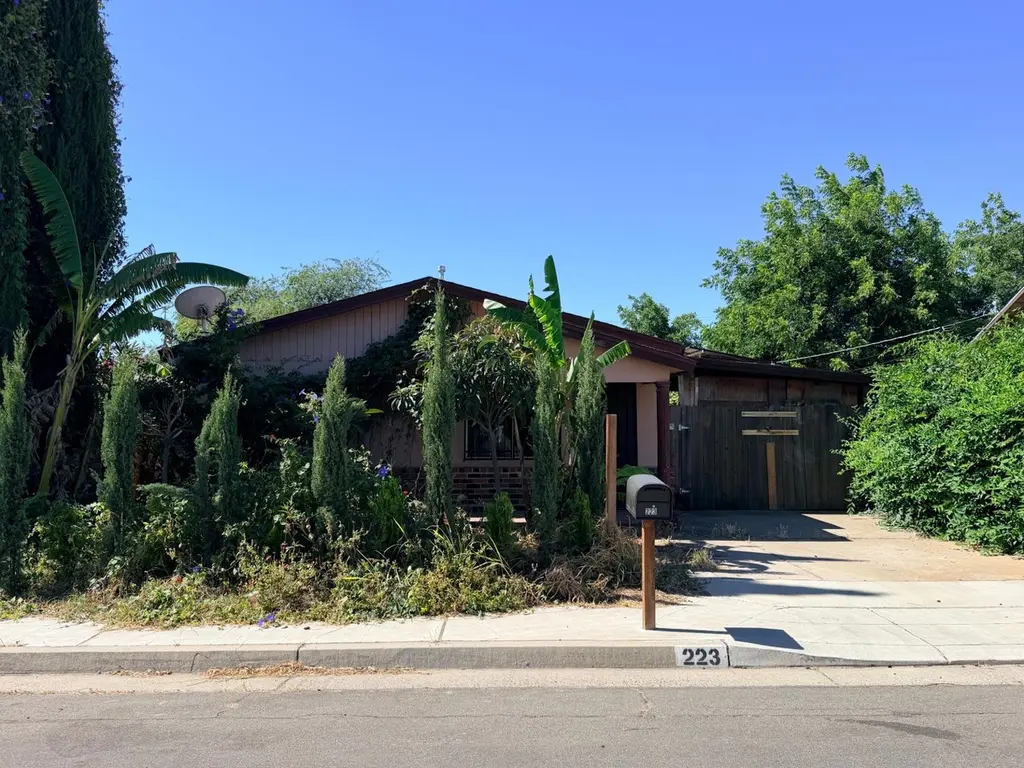
223 W Alluvial Ave · Fresno, CA
Flood risk 1/10 · Minimal
- FEMA flood zone
- X (unshaded)
- Chance of flooding over 30 yrs
- 0.0%
- Est. flood insurance / yr
- $507 – $1,088
Fire risk 6/10 · Moderate
- Est. fire insurance / yr
- $659 – $1,223
Heat risk 8/10 · Major
- Hot days now (above 105°F)
- 7 days/yr
- Hot days in 30 yrs
- 17 days/yr
Wind risk 1/10 · Minimal
- Chance of severe wind over 30 yrs
- —
Air-quality risk 10/10 · Severe
- Unhealthy air days now
- 48 days/yr
- Unhealthy air days in 30 yrs
- 50 days/yr
Risk factors via First Street. Map © Google.
Why this score? — see what drove the B grade
The composite is a weighted blend of 9 inputs, each scored 0–100. Each bar is that input's sub-score; the figure is the points it added to the 100-point composite (weight × sub-score).
- Cash flow +21.6/30.0
- ARV discount +15.0/15.0
- Appreciation +10.0/10.0
- DSCR +6.9/10.0
- Schools +5.9/10.0
- 1% rule +5.0/10.0
- Livability +3.1/5.0
- Rent growth +2.5/5.0
- Condition / age +2.5/5.0
$175,000
🖨 Deal sheet 📄 Offer letter ✓ Due diligence
Listing remarks MLS
Terrific investment property or first time home buyers located within Clovis Unified School District. Easy walking distance to River Park Shopping Center and restaurants. 2 bedrooms 1 bath with open floor plan and large lot with RV parking behind a locked gate.Property sold AS IS.
Key facts
- Near dining
- Near shopping
- As-is probate sale
Tags
Property features AI
Exterior
- Utilities: Electric service is off; Public sewer; Public utilities
- Home design: Single-family residence
- Construction: Stucco exterior; Composition roof; Concrete foundation; Built information from public records
- Exterior features: One-level home; Urban lot; Solar installed
Interior
- Bedrooms: 1 bathroom
- Bathrooms: 1 bathroom
- Heating & cooling: No central cooling
- Interior features: No central cooling; No laundry hookups
- Laundry & utility: No laundry hookups
Neighborhood map
What this means for you Summary
Snapshot
- This is a 2-bed/1.0-bath single-family listed at $175k.
Deal economics
- At list price, monthly cash flow is $265 ($3k/yr) — positive.
- The deal already cash-flows at list — no discount required.
- Meets the 1% rule at list price ($2k rent vs $175k).
- Cap rate 8.1% vs local median 3.7% in Fresno — top-decile yield for the area; either an underpriced asset or a hidden risk that comps aren't pricing in. Stress-test before assuming the spread holds.
Location & tenants
- Location reads 62/100 on livability (#469 in CA) — a middle-class / working-renter tenant base. Strengths: commute A+, housing A+; Watch: amenities D+, employment D+, crime F.
- Clovis Unified (suburban): math 58% / reading 72% proficiency, ranked #152 of 1,400 in CA (top 11%) — acceptable for families but not a draw, mixed tenant base, ~2y average lease.
- Zoned schools: Pinedale Elementary (488 students, 87% FRL); Kastner Intermediate (1,133 students, 56% FRL); Clovis West High (2,089 students, 44% FRL) — zoned schools average 62% FRL vs 32% district-wide (30 pts higher); higher-poverty schools than district average — tighter screening recommended.
- Market conditions: 18 active listings in the ZIP; 4 comparable units currently listed for rent nearby; rentals leasing fast (median 3d on market — plan ~1-2 weeks tenant-placement turnaround); 2,426 units permitted in Fresno County in 2024 (296 in 5+ unit buildings).
Forward outlook
- In year one you build about $19k of equity ($1k loan paydown + $18k appreciation (10.0% local appreciation)).
- Fresno County population projected at +11% by 2050 — modest demand growth; plan on rents tracking national, not racing it.
- At projected returns (10.0% appreciation + 3.0% rent growth), your $49k cash investment doubles in ~3 years — after that, you're playing with house money.
- By year 2, paydown + projected appreciation supports a ~$30k cash-out refi (75% LTV) — recoverable capital for the next deal without selling this one.
Negotiation context
- Only 9 days on market — expect competitive offers; lowballing is unlikely to land.
- 4 sale attempts since 17y ago with the ask held roughly flat each time — persistent listings suggest the price (not the market) is what's stuck; bring a comps-based counter.
- Current owner paid $75k; list at $175k implies a 133% gain — meaningful room to come down on a strong offer.
Risks & watch-outs
- Watch-outs: built in 1946 — expect roof / HVAC / electrical / plumbing capex.
- Climate carrying-cost: major wildfire risk; extreme-heat days projected 7→17/yr by 2055 (HVAC capex compounding) — expect insurance premiums to compound above CPI over the hold.
Questions for the listing agent
- Built in 1946 — when were the roof, HVAC, electrical panel, plumbing, and water heater last replaced?
- Is there a deadline driving the sale (1031 exchange, divorce, estate, relocation)? That informs how much negotiation room exists.
- Schools are D-rated, which usually means shorter tenancies and higher turnover. Who's the typical renter profile here, and what's been the actual vacancy rate?
- Crime grade is F in this area — have there been break-ins, vandalism, or insurance claims at this property in the last 3 years? What carrier currently insures it and at what premium?
- What's the average days-on-market for RENTAL listings here right now (not sales)? A rising rental-DOM trend means longer vacancies and softer asking-rent achievability than the comps imply.
- What's the recent tenant-quality profile in this submarket — average credit score on applications, eviction rate, late-payment / NSF rate, and stable-employment percentage? A property-management company in the area should have these aggregated.
- How much new for-sale + rental construction is in the pipeline within 1–3 miles? Heavy new supply typically softens prices + rents 12–24 months out; constrained supply supports both.
Investment metrics
- 1% rule
- 1.00% ✓
- Cap rate
- 8.11%
- Cash-on-cash
- 6.48%
- DSCR
- 1.29
- GRM
- 8.3
CMA / ARV
- ARV (on-the-fly)
- $258,720
- Comps found
- 2
Show comp detail 2 sales within ~0.75 mi
| Address | Dist | Beds/Ba | Sqft | Sold | Price | $/sf | Match |
|---|---|---|---|---|---|---|---|
| 103 W Alluvial Ave | 0.18mi | 2/1.0 | 650 (-3%) | 1mo | $250,000 | $385 | 85 |
| 447 W Pinedale Ave | 0.30mi | 3/1.0 (+1) | 770 (+15%) | 19mo | $145,000 | $188 | 41 |
Match score weights: distance 35% · size 25% · config 20% · recency 20%. Top-matched comps best support the ARV.
Projected returns pro-forma
10.0% appreciation · 3.0% rent growth · sell at horizon
- IRR
- 29.0%
- Equity multiple
- 3.29×
- Total profit
- $112,146
- Equity at exit
- $157,654
- IRR
- 25.2%
- Equity multiple
- 7.47×
- Total profit
- $316,934
- Equity at exit
- $339,987
Cash invested: $49,000 (down + closing). Projections, not guarantees.
Landlord ↔ Tenant lean methodology
- Overall (STATE)
- 18 Strongly Tenant-Friendly
- State California
- 18 Strongly Tenant-Friendly · D+13
- County
- — inherits STATE
- City
- — inherits STATE
ZIP-level market 93650
- Home prices YoY
- 2.5%
- Active inventory
- 18
- Price-to-rent
- 8.3×
Monthly cashflow live
- Estimated rent
- $1,753 medium interval (Pro) →
- Mortgage (P&I)
- −$918
- Tax from tax record
- −$130 /mo · $1,556/yr
- Insurance
- −$73
- HOA
- −$0
- Vacancy / Maint / Mgmt
- −$368
- Net cashflow
- $265
Break-even live
UW: 25.0% down · 7.5% · 30yr · 1.5% tax · 5.0% vac · 8.0% maint · 8.0% mgmt
Financing live
Cash to close
- Down payment
- $43,750
- Closing costs
- $5,250
- Reserves months
- —
- Total cash needed
- —
Loan-product check · same deal, 3 products live
Conventional
25% down · 7.5% · 30yr
- Down + closing
- —
- Monthly P&I
- —
- Monthly cashflow
- —
- DSCR
- —
- Eligible?
- —
Personal DTI + credit; lowest rate.
DSCR
20% down · 8.5% · 30yr
- Down + closing
- —
- Monthly P&I
- —
- Monthly cashflow
- —
- DSCR
- —
- Eligible?
- —
No personal income docs; deal must DSCR.
Hard money
10% down · 12.0% · 12mo
- Down + closing
- —
- Monthly P&I
- —
- Monthly cashflow
- —
- DSCR
- —
- Eligible?
- —
Short-term bridge; refi at stabilization.
Rent comps 4 comps
| Address | Beds | Baths | Sqft | Rent | $/sqft | DOM | Units | Dist |
|---|---|---|---|---|---|---|---|---|
| 373 W Nees Ave Fresno, CA | 1.0–2.0 | 1.0–2.0 | 867 | $1,855 | $2.14 | 2d | 1 | 0.49mi |
| 445 W Nees Ave Fresno, CA | 1.0–2.0 | 1.0–2.0 | 847 | $1,820 | $2.15 | 1d | 10 | 0.59mi |
| 7722 N Angus St Fresno, CA | 1.0–2.0 | 1.0–2.0 | 820 | $1,575 | $1.92 | 3d | 1 | 0.99mi |
| 7625 N First St Fresno, CA | 1.0–2.0 | 1.0 | 739 | $1,625 | $2.20 | 1d | 2 | 1.15mi |
Listing history 8 events
-
2026-06-18days on market $175,000 Active 9 DOM
-
2026-06-17days on market $175,000 Active 8 DOM
-
2026-06-16days on market $175,000 Active 7 DOM
-
2026-06-15days on market $175,000 Active 6 DOM
-
2026-06-13days on market $175,000 Active 4 DOM
-
2026-06-13days on market $175,000 Active 3 DOM
-
2026-06-10remarks 565-char remark
-
2026-06-10$175,000 Active 1 DOM
ⓘ Source: listings_history table (triggers on properties + properties_extension) + one-shot
backfill from property_details.listing_events for pre-trigger history.
Tax reassessment forecast CA · Resets to sale price
- Current annual tax
- $1,556 · $130/mo
- Projected year-2 tax
- $1,556 · $130/mo
- Expected delta
- $0/yr ($0/mo · -0.0%)
ⓘ Screening estimate from a state-policy table — verify with the county assessor before closing.
Climate risk First Street
- Flood 1/10 Low FEMA zone X (unshaded) · 0% chance over 30 yrs
- Wildfire 6/10 Major
- Heat 8/10 Severe 7 d/yr ≥105°F today · 17 d/yr by 30 yrs out
- Wind 1/10 Low
- Air quality 10/10 Extreme 48 unhealthy d/yr today · 50 by 30 yrs out
Nearby sold comps map
Loading sold comps map…
Walkable amenities ~0.75 mi
Loading nearby amenities…
Taxation est. · year 1
- Rental income
- $21,039
- − Mortgage interest
- −$9,803
- − Property taxes
- −$1,556
- − Insurance
- −$875
- − Repairs & maintenance
- −$1,683
- − Management
- −$1,683
- − Depreciation
- −$5,091
- Taxable income
- $349
- Est. tax owed @ 24.0%
- −$84
- After-tax cash flow
- $3,094/yr
For passive investors: Depreciation is non-cash, so a rental often shows a tax loss while cash-flowing — sheltering income. Rental losses are passive: they offset passive income freely, and up to $25,000/yr can offset ordinary (W-2) income if you actively participate and your MAGI is under $100k (phasing out to $0 by $150k); unused losses carry forward. On sale, claimed depreciation is recaptured at up to 25%, and gains may owe capital-gains tax (a 1031 exchange can defer both). Figures are a year-1 estimate at your 24.0% rate — not tax advice; consult a CPA.
Schools (NCES district)
- District
- Clovis Unified
- NCES district ID
- 0609030
- Math proficiency
- 58% ▲ 1.00%
- Reading proficiency
- 72% ▲ 2.00%
- Median HH income
- $71,950
- Composite
- 58.7/100
- National rank
- #2003
- State rank
- #152 of 1400 in CA
Livability — Fresno
- Score
- 62/100
- State rank
- #469
- US rank
- #15907
Category grades
Schools grade is shown separately in the Schools card above.
Census & demographics
- Census place
- Fresno, CA
- City population
- 593,114
- Population (ZIP)
- 2,969
Population outlook (Fresno County) Hauer SSP2
- Today (2025)
- 1,042,971 people
- By 2030
- 1,072,198 · +2.8%
- By 2040
- 1,122,408 · +7.6%
- By 2050
- 1,157,251 · +11.0%
- By 2075
- 1,182,575 · +13.4%
- By 2100
- 1,105,899 · +6.0%
Race, ethnicity, and origin ACS 2023
- Neighborhood character
- Predominantly Hispanic (77%)
- Race & ethnicity
- Hispanic / Latino 77% Two or more races 33% White 12% Asian 6% Black 3%
- Hispanic origin (detail)
- Mexican 71%
- Common ancestry
- Slovak 3% Romanian 1%
- Foreign-born
- 15% · Canada
- Languages at home
- 52% English-only · Spanish 41% Other Asian/Pacific 4% Other Indo-European 2%
Political lean MEDSL · Fresno
- 2024 margin
- Toss-up / Even · D 46.5% · R 50.9% · Other 2.6%
- 2008→2024 swing
- -6.5pp toward R · 2008: 2.1pp · 2024: -4.4pp
- All cycles
- 2024: R+4.4 2020: D+7.8 2016: D+3.9 2012: R+2.9 2008: D+2.1
Not yet ingested
- Civics
- —
Market trends
- HPI YoY
- ▲ 13.16%
- Current HPI
- 547.5597
- Rent YoY
- —
- Metro
- —
- State GDP YoY
- ▲ 3.21%
- F500 in state
- 116
Industry mix (Fortune 500 HQ in CA)
| Industry | F500 HQs | Revenue |
|---|---|---|
| Technology | 27 | $1,492B |
|
||
| Financial Services | 3 | $174B |
|
||
| Retail | 3 | $44B |
|
||
| Insurance | 3 | $26B |
|
||
| Media / Entertainment | 2 | $115B |
|
||
| Pharmaceuticals / Biotech | 2 | $62B |
|
||
Price history
+133.3% since first listed16 events — show timeline
- 2026-06-09 Listed $175,000 FRESNOMLS
- 2015-01-21 Price Changed $75,000 FRESNOMLS
- 2015-01-16 Sold (Public Records) $75,000 Public Records
- 2015-01-15 Sold (MLS) $75,000 FRESNOMLS
- 2014-12-09 Pending — FRESNOMLS
- 2014-12-08 Price Changed $79,900 FRESNOMLS
- 2014-11-28 Relisted — FRESNOMLS
- 2014-11-28 Price Changed $79,900 FRESNOMLS
- 2014-10-11 Pending — FRESNOMLS
- 2014-10-06 Listed $89,000 FRESNOMLS
- 2013-07-19 Sold (Public Records) $60,000 Public Records
- 2009-11-03 Sold (Public Records) $75,000 Public Records
- 2009-11-03 Sold (MLS) $75,000 FRESNOMLS
- 2009-10-12 Delisted — FRESNOMLS
- 2009-10-12 Price Changed $87,000 FRESNOMLS
- 2009-09-09 Listed $75,000 FRESNOMLS
Property tax history
+7.0%/yrLatest (2025): $1,556 · +0.5% YoY. Source: county tax records.
Cash-flow waterfall
monthlySold comps — $/sqft
last 12 mo · ≤1 miLoading sold comps…