None · North Brooksville, FL
Flood risk 1/10 · Minimal
- FEMA flood zone
- X (unshaded)
- Chance of flooding over 30 yrs
- 0.0%
- Est. flood insurance / yr
- $507 – $1,088
Fire risk 7/10 · Major
- Est. fire insurance / yr
- $947 – $1,759
Heat risk 8/10 · Major
- Hot days now (above 109°F)
- 4 days/yr
- Hot days in 30 yrs
- 12 days/yr
Wind risk 9/10 · Severe
- Chance of severe wind over 30 yrs
- 99.0%
Air-quality risk 1/10 · Minimal
- Unhealthy air days now
- 0 days/yr
- Unhealthy air days in 30 yrs
- 0 days/yr
Risk factors via First Street. Map © Google.
Why this score? — see what drove the B grade
The composite is a weighted blend of 9 inputs, each scored 0–100. Each bar is that input's sub-score; the figure is the points it added to the 100-point composite (weight × sub-score).
- Cash flow +30.0/30.0
- 1% rule +10.0/10.0
- DSCR +10.0/10.0
- ARV discount +7.5/15.0
- Schools +4.2/10.0
- Livability +3.2/5.0
- Rent growth +2.5/5.0
- Condition / age +2.5/5.0
- Appreciation +0.0/10.0
$79,900
🖨 Deal sheet (PDF) 📄 Offer letter ✓ Due diligence
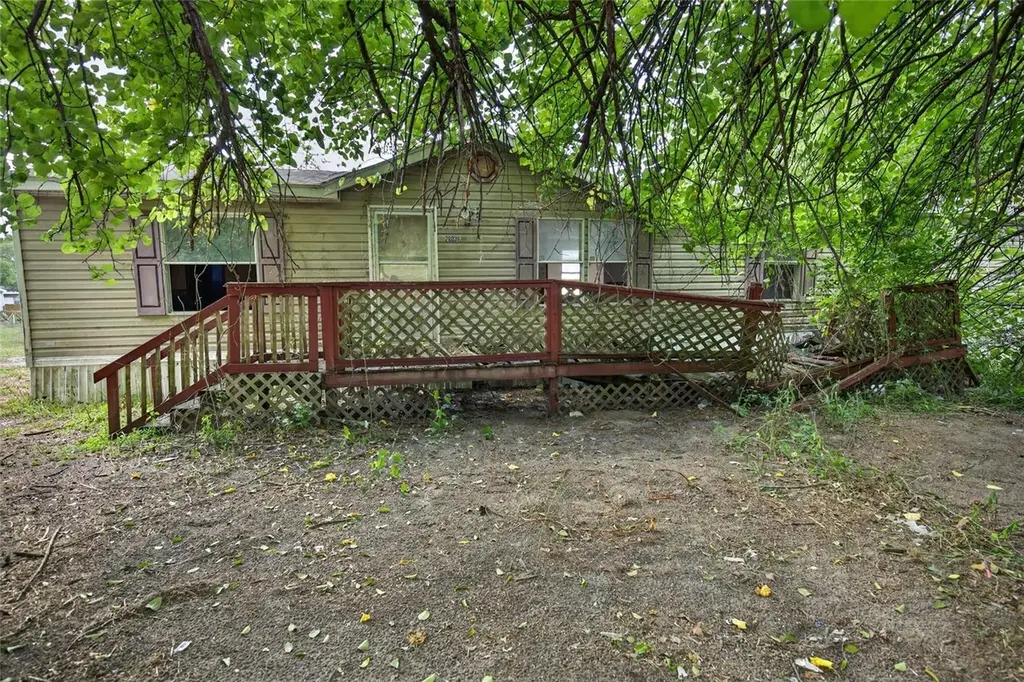
Listing remarks
Under contract-accepting backup offers. HANDYMAN SPECIAL! Don’t miss this opportunity to transform this property into your next investment, rental, or renovation project. Situated on a quarter-acre lot in Brooksville with NO HOA, this property offers the freedom and space that investors and project buyers are looking for. The existing mobile home is in need of a complete remodel, making this an ideal opportunity for someone ready to bring their vision and creativity to life. With plenty of room on the property for outdoor improvements, parking, storage, or additional features, the potential here is substantial. Located in Brooksville, you’ll enjoy a peaceful setting while still
Key facts
- Complete remodel
- Peaceful setting
- No hoa
Tags
Property features AI
Finance
- Other: Lot approximately 0.25 acre (1/4 to less than 1/2 acre); Paved road access
- Financial info: No additional financial details listed
- HOA & community: No HOA
Exterior
- Parking: No parking details listed
- Security: No security features listed
- Utilities: Well water; Septic tank sewer; Electricity available
- Home design: Manufactured double-wide home; Residential property; One story; North-facing
- Construction: Vinyl siding; Shingle roof; Crawlspace foundation
- Exterior features: Front porch; Rear porch; Exterior lighting
Interior
- Kitchen: No appliances listed
- Bedrooms: 4 bedrooms
- Flooring: Other flooring
- Bathrooms: 2 full bathrooms
- Heating & cooling: Central heating; Central air conditioning
- Interior features: No interior features listed
- Laundry & utility: No laundry features
Neighborhood map
What this means for you Summary
Snapshot
- This is a 4-bed/2.0-bath manufactured listed at $80k.
Deal economics
- At list price, monthly cash flow is $884 ($11k/yr) — positive.
- The deal already cash-flows at list — no discount required.
- Meets the 1% rule at list price ($2k rent vs $80k).
- Cap rate 19.6% vs local median 2.6% in North Brooksville — top-decile yield for the area; either an underpriced asset or a hidden risk that comps aren't pricing in. Stress-test before assuming the spread holds.
Location & tenants
- Location reads 65/100 on livability (#661 in FL) — a middle-class / working-renter tenant base. Strengths: crime A+, cost of living A+, housing A+; Watch: health & safety C-, employment D, schools F.
- Hernando (suburban): math 50% / reading 50% proficiency, ranked #38 of 73 in FL (top 52%) — acceptable for families but not a draw, mixed tenant base, ~2y average lease.
- Market conditions: Rents flat; 498 active listings in the ZIP; 2,505 units permitted in Hernando County in 2024 (318 in 5+ unit buildings).
- This rent runs 37% of the median local income ($60k/yr) — at the standard rent-burdened threshold; future hikes will face affordability resistance.
Forward outlook
- Local home prices are declining (-3.0%/yr); year-one equity from $552 of loan paydown is wiped out by about $2k of value loss. Plan a longer hold.
- Hernando County population projected at +11% by 2050 — modest demand growth; plan on rents tracking national, not racing it.
- At projected returns (-3.0% appreciation + 0.2% rent growth), your $22k cash investment doubles in ~3 years — after that, you're playing with house money.
Negotiation context
- Only 6 days on market — expect competitive offers; lowballing is unlikely to land.
- 8 sale attempts since 19y ago; this cycle's ask has dropped $10k (11%) from the opening price — seller is motivated, your offer sets the floor, not the list.
- Current owner paid $20k; list at $80k implies a 298% gain — meaningful room to come down on a strong offer.
Risks & watch-outs
- Climate carrying-cost: severe wind risk, 99% chance of damaging wind over 30y; major wildfire risk; extreme-heat days projected 4→12/yr by 2055 (HVAC capex compounding) — expect insurance premiums to compound above CPI over the hold.
Questions for the listing agent
- Is there a deadline driving the sale (1031 exchange, divorce, estate, relocation)? That informs how much negotiation room exists.
- Schools are F-rated, which usually means shorter tenancies and higher turnover. Who's the typical renter profile here, and what's been the actual vacancy rate?
- What's the average days-on-market for RENTAL listings here right now (not sales)? A rising rental-DOM trend means longer vacancies and softer asking-rent achievability than the comps imply.
- What's the recent tenant-quality profile in this submarket — average credit score on applications, eviction rate, late-payment / NSF rate, and stable-employment percentage? A property-management company in the area should have these aggregated.
- How much new for-sale + rental construction is in the pipeline within 1–3 miles? Heavy new supply typically softens prices + rents 12–24 months out; constrained supply supports both.
Investment metrics
- 1% rule
- 2.35% ✓
- Cap rate
- 19.57%
- Cash-on-cash
- 47.41%
- DSCR
- 3.11
- GRM
- 3.5
CMA / ARV
- ARV (on-the-fly)
- $190,080
- Comps found
- 4
Show comp detail 4 sales within ~0.75 mi
| Address | Dist | Beds/Ba | Sqft | Sold | Price | $/sf | Match |
|---|---|---|---|---|---|---|---|
| 26005 Hebron | 0.11mi | 3/2.0 (-1) | 1,352 (+2%) | 7mo | $195,000 | $144 | 80 |
| 25492 Hebron St | 0.12mi | 3/1.0 (-1) | 1,150 (-13%) | 2mo | $48,000 | $42 | 63 |
| 26043 Shan St | 0.15mi | 3/2.0 (-1) | 1,512 (+14%) | 12mo | $162,000 | $107 | 54 |
| 25251 Richbarn Rd | 0.65mi | 3/2.0 (-1) | 1,360 (+3%) | 10mo | $358,000 | $263 | 51 |
Match score weights: distance 35% · size 25% · config 20% · recency 20%. Top-matched comps best support the ARV.
Projected returns pro-forma
-3.0% appreciation · 0.19% rent growth · sell at horizon
- IRR
- 41.5%
- Equity multiple
- 2.71×
- Total profit
- $38,240
- Equity at exit
- $11,913
- IRR
- 46.3%
- Equity multiple
- 4.84×
- Total profit
- $85,999
- Equity at exit
- $6,908
Cash invested: $22,372 (down + closing). Projections, not guarantees.
Landlord ↔ Tenant lean methodology
- Overall (STATE)
- 87 Strongly Landlord-Friendly
- State Florida
- 87 Strongly Landlord-Friendly · R+3
- County
- — inherits STATE
- City
- — inherits STATE
ZIP-level market 34601
- Home prices YoY
- -29.7%
- Rents YoY
- 0.2%
- Active inventory
- 498
- Price-to-rent
- 3.5×
Monthly cashflow live
- Estimated rent
- $1,876 medium interval (Pro) →
- Mortgage (P&I)
- −$419
- Tax from tax record
- −$146 /mo · $1,749/yr
- Insurance
- −$33
- HOA
- −$0
- Vacancy / Maint / Mgmt
- −$394
- Net cashflow
- $884
Break-even live
Sensitivity live
| Price | -10% $929 | -5% $906 | +0% $884 | +5% $861 | +10% $839 |
|---|---|---|---|---|---|
| Rent | -10% $736 | -5% $810 | +0% $884 | +5% $958 | +10% $1,032 |
| Rate | -1.0pp $924 | -0.5pp $904 | base $884 | +0.5pp $863 | +1.0pp $842 |
UW: 25.0% down · 7.5% · 30yr · 1.5% tax · 5.0% vac · 8.0% maint · 8.0% mgmt
Financing live
Cash to close
- Down payment
- $19,975
- Closing costs
- $2,397
- Reserves months
- —
- Total cash needed
- —
Loan-product check · same deal, 3 products live
Conventional
25% down · 7.5% · 30yr
- Down + closing
- —
- Monthly P&I
- —
- Monthly cashflow
- —
- DSCR
- —
- Eligible?
- —
Personal DTI + credit; lowest rate.
DSCR
20% down · 8.5% · 30yr
- Down + closing
- —
- Monthly P&I
- —
- Monthly cashflow
- —
- DSCR
- —
- Eligible?
- —
No personal income docs; deal must DSCR.
Hard money
10% down · 12.0% · 12mo
- Down + closing
- —
- Monthly P&I
- —
- Monthly cashflow
- —
- DSCR
- —
- Eligible?
- —
Short-term bridge; refi at stabilization.
Listing history 19 events
-
2026-06-10status $79,900 Pending 6 DOM
-
2026-06-09days on market $79,900 Active 6 DOM
-
2026-06-08days on market $79,900 Active 5 DOM
-
2026-06-07pricestatusdays on market $79,900 Active 4 DOM
-
2026-05-26$89,997 Active
-
2019-11-11historical
-
2019-11-11historical
-
2019-11-11historical
-
2011-12-19soldstatus $20,100
-
2011-12-19soldstatus $20,100
-
2011-08-01$24,900
-
2011-07-01$27,500
-
2010-04-16$55,000
-
2008-12-31historical
-
2008-06-05$68,860
-
2008-06-05$68,860
-
2008-05-25historical
-
2007-12-02$89,800
-
2007-11-27$79,900
ⓘ Source: listings_history table (triggers on properties + properties_extension) + one-shot
backfill from property_details.listing_events for pre-trigger history.
Tax reassessment forecast FL · Resets to sale price
- Current annual tax
- $1,749 · $146/mo
- Projected year-2 tax
- $1,749 · $146/mo
- Expected delta
- $0/yr ($0/mo · 0.0%)
ⓘ Screening estimate from a state-policy table — verify with the county assessor before closing.
Climate risk First Street
- Flood 1/10 Low FEMA zone X (unshaded) · 0% chance over 30 yrs
- Wildfire 7/10 Severe
- Heat 8/10 Severe 4 d/yr ≥109°F today · 12 d/yr by 30 yrs out
- Wind 9/10 Extreme 99% chance of damaging wind over 30 yrs
- Air quality 1/10 Low 0 unhealthy d/yr today · 0 by 30 yrs out
Nearby sold comps map
Loading sold comps map…
Walkable amenities ~0.75 mi
Loading nearby amenities…
Taxation est. · year 1
- Rental income
- $22,509
- − Mortgage interest
- −$4,476
- − Property taxes
- −$1,749
- − Insurance
- −$400
- − Repairs & maintenance
- −$1,801
- − Management
- −$1,801
- − Depreciation
- −$2,324
- Taxable income
- $9,959
- Est. tax owed @ 24.0%
- −$2,390
- After-tax cash flow
- $8,215/yr
For passive investors: Depreciation is non-cash, so a rental often shows a tax loss while cash-flowing — sheltering income. Rental losses are passive: they offset passive income freely, and up to $25,000/yr can offset ordinary (W-2) income if you actively participate and your MAGI is under $100k (phasing out to $0 by $150k); unused losses carry forward. On sale, claimed depreciation is recaptured at up to 25%, and gains may owe capital-gains tax (a 1031 exchange can defer both). Figures are a year-1 estimate at your 24.0% rate — not tax advice; consult a CPA.
Schools (NCES district)
- District
- Hernando
- NCES district ID
- 1200810
- Math proficiency
- 50% ▼ -8.00%
- Reading proficiency
- 50% ▼ -4.00%
- Median HH income
- $41,985
- Composite
- 42.03/100
- National rank
- #3329
- State rank
- #38 of 73 in FL
Livability — North Brooksville
- Score
- 65/100
- State rank
- #661
- US rank
- #13315
Category grades
Schools grade is shown separately in the Schools card above.
Census & demographics
- County
- Hernando County · 169,677 people
- City population
- 23,648
- Metro
- Tampa-St. Petersburg-Clearwater, FL
- Population (ZIP)
- 24,115
- Household income
- $60,440
- Rent vs Own
- Severe rent burden
- 664.0
Population outlook (Hernando County) Hauer SSP2
- Today (2025)
- 189,218 people
- By 2030
- 194,367 · +2.7%
- By 2040
- 203,398 · +7.5%
- By 2050
- 209,589 · +10.8%
- By 2075
- 218,452 · +15.4%
- By 2100
- 205,923 · +8.8%
Race, ethnicity, and origin ACS 2023
- Neighborhood character
- Predominantly White (77%)
- Race & ethnicity
- White 77% Hispanic / Latino 11% Black 8% Two or more races 5%
- Hispanic origin (detail)
- Puerto Rican 4% Cuban 2% Dominican 1%
- Common ancestry
- Slovak 4% Romanian 2% Iranian 2%
- Foreign-born
- 4% · Canada, Jamaica
- Languages at home
- 93% English-only · Spanish 6%
Political lean MEDSL · Hernando
- 2024 margin
- Solid R (+37.0) · D 31.1% · R 68.2%
- 2008→2024 swing
- -33.5pp toward R · 2008: -3.6pp · 2024: -37.0pp
- All cycles
- 2024: R+37.0 2020: R+30.2 2016: R+29.0 2012: R+8.5 2008: R+3.6
Not yet ingested
- Civics
- —
Market trends
- HPI YoY
- ▼ -132.68%
- Current HPI
- 313.4695
- Rent YoY
- ▲ 0.19%
- Metro
- Tampa-St. Petersburg-Clearwater, FL
- State GDP YoY
- ▲ 3.28%
- F500 in state
- 36
Industry mix (Fortune 500 HQ in FL)
| Industry | F500 HQs | Revenue |
|---|---|---|
| Industrial Technology | 2 | $29B |
|
||
| Insurance | 2 | $17B |
|
||
| Retail | 1 | $60B |
|
||
| Technology Distribution | 1 | $58B |
|
||
| Homebuilding | 1 | $35B |
|
||
| Technology Manufacturing | 1 | $35B |
|
||
Price history
+12.6% since first listed15 events — show timeline
- 2026-05-26 Listed $89,997 Stellar MLS as Distributed by MLS Grid
- 2019-11-11 Listing Removed — HCAR
- 2019-11-11 Listing Removed — HCAR
- 2019-11-11 Listing Removed — HCAR
- 2011-12-19 Sold (MLS) $20,100 Stellar MLS as Distributed by MLS Grid
- 2011-12-19 Sold (MLS) $20,100 HCAR
- 2011-08-01 Listed $24,900 Stellar MLS as Distributed by MLS Grid
- 2011-07-01 Listed $27,500 HCAR
- 2010-04-16 Listed $55,000 HCAR
- 2008-12-31 Listing Removed — Stellar MLS as Distributed by MLS Grid
- 2008-06-05 Listed $68,860 Stellar MLS as Distributed by MLS Grid
- 2008-06-05 Listed $68,860 HCAR
- 2008-05-25 Listing Removed — Stellar MLS as Distributed by MLS Grid
- 2007-12-02 Listed $89,800 Stellar MLS as Distributed by MLS Grid
- 2007-11-27 Listed $79,900 HCAR
Property tax history
+12.5%/yrLatest (2025): $1,749 · +2.6% YoY. Source: county tax records.
Cash-flow waterfall
monthlySold comps — $/sqft
last 12 mo · ≤1 miLoading sold comps…