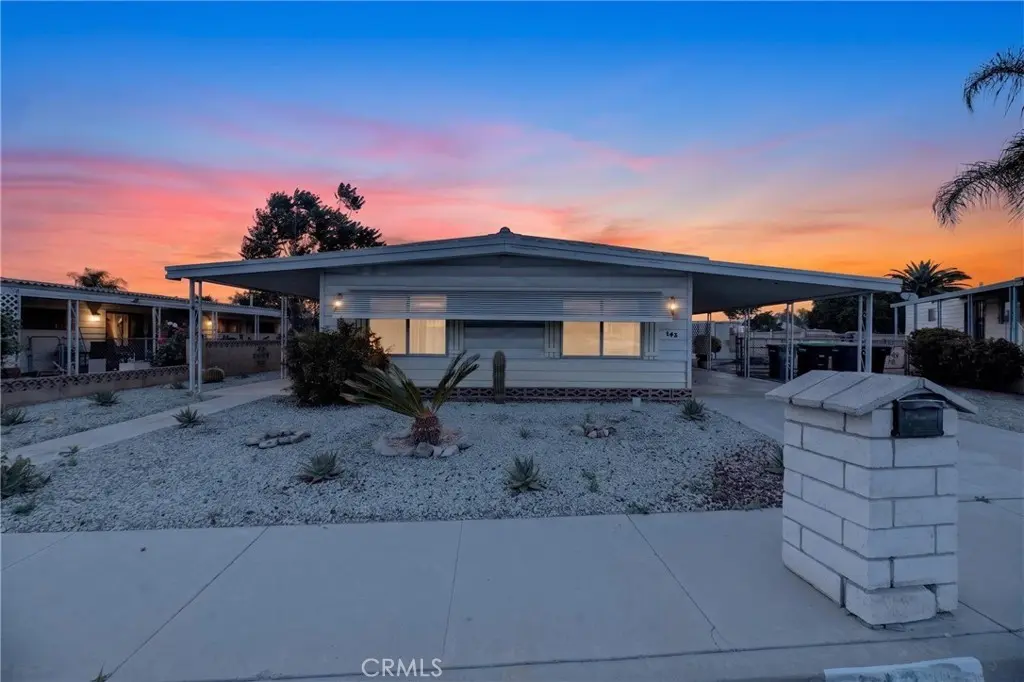
143 Palomar · San Jacinto, CA
Flood risk 1/10 · Minimal
- FEMA flood zone
- X
- Chance of flooding over 30 yrs
- 0.0%
- Est. flood insurance / yr
- $507 – $1,088
Fire risk 7/10 · Major
- Est. fire insurance / yr
- $659 – $1,223
Heat risk 8/10 · Major
- Hot days now (above 103°F)
- 7 days/yr
- Hot days in 30 yrs
- 20 days/yr
Wind risk 1/10 · Minimal
- Chance of severe wind over 30 yrs
- —
Air-quality risk 6/10 · Moderate
- Unhealthy air days now
- 12 days/yr
- Unhealthy air days in 30 yrs
- 14 days/yr
Risk factors via First Street. Map © Google.
Why this score? — see what drove the A- grade
The composite is a weighted blend of 9 inputs, each scored 0–100. Each bar is that input's sub-score; the figure is the points it added to the 100-point composite (weight × sub-score).
- Cash flow +29.0/30.0
- ARV discount +15.0/15.0
- DSCR +10.0/10.0
- Appreciation +10.0/10.0
- 1% rule +7.0/10.0
- Livability +3.2/5.0
- Rent growth +2.5/5.0
- Condition / age +2.5/5.0
- Schools +2.1/10.0
$189,000
🖨 Deal sheet (PDF) 📄 Offer letter ✓ Due diligence
Listing remarks
Welcome to 143 Palomar Ave located in the desirable 55+ Cottonwood Estates community, where you own the land and enjoy an incredibly low HOA of just $50 annually. Nestled in a quiet cul-de-sac and situated on one of the larger lots in the neighborhood, this home offers added privacy, space, and minimal through traffic. This well-maintained manufactured home offers a spacious and functional layout with 2 bedrooms, 2 bathrooms, and approximately 1,440 square feet of comfortable living space. Inside, you’ll find generous living areas filled with natural light, creating a warm and inviting atmosphere throughout the home, complemented by freshly installed carpet throughout for a clean, mov
Key facts
- Added privacy
- Quiet cul-de-sac
- Larger lots
Tags
Property features AI
Finance
- HOA & community: Part of Cottonwood Estates association; Association fee of $50 annually; Pets permitted; Senior community; Community features include curbs, street lighting, and sidewalks
Exterior
- Parking: Two uncovered spaces; Two carport spaces (attached carport); Driveway parking; RV access/parking and RV potential; Total of four parking spaces
- Utilities: Public sewer; Private water
- Home design: Manufactured home; Single-story; Has a view; No accessory dwelling unit
- Construction: Year built reported by assessor
- Exterior features: Located on a cul-de-sac; 0-1 unit per acre; No pool
Interior
- Kitchen: Microwave; Refrigerator; Gas oven; Dishwasher
- Bedrooms: Two main-level bedrooms
- Flooring: Carpet
- Bathrooms: Two full bathrooms
- Heating & cooling: Central cooling; Central furnace heating
- Interior features: One-level home with main-level entry through a door; Living room; Formal dining area; In-kitchen eating area; Soaking tub and walk-in shower in bathrooms; No common walls (detached)
- Laundry & utility: Inside laundry
Neighborhood map
What this means for you Summary
Snapshot
- This is a 2-bed/2.0-bath manufactured listed at $189k.
Deal economics
- At list price, monthly cash flow is $645 ($8k/yr) — positive.
- The deal already cash-flows at list — no discount required.
- Meets the 1% rule at list price ($2k rent vs $189k).
- Recommended offer: $183k (3.0% below list) — sets the bar for market timing.
- Cap rate 10.4% vs local median 3.8% in San Jacinto — top-decile yield for the area; either an underpriced asset or a hidden risk that comps aren't pricing in. Stress-test before assuming the spread holds.
Location & tenants
- Location reads 63/100 on livability (#467 in CA) — a middle-class / working-renter tenant base. Strengths: housing A+; Watch: employment D+, amenities F, cost of living F.
- San Jacinto Unified (suburban): math 13% / reading 36% proficiency, ranked #421 of 517 in CA (top 81%) — low school quality limits family demand, transient renter base, plan for 1-2y turnover; 68% free/reduced lunch — lower-income household profile, screen leases tightly.
- Zoned schools: De Anza Elementary (math 24% / reading 24%, grade F, #973 of 1,571 statewide, top 73%, 677 students, 83% FRL); Monte Vista Middle (math 24% / reading 24%, grade F, #277 of 498 statewide, top 73%, 913 students, 87% FRL); San Jacinto High (math 14% / reading 38%, grade F, #807 of 1,170 statewide, top 69%, 2,617 students, 85% FRL) — zoned schools average 85% FRL vs 68% district-wide (18 pts higher); higher-poverty schools than district average — tighter screening recommended.
- Market conditions: 124 active listings in the ZIP; 28 comparable units currently listed for rent nearby; rentals at typical pace (median 26d on market — plan ~3-4 weeks tenant-placement turnaround); 9,195 units permitted in Riverside County in 2024 (1,512 in 5+ unit buildings).
Forward outlook
- In year one you build about $20k of equity ($1k loan paydown + $19k appreciation (10.0% local appreciation)).
- Riverside County population projected at +22% by 2050 — long-run rental-demand tailwind backs the buy-and-hold thesis.
- At projected returns (10.0% appreciation + 3.0% rent growth), your $53k cash investment doubles in ~2 years — after that, you're playing with house money.
- By year 2, paydown + projected appreciation supports a ~$32k cash-out refi (75% LTV) — recoverable capital for the next deal without selling this one.
Negotiation context
- It's been on market 32 days — a 3% lower offer ($183k) is reasonable based on typical stale-listing flexibility.
Risks & watch-outs
- Climate carrying-cost: major wildfire risk; extreme-heat days projected 7→20/yr by 2055 (HVAC capex compounding) — expect insurance premiums to compound above CPI over the hold.
Questions for the listing agent
- It's been on market 32 days. Have you received any prior offers? Is the seller open to a 3% concession, seller financing, or rate buy-down credit?
- Built in 1974 — when were the roof, HVAC, electrical panel, plumbing, and water heater last replaced?
- What does the HOA fee cover, when was the last increase, and are there any pending special assessments or reserve-fund shortfalls?
- Is there a deadline driving the sale (1031 exchange, divorce, estate, relocation)? That informs how much negotiation room exists.
- Schools are D-rated, which usually means shorter tenancies and higher turnover. Who's the typical renter profile here, and what's been the actual vacancy rate?
- What's the average days-on-market for RENTAL listings here right now (not sales)? A rising rental-DOM trend means longer vacancies and softer asking-rent achievability than the comps imply.
- What's the recent tenant-quality profile in this submarket — average credit score on applications, eviction rate, late-payment / NSF rate, and stable-employment percentage? A property-management company in the area should have these aggregated.
- How much new for-sale + rental construction is in the pipeline within 1–3 miles? Heavy new supply typically softens prices + rents 12–24 months out; constrained supply supports both.
Investment metrics
- 1% rule
- 1.20% ✓
- Cap rate
- 10.39%
- Cash-on-cash
- 14.63%
- DSCR
- 1.65
- GRM
- 6.9
CMA / ARV
- ARV (on-the-fly)
- $318,240
- Comps found
- 12
Show comp detail 12 sales within ~0.75 mi
| Address | Dist | Beds/Ba | Sqft | Sold | Price | $/sf | Match |
|---|---|---|---|---|---|---|---|
| 204 N La Paloma Ave | 0.07mi | 2/2.0 | 1,440 (0%) | 6mo | $224,000 | $156 | 92 |
| 927 Marcy | 0.38mi | 3/2.0 (+1) | 1,500 (+4%) | 3mo | $402,900 | $269 | 68 |
| 207 Flora Vista St | 0.27mi | 3/2.0 (+1) | 1,340 (-7%) | 17mo | $229,850 | $172 | 57 |
| 350 Potrero St | 0.29mi | 2/2.0 | 1,344 (-7%) | 24mo | $227,000 | $169 | 56 |
| 253 N Palomar Ave | 0.14mi | 2/2.0 | 1,248 (-13%) | 22mo | $250,000 | $200 | 53 |
| 562 Potrero St | 0.42mi | 2/2.0 | 1,344 (-7%) | 23mo | $195,000 | $145 | 50 |
| 770 Porterfield Dr | 0.52mi | 3/2.0 (+1) | 1,554 (+8%) | 10mo | $390,000 | $251 | 50 |
| 328 Pepperwood St | 0.69mi | 2/2.0 | 1,344 (-7%) | 8mo | $318,000 | $237 | 50 |
| 750 Porterfield Dr | 0.50mi | 2/2.0 | 1,344 (-7%) | 22mo | $314,000 | $234 | 48 |
| 222 Lori Ann St | 0.61mi | 3/2.0 (+1) | 1,350 (-6%) | 11mo | $299,000 | $221 | 47 |
| 242 Lori Ann St | 0.62mi | 2/2.0 | 1,344 (-7%) | 22mo | $345,000 | $257 | 42 |
| 913 S Grand Ave #155 | 0.73mi | 3/2.0 (+1) | 1,344 (-7%) | 22mo | $145,000 | $108 | 32 |
Match score weights: distance 35% · size 25% · config 20% · recency 20%. Top-matched comps best support the ARV.
Projected returns pro-forma
10.0% appreciation · 3.0% rent growth · sell at horizon
- IRR
- 35.1%
- Equity multiple
- 3.72×
- Total profit
- $143,958
- Equity at exit
- $170,266
- IRR
- 30.2%
- Equity multiple
- 8.40×
- Total profit
- $391,500
- Equity at exit
- $367,185
Cash invested: $52,920 (down + closing). Projections, not guarantees.
Landlord ↔ Tenant lean methodology
- Overall (STATE)
- 18 Strongly Tenant-Friendly
- State California
- 18 Strongly Tenant-Friendly · D+13
- County
- — inherits STATE
- City
- — inherits STATE
ZIP-level market 92582
- Home prices YoY
- 7.1%
- Active inventory
- 124
- Price-to-rent
- 6.9×
Monthly cashflow live
- Estimated rent
- $2,272 high interval (Pro) →
- Mortgage (P&I)
- −$991
- Tax from tax record
- −$76 /mo · $906/yr
- Insurance
- −$79
- HOA
- −$4
- Vacancy / Maint / Mgmt
- −$477
- Net cashflow
- $645
Break-even live
Sensitivity live
| Price | -10% $752 | -5% $699 | +0% $645 | +5% $592 | +10% $538 |
|---|---|---|---|---|---|
| Rent | -10% $466 | -5% $555 | +0% $645 | +5% $735 | +10% $825 |
| Rate | -1.0pp $740 | -0.5pp $693 | base $645 | +0.5pp $596 | +1.0pp $546 |
UW: 25.0% down · 7.5% · 30yr · 1.5% tax · 5.0% vac · 8.0% maint · 8.0% mgmt
Financing live
Cash to close
- Down payment
- $47,250
- Closing costs
- $5,670
- Reserves months
- —
- Total cash needed
- —
Loan-product check · same deal, 3 products live
Conventional
25% down · 7.5% · 30yr
- Down + closing
- —
- Monthly P&I
- —
- Monthly cashflow
- —
- DSCR
- —
- Eligible?
- —
Personal DTI + credit; lowest rate.
DSCR
20% down · 8.5% · 30yr
- Down + closing
- —
- Monthly P&I
- —
- Monthly cashflow
- —
- DSCR
- —
- Eligible?
- —
No personal income docs; deal must DSCR.
Hard money
10% down · 12.0% · 12mo
- Down + closing
- —
- Monthly P&I
- —
- Monthly cashflow
- —
- DSCR
- —
- Eligible?
- —
Short-term bridge; refi at stabilization.
Rent comps 28 comps
| Address | Beds | Baths | Sqft | Rent | $/sqft | DOM | Units | Dist |
|---|---|---|---|---|---|---|---|---|
| 148 N Palomar Ave San Jacinto, CA | 2.0 | 2.0 | 1368 | $1,152 | $0.84 | 26d | 1 | 0.05mi |
| 419 Angela Way San Jacinto, CA | 3.0 | 1.0 | 988 | $2,150 | $2.18 | 16d | 1 | 0.36mi |
| 1066 Birch Ln San Jacinto, CA | 3.0 | 2.0 | 1785 | $2,600 | $1.46 | 6d | 1 | 0.41mi |
| 165 Tiger Ln San Jacinto, CA | 2.0 | 2.0 | 1339 | $2,150 | $1.61 | 4d | 1 | 0.47mi |
| 1106 Don Carlos Ct San Jacinto, CA | 3.0 | 2.0 | 1389 | $2,999 | $2.16 | 45d | 1 | 0.50mi |
| 289 Brown St San Jacinto, CA | 2.0 | 1.0 | 1400 | $2,300 | $1.64 | 45d | 1 | 0.62mi |
| 1410 Cottonwood Ave San Jacinto, CA | 2.0 | 1.5 | 1257 | $2,300 | $1.83 | 45d | 1 | 0.74mi |
| 249 Idyllwild Dr San Jacinto, CA | 3.0 | 2.0 | 1025 | $2,300 | $2.24 | 45d | 1 | 0.77mi |
| 1311 Heritage Ranch Rd San Jacinto, CA | 2.0 | 1.5 | 900 | $1,750 | $1.94 | 45d | 1 | 1.05mi |
| 1559 Park Meadows Dr San Jacinto, CA | 3.0 | 2.0 | 1644 | $2,675 | $1.63 | 45d | 1 | 1.07mi |
| 1318 Bushy Tail Trl San Jacinto, CA | 2.0 | 2.0 | 1040 | $1,750 | $1.68 | 26d | 1 | 1.10mi |
| 1344 Sierra Seneca Dr San Jacinto, CA | 2.0 | 2.0 | 1100 | $2,000 | $1.82 | 6d | 1 | 1.12mi |
| 344 E 6th St San Jacinto, CA | 2.0 | 1.0 | 900 | $1,900 | $2.11 | 26d | 1 | 1.16mi |
| 1397 Bushy Tail Trl San Jacinto, CA | 2.0 | 2.0 | 937 | $1,795 | $1.92 | 45d | 1 | 1.18mi |
| N Santa Fe St GLMN HOT SPGS, CA | 2.0–3.0 | 2.0 | 1053 | $2,350 | $2.23 | 0d | 2 | 1.26mi |
| 748 Minor St Apt F San Jacinto, CA | 2.0 | 1.0 | 878 | $1,600 | $1.82 | 45d | 1 | 1.33mi |
| 700 Minor St San Jacinto, CA | 2.0 | 1.0 | 878 | $1,700 | $1.94 | 26d | 1 | 1.33mi |
| 700 Minor St San Jacinto, CA | 2.0 | 1.0 | 878 | $1,600 | $1.82 | 45d | 1 | 1.33mi |
| 784 Minor St Unit B San Jacinto, CA | 2.0 | 1.0 | 878 | $1,700 | $1.94 | 26d | 1 | 1.34mi |
| 621 S Mistletoe Ave San Jacinto, CA | 2.0 | 2.0 | 1500 | $2,000 | $1.33 | 45d | 1 | 1.36mi |
| 1569 Willowcreek Loop San Jacinto, CA | 2.0 | 1.5 | 921 | $2,100 | $2.28 | 26d | 1 | 1.36mi |
| 1555 S Santa Fe Ave San Jacinto, CA | 3.0 | 2.0 | 1161 | $2,300 | $1.98 | 26d | 1 | 1.37mi |
| 800 Minor St San Jacinto, CA | 2.0 | 1.0 | 878 | $1,600 | $1.82 | 0d | 1 | 1.37mi |
| 646 Field Maple Pl GLMN HOT SPGS, CA | 3.0–4.0 | 2.0–3.0 | 1825 | $2,850 | $1.56 | 0d | 9 | 1.38mi |
| 795 Minor St Unit A San Jacinto, CA | 2.0 | 1.0 | 878 | $1,700 | $1.94 | 26d | 1 | 1.43mi |
| 492 Foursquare Pl San Jacinto, CA | 3.0 | 2.0 | 1573 | $3,500 | $2.23 | 0d | 1 | 1.44mi |
| 620 E Main St San Jacinto, CA | 2.0 | 2.0 | 900 | $1,600 | $1.78 | 26d | 1 | 1.46mi |
| 1775 S Santa Fe Ave San Jacinto, CA | 3.0 | 2.0 | 1300 | $2,850 | $2.19 | 0d | 1 | 1.48mi |
HOA detail
- Monthly dues
- $4 · $48/yr
Listing history 16 events
-
2026-06-21days on market $189,000 Active 32 DOM
-
2026-06-18days on market $189,000 Active 29 DOM
-
2026-06-17days on market $189,000 Active 28 DOM
-
2026-06-16days on market $189,000 Active 27 DOM
-
2026-06-15days on market $189,000 Active 26 DOM
-
2026-06-13days on market $189,000 Active 24 DOM
-
2026-06-13pricedays on market $189,000 Active 23 DOM
-
2026-06-09days on market $199,000 Active 20 DOM
-
2026-06-08days on market $199,000 Active 19 DOM
-
2026-06-07days on market $199,000 Active 18 DOM
-
2026-06-04days on market $199,000 Active 15 DOM
-
2026-06-03days on market $199,000 Active 14 DOM
-
2026-06-02days on market $199,000 Active 13 DOM
-
2026-06-01days on market $199,000 Active 12 DOM
-
2026-05-31days on market $199,000 Active 11 DOM
-
2026-05-20$199,000 Active
ⓘ Source: listings_history table (triggers on properties + properties_extension) + one-shot
backfill from property_details.listing_events for pre-trigger history.
Tax reassessment forecast CA · Resets to sale price
- Current annual tax
- $906 · $76/mo
- Projected year-2 tax
- $1,436 · $120/mo
- Expected delta
- +$530/yr (+$44/mo · 58.5%)
ⓘ Screening estimate from a state-policy table — verify with the county assessor before closing.
Climate risk First Street
- Flood 1/10 Low FEMA zone X · 0% chance over 30 yrs
- Wildfire 7/10 Severe
- Heat 8/10 Severe 7 d/yr ≥103°F today · 20 d/yr by 30 yrs out
- Wind 1/10 Low
- Air quality 6/10 Major 12 unhealthy d/yr today · 14 by 30 yrs out
Nearby sold comps map
Loading sold comps map…
Walkable amenities ~0.75 mi
Loading nearby amenities…
Taxation est. · year 1
- Rental income
- $27,258
- − Mortgage interest
- −$10,587
- − Property taxes
- −$906
- − Insurance
- −$945
- − Repairs & maintenance
- −$2,181
- − Management
- −$2,181
- − HOA
- −$48
- − Depreciation
- −$5,498
- Taxable income
- $4,912
- Est. tax owed @ 24.0%
- −$1,179
- After-tax cash flow
- $6,562/yr
For passive investors: Depreciation is non-cash, so a rental often shows a tax loss while cash-flowing — sheltering income. Rental losses are passive: they offset passive income freely, and up to $25,000/yr can offset ordinary (W-2) income if you actively participate and your MAGI is under $100k (phasing out to $0 by $150k); unused losses carry forward. On sale, claimed depreciation is recaptured at up to 25%, and gains may owe capital-gains tax (a 1031 exchange can defer both). Figures are a year-1 estimate at your 24.0% rate — not tax advice; consult a CPA.
Schools (NCES district)
- District
- San Jacinto Unified
- NCES district ID
- 0634440
- Math proficiency
- 13% ▼ -9.00%
- Reading proficiency
- 36% ▬ 0.00%
- Median HH income
- $43,560
- Composite
- 20.94/100
- National rank
- #8478
- State rank
- #421 of 517 in CA
Livability — San Jacinto
- Score
- 63/100
- State rank
- #467
- US rank
- #15889
Category grades
Schools grade is shown separately in the Schools card above.
Census & demographics
- Census place
- San Jacinto, CA
- City population
- 33,778
- Population (ZIP)
- 22,732
Population outlook (Riverside County) Hauer SSP2
- Today (2025)
- 2,664,475 people
- By 2030
- 2,802,692 · +5.2%
- By 2040
- 3,050,904 · +14.5%
- By 2050
- 3,256,783 · +22.2%
- By 2075
- 3,655,058 · +37.2%
- By 2100
- 3,766,594 · +41.4%
Race, ethnicity, and origin ACS 2023
- Neighborhood character
- Predominantly Hispanic (67%)
- Race & ethnicity
- Hispanic / Latino 67% Two or more races 22% White 19% Black 7% Asian 3%
- Hispanic origin (detail)
- Mexican 58% Puerto Rican 1%
- Common ancestry
- Slovak 1% Serbian 1% Romanian 1%
- Foreign-born
- 21% · Canada, Vietnam
- Languages at home
- 49% English-only · Spanish 49% Tagalog/Filipino 1% Vietnamese 1%
Political lean MEDSL · Riverside
- 2024 margin
- Toss-up / Even · D 48.0% · R 49.3% · Other 2.6%
- 2008→2024 swing
- -3.6pp toward R · 2008: 2.3pp · 2024: -1.3pp
- All cycles
- 2024: R+1.3 2020: D+8.0 2016: D+4.3 2012: R+0.4 2008: D+2.3
Not yet ingested
- Civics
- —
Market trends
- HPI YoY
- ▲ 26.05%
- Current HPI
- 393.657
- Rent YoY
- —
- Metro
- —
- State GDP YoY
- ▲ 3.21%
- F500 in state
- 116
Industry mix (Fortune 500 HQ in CA)
| Industry | F500 HQs | Revenue |
|---|---|---|
| Technology | 27 | $1,492B |
|
||
| Financial Services | 3 | $174B |
|
||
| Retail | 3 | $44B |
|
||
| Insurance | 3 | $26B |
|
||
| Media / Entertainment | 2 | $115B |
|
||
| Pharmaceuticals / Biotech | 2 | $62B |
|
||
Price history
-5.0% since first listed2 events — show timeline
- 2026-06-10 Price Changed $189,000 CRMLS
- 2026-05-20 Listed $199,000 CRMLS
Property tax history
+12.4%/yrLatest (2025): $906 · +5.8% YoY. Source: county tax records.
Cash-flow waterfall
monthlySold comps — $/sqft
last 12 mo · ≤1 miLoading sold comps…