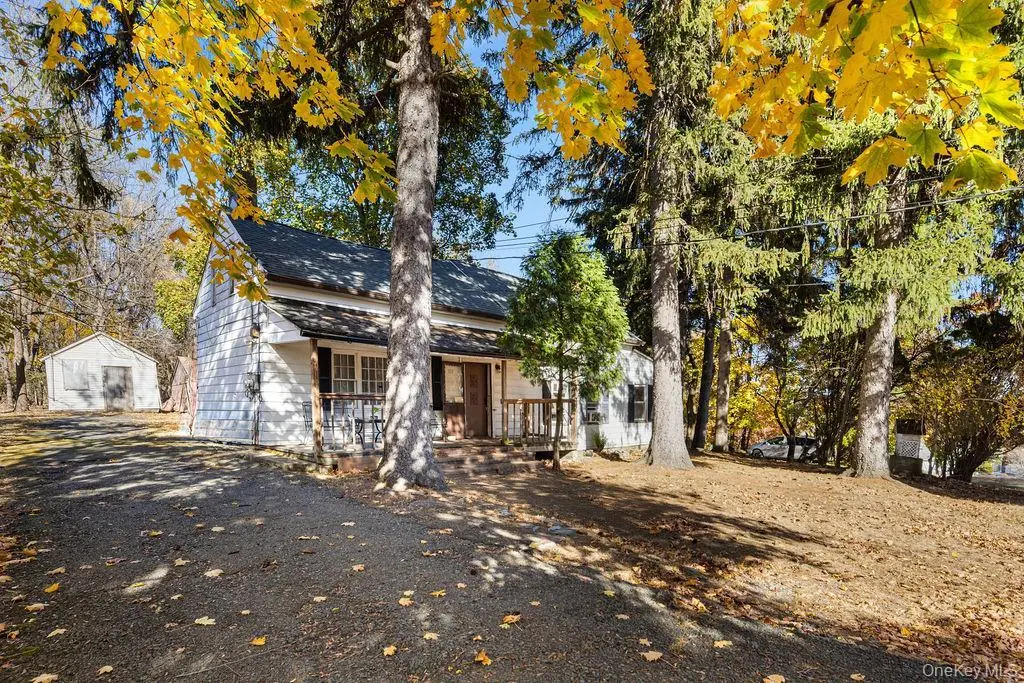
309 Willow Grove Rd · Stony Point, NY
Flood risk 1/10 · Minimal
- FEMA flood zone
- X (unshaded)
- Chance of flooding over 30 yrs
- 0.0%
- Est. flood insurance / yr
- $473 – $860
Fire risk 3/10 · Minor
- Est. fire insurance / yr
- $691 – $1,283
Heat risk 5/10 · Moderate
- Hot days now (above 98°F)
- 7 days/yr
- Hot days in 30 yrs
- 15 days/yr
Wind risk 4/10 · Minor
- Chance of severe wind over 30 yrs
- 23.0%
Air-quality risk 3/10 · Minor
- Unhealthy air days now
- 2 days/yr
- Unhealthy air days in 30 yrs
- 3 days/yr
Risk factors via First Street. Map © Google.
Why this score? — see what drove the F grade
The composite is a weighted blend of 9 inputs, each scored 0–100. Each bar is that input's sub-score; the figure is the points it added to the 100-point composite (weight × sub-score).
- ARV discount +15.0/15.0
- Cash flow +5.6/30.0
- Schools +4.1/10.0
- Livability +3.5/5.0
- Rent growth +2.5/5.0
- Condition / age +2.5/5.0
- 1% rule +1.3/10.0
- DSCR +0.0/10.0
- Appreciation +0.0/10.0
$499,000
🖨 Deal sheet (PDF) 📄 Offer letter ✓ Due diligence
Listing remarks MLS
Welcome to 309 Willow Grove Rd. Located in the highly sought-after Stony Point neighborhood, this Cape Cod home offers great potential for investors or for you to make it your own home. With 5 bedrooms, 2 bathrooms, and spacious living areas, it provides ample space for rental income. The large outdoor area offers flexibility for various uses, adding significant value. This property is ideally positioned in a growing market with strong demand, making it a solid investment for immediate returns or long-term appreciation. Don’t miss this opportunity; schedule a viewing today.
Key facts
- Large outdoor area
- 0.81 acre lot
- Built 1783
Tags
Neighborhood map
What this means for you Summary
Snapshot
- This is a 5-bed/2.0-bath single-family listed at $499k.
Deal economics
- At list price, monthly cash flow is $-1k ($-12k/yr) — negative.
- To cash-flow at today's rent, offer at most $316k (36.6% below list).
- To meet the 1% rule (rent ≥ 1% of price), the offer needs to be $315k (36.9% below list).
- Recommended offer: $315k (36.9% below list) — sets the bar for 1% rule.
- Cap rate 3.8% vs local median 2.6% in Stony Point — top-decile yield for the area; either an underpriced asset or a hidden risk that comps aren't pricing in. Stress-test before assuming the spread holds.
Location & tenants
- Location reads 70/100 on livability (#450 in NY) — a middle-class / working-renter tenant base. Strengths: employment A+, housing A+, health & safety A+; Watch: amenities F, commute F, cost of living F.
- Haverstraw-Stony Point CSD (North Rockland) (suburban): math 41% / reading 47% proficiency, ranked #427 of 590 in NY (top 72%) — families likely to look elsewhere, expect single-tenant / working-renter base with shorter leases.
- Zoned schools: Thiells Elementary School (math 37% / reading 52%, grade F, #1,277 of 2,108 statewide, top 64%, 645 students, 18% FRL); Fieldstone Middle School (math 18% / reading 46%, grade F, #511 of 729 statewide, top 71%, 1,247 students, 0% FRL); North Rockland High School (math 86% / reading 67%, grade A-, #612 of 1,100 statewide, top 56%, 2,687 students, 0% FRL) — zoned schools average 6% FRL vs 40% district-wide (34 pts lower); this property's tenant base skews higher-income than the district average.
- Market conditions: 91 active listings in the ZIP; 429 units permitted in Rockland County in 2024 (231 in 5+ unit buildings).
Forward outlook
- Local home prices are declining (-3.0%/yr); year-one equity from $3k of loan paydown is wiped out by about $15k of value loss. Plan a longer hold.
- Rockland County population projected at +7% by 2050 — modest demand growth; plan on rents tracking national, not racing it.
Negotiation context
- It's been on market 54 days — a 3% lower offer ($484k) is reasonable based on typical stale-listing flexibility.
- 3 sale attempts since 2y ago with the ask held roughly flat each time — persistent listings suggest the price (not the market) is what's stuck; bring a comps-based counter.
- Current owner paid $270k; list at $499k implies a 85% gain — meaningful room to come down on a strong offer.
Risks & watch-outs
- Watch-outs: built in 1783 — expect roof / HVAC / electrical / plumbing capex.
- Climate carrying-cost: extreme-heat days projected 7→15/yr by 2055 (HVAC capex compounding) — expect insurance premiums to compound above CPI over the hold.
Questions for the listing agent
- What do current leases actually rent for vs. the listed asking? Can we see a recent rent roll and the last 12 months of T-12 income?
- It's been on market 54 days. Have you received any prior offers? Is the seller open to a 37% concession, seller financing, or rate buy-down credit?
- Built in 1783 — when were the roof, HVAC, electrical panel, plumbing, and water heater last replaced?
- Is there a deadline driving the sale (1031 exchange, divorce, estate, relocation)? That informs how much negotiation room exists.
- The area grade is low — what's the realistic commute time and amenity access for the typical tenant pool here? Any planned neighborhood developments (good or bad) we should know about?
- What's the average days-on-market for RENTAL listings here right now (not sales)? A rising rental-DOM trend means longer vacancies and softer asking-rent achievability than the comps imply.
- What's the recent tenant-quality profile in this submarket — average credit score on applications, eviction rate, late-payment / NSF rate, and stable-employment percentage? A property-management company in the area should have these aggregated.
- How much new for-sale + rental construction is in the pipeline within 1–3 miles? Heavy new supply typically softens prices + rents 12–24 months out; constrained supply supports both.
Investment metrics
- 1% rule
- 0.63% ✗
- Cap rate
- 3.81%
- Cash-on-cash
- -8.88%
- DSCR
- 0.60
- GRM
- 13.2
CMA / ARV
- ARV (median comp)
- $849,802
- List price
- $499,000
- Delta
- -41.28%
- Verdict
- UNDERPRICED
- Comps
- 20 within 1.0 mi
Projected returns pro-forma
-3.0% appreciation · 3.0% rent growth · sell at horizon
- IRR
- -32.0%
- Equity multiple
- -0.05×
- Total profit
- $-146,651
- Equity at exit
- $74,403
- IRR
- -36.7%
- Equity multiple
- -0.52×
- Total profit
- $-212,162
- Equity at exit
- $43,144
Cash invested: $139,720 (down + closing). Projections, not guarantees.
Landlord ↔ Tenant lean methodology
- Overall (STATE)
- 15 Strongly Tenant-Friendly
- State New York
- 15 Strongly Tenant-Friendly · D+10
- County
- — inherits STATE
- City
- — inherits STATE
ZIP-level market 10980
- Active inventory
- 91
- Price-to-rent
- 13.2×
Monthly cashflow live
- Estimated rent
- $3,147 medium interval (Pro) →
- Mortgage (P&I)
- −$2,617
- Tax from tax record
- −$696 /mo · $8,354/yr
- Insurance
- −$208
- HOA
- −$0
- Lot rent
- −$0
- Vacancy / Maint / Mgmt
- −$661
- Net cashflow
- $-1,034
Break-even live
Sensitivity live
| Price | -10% $-752 | -5% $-893 | +0% $-1,034 | +5% $-1,176 | +10% $-1,317 |
|---|---|---|---|---|---|
| Rent | -10% $-1,283 | -5% $-1,159 | +0% $-1,034 | +5% $-910 | +10% $-786 |
| Rate | -1.0pp $-783 | -0.5pp $-908 | base $-1,034 | +0.5pp $-1,164 | +1.0pp $-1,295 |
UW: 25.0% down · 7.5% · 30yr · 1.5% tax · 5.0% vac · 8.0% maint · 8.0% mgmt
Financing live
Cash to close
- Down payment
- $124,750
- Closing costs
- $14,970
- Reserves months
- —
- Total cash needed
- —
Loan-product check · same deal, 3 products live
Conventional
25% down · 7.5% · 30yr
- Down + closing
- —
- Monthly P&I
- —
- Monthly cashflow
- —
- DSCR
- —
- Eligible?
- —
Personal DTI + credit; lowest rate.
DSCR
20% down · 8.5% · 30yr
- Down + closing
- —
- Monthly P&I
- —
- Monthly cashflow
- —
- DSCR
- —
- Eligible?
- —
No personal income docs; deal must DSCR.
Hard money
10% down · 12.0% · 12mo
- Down + closing
- —
- Monthly P&I
- —
- Monthly cashflow
- —
- DSCR
- —
- Eligible?
- —
Short-term bridge; refi at stabilization.
Listing history 6 events
-
2026-04-12status Active 586-char remark
Show marketing remark (586 chars)
Welcome to 309 Willow Grove Rd. Located in the highly sought-after Stony Point neighborhood, this Cape Cod home offers great potential for investors or for you to make it your own home. With 5 bedrooms, 2 bathrooms, and spacious living areas, it provides ample space for rental income. The large outdoor area offers flexibility for various uses, adding significant value. This property is ideally positioned in a growing market with strong demand, making it a solid investment for immediate returns or long-term appreciation. Don’t miss this opportunity; schedule a viewing today.
-
2026-03-13$499,000 Active 586-char remark
Show marketing remark (586 chars)
Welcome to 309 Willow Grove Rd. Located in the highly sought-after Stony Point neighborhood, this Cape Cod home offers great potential for investors or for you to make it your own home. With 5 bedrooms, 2 bathrooms, and spacious living areas, it provides ample space for rental income. The large outdoor area offers flexibility for various uses, adding significant value. This property is ideally positioned in a growing market with strong demand, making it a solid investment for immediate returns or long-term appreciation. Don’t miss this opportunity; schedule a viewing today.
-
2025-03-01historical
-
2024-11-26$599,000 Active
-
2023-08-23soldstatus $270,000
-
2023-03-22soldstatus $200,000
ⓘ Source: listings_history table (triggers on properties + properties_extension) + one-shot
backfill from property_details.listing_events for pre-trigger history.
Tax reassessment forecast NY · Partial reset (capped growth)
- Current annual tax
- $8,354 · $696/mo
- Projected year-2 tax
- $8,393 · $699/mo
- Expected delta
- +$40/yr (+$3/mo · 0.5%)
ⓘ Screening estimate from a state-policy table — verify with the county assessor before closing.
Climate risk First Street
- Flood 1/10 Low FEMA zone X (unshaded) · 0% chance over 30 yrs
- Wildfire 3/10 Moderate
- Heat 5/10 Major 7 d/yr ≥98°F today · 15 d/yr by 30 yrs out
- Wind 4/10 Moderate 23% chance of damaging wind over 30 yrs
- Air quality 3/10 Moderate 2 unhealthy d/yr today · 3 by 30 yrs out
Nearby sold comps map
Loading sold comps map…
Walkable amenities ~0.75 mi
Loading nearby amenities…
Taxation est. · year 1
- Rental income
- $37,769
- − Mortgage interest
- −$27,952
- − Property taxes
- −$8,354
- − Insurance
- −$2,495
- − Repairs & maintenance
- −$3,021
- − Management
- −$3,021
- − Depreciation
- −$14,516
- Taxable loss
- −$21,591
- Est. tax savings @ 24.0%
- +$5,182
- After-tax cash flow
- $-7,231/yr
For passive investors: Depreciation is non-cash, so a rental often shows a tax loss while cash-flowing — sheltering income. Rental losses are passive: they offset passive income freely, and up to $25,000/yr can offset ordinary (W-2) income if you actively participate and your MAGI is under $100k (phasing out to $0 by $150k); unused losses carry forward. On sale, claimed depreciation is recaptured at up to 25%, and gains may owe capital-gains tax (a 1031 exchange can defer both). Figures are a year-1 estimate at your 24.0% rate — not tax advice; consult a CPA.
Schools (NCES district)
- District
- Haverstraw-Stony Point CSD (North Rockland)
- NCES district ID
- 3614010
- Math proficiency
- 41% ▼ -7.00%
- Reading proficiency
- 47% ▼ -1.00%
- Median HH income
- $80,218
- Composite
- 40.68/100
- National rank
- #3672
- State rank
- #427 of 590 in NY
Livability — Stony Point
- Score
- 70/100
- State rank
- #450
- US rank
- #7882
Category grades
Schools grade is shown separately in the Schools card above.
Census & demographics
- Census place
- Stony Point, NY
- Population (ZIP)
- 13,793
Population outlook (Rockland County) Hauer SSP2
- Today (2025)
- 339,642 people
- By 2030
- 345,987 · +1.9%
- By 2040
- 357,178 · +5.2%
- By 2050
- 362,456 · +6.7%
- By 2075
- 367,281 · +8.1%
- By 2100
- 328,211 · -3.4%
Race, ethnicity, and origin ACS 2023
- Neighborhood character
- Diverse neighborhood (Simpson 0.60)
- Race & ethnicity
- White 58% Hispanic / Latino 22% Black 12% Two or more races 10% Asian 3%
- Hispanic origin (detail)
- Mexican 3% Puerto Rican 9% Dominican 8%
- Common ancestry
- Romanian 4% Hispanic 3% Scotch-Irish 1%
- Foreign-born
- 14% · Canada, Jamaica, China
- Languages at home
- 81% English-only · Spanish 12% French/Haitian/Cajun 3% Other Asian/Pacific 1%
Political lean MEDSL · Rockland
- 2024 margin
- R (+11.8) · D 44.1% · R 55.9%
- 2008→2024 swing
- -17.7pp toward R · 2008: 5.9pp · 2024: -11.8pp
- All cycles
- 2024: R+11.8 2020: D+1.7 2016: D+5.1 2012: D+6.6 2008: D+5.9
Not yet ingested
- Civics
- —
Market trends
- HPI YoY
- ▼ -459.52%
- Current HPI
- 243.4467
- Rent YoY
- —
- Metro
- —
- State GDP YoY
- ▲ 2.60%
- F500 in state
- 92
Industry mix (Fortune 500 HQ in NY)
| Industry | F500 HQs | Revenue |
|---|---|---|
| Financial Services | 10 | $950B |
|
||
| Consumer Goods | 9 | $162B |
|
||
| Insurance | 4 | $225B |
|
||
| Telecommunications | 2 | $144B |
|
||
| Pharmaceuticals | 2 | $112B |
|
||
| Media / Entertainment | 2 | $69B |
|
||
Price history
+149.5% since first listed6 events — show timeline
- 2026-04-12 Relisted — OneKey® MLS as Distributed by MLS Grid
- 2026-03-13 Listed $499,000 OneKey® MLS as Distributed by MLS Grid
- 2025-03-01 Listing Removed — OneKey® MLS as Distributed by MLS Grid
- 2024-11-26 Listed $599,000 OneKey® MLS as Distributed by MLS Grid
- 2023-08-23 Sold (Public Records) $270,000 Public Records
- 2023-03-22 Sold (Public Records) $200,000 Public Records
Property tax history
+1.6%/yrLatest (2025): $8,354 · -6.4% YoY. Source: county tax records.
Cash-flow waterfall
monthlySold comps — $/sqft
last 12 mo · ≤1 miLoading sold comps…