6506 Hornblende Trails Whc · San Antonio, TX
Flood risk No data
- FEMA flood zone
- —
- Chance of flooding over 30 yrs
- —
- Est. flood insurance / yr
- —
Fire risk No data
- Est. fire insurance / yr
- —
Heat risk No data
- Hot days now (above threshold)
- —
- Hot days in 30 yrs
- —
Wind risk No data
- Chance of severe wind over 30 yrs
- —
Air-quality risk No data
- Unhealthy air days now
- —
- Unhealthy air days in 30 yrs
- —
Risk factors via First Street. Map © Google.
Why this score? — see what drove the D- grade
The composite is a weighted blend of 9 inputs, each scored 0–100. Each bar is that input's sub-score; the figure is the points it added to the 100-point composite (weight × sub-score).
- Cash flow +12.1/30.0
- Appreciation +4.9/10.0
- Livability +4.0/5.0
- Condition / age +4.0/5.0
- DSCR +3.6/10.0
- 1% rule +3.5/10.0
- Rent growth +2.5/5.0
- Schools +1.9/10.0
- ARV discount +0.0/15.0
$196,399
🖨 Deal sheet 📄 Offer letter ✓ Due diligence
Listing remarks
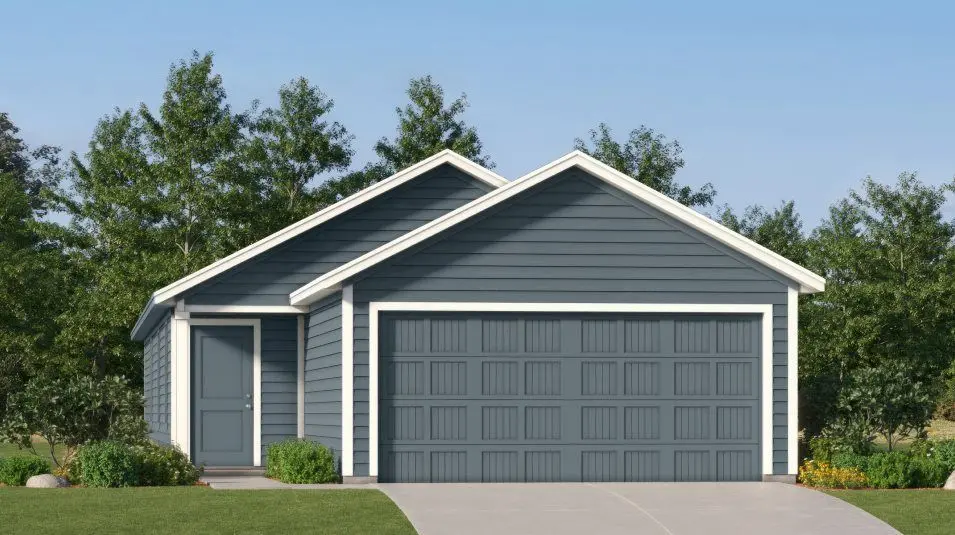
This single-level home showcases a spacious open floorplan shared between the kitchen, dining area and family room for easy entertaining. An owner's suite enjoys a private location at the front of the home, complemented by an en-suite bathroom and walk-in closet. There are three secondary bedrooms just off the main living areas, which are comfortable spaces for household members and overnight guests.
Key facts
- Walk-in closet
- Open floorplan
- Secondary bedrooms
Tags
Property features AI
Finance
- Other: Address: 6506 Hornblende Trails Whc, Elmendorf, TX 78112; Virtual tour available
- Financial info: List price reported at $195,899
Exterior
- Parking: 2 garage spaces (2 total parking spaces)
- Home design: Single-family home (Hoffman plan); Active listing
- Exterior features: Living area reported as 1483
Interior
- Bedrooms: 4 bedrooms
- Bathrooms: 2 bathrooms (both full)
- Interior features: Spec home (new construction, Hoffman plan)
Neighborhood map
What this means for you Summary
Snapshot
- This is a 4-bed/2.0-bath single-family listed at $196k. Condition is rated good.
Deal economics
- At list price, monthly cash flow is $-45 ($-534/yr) — negative.
- To cash-flow at today's rent, offer at most $190k (3.3% below list).
- To meet the 1% rule (rent ≥ 1% of price), the offer needs to be $166k (15.4% below list).
- Recommended offer: $166k (15.4% below list) — sets the bar for 1% rule.
- Cap rate 6.0% vs local median 3.8% in San Antonio — top-decile yield for the area; either an underpriced asset or a hidden risk that comps aren't pricing in. Stress-test before assuming the spread holds.
Location & tenants
- Location reads 80/100 on livability (#31 in TX, #1,616 nationally) — a professional / high-income tenant draw. Strengths: amenities A+, commute A+, cost of living A+; Watch: schools C-, crime F.
- East Central ISD (rural): math 16% / reading 25% proficiency, ranked #758 of 826 in TX (top 92%) — low school quality limits family demand, transient renter base, plan for 1-2y turnover; 61% free/reduced lunch — lower-income household profile, screen leases tightly.
- Market conditions: 442 active listings in the ZIP; 7 comparable units currently listed for rent nearby; rentals leasing fast (median 2d on market — plan ~1-2 weeks tenant-placement turnaround); 8,308 units permitted in Bexar County in 2024 (2,506 in 5+ unit buildings).
Forward outlook
- In year one you build about $1k of equity ($1k loan paydown + $-324 appreciation (-0.2% local appreciation)).
- Bexar County population projected at +50% by 2050 — long-run rental-demand tailwind backs the buy-and-hold thesis.
Negotiation context
- It's been on market 54 days — a 3% lower offer ($191k) is reasonable based on typical stale-listing flexibility.
Questions for the listing agent
- What do current leases actually rent for vs. the listed asking? Can we see a recent rent roll and the last 12 months of T-12 income?
- It's been on market 54 days. Have you received any prior offers? Is the seller open to a 15% concession, seller financing, or rate buy-down credit?
- Is there a deadline driving the sale (1031 exchange, divorce, estate, relocation)? That informs how much negotiation room exists.
- Crime grade is F in this area — have there been break-ins, vandalism, or insurance claims at this property in the last 3 years? What carrier currently insures it and at what premium?
- The area grade is low — what's the realistic commute time and amenity access for the typical tenant pool here? Any planned neighborhood developments (good or bad) we should know about?
- What's the average days-on-market for RENTAL listings here right now (not sales)? A rising rental-DOM trend means longer vacancies and softer asking-rent achievability than the comps imply.
- What's the recent tenant-quality profile in this submarket — average credit score on applications, eviction rate, late-payment / NSF rate, and stable-employment percentage? A property-management company in the area should have these aggregated.
- How much new for-sale + rental construction is in the pipeline within 1–3 miles? Heavy new supply typically softens prices + rents 12–24 months out; constrained supply supports both.
Investment metrics
- 1% rule
- 0.85% ✗
- Cap rate
- 6.02%
- Cash-on-cash
- -0.97%
- DSCR
- 0.96
- GRM
- 9.8
CMA / ARV
- ARV (median comp)
- $165,997
- List price
- $196,399
- Delta
- 18.31%
- Verdict
- OVERPRICED
- Comps
- 20 within 1.0 mi
Show comp detail 12 sales within ~0.75 mi
| Address | Dist | Beds/Ba | Sqft | Sold | Price | $/sf | Match |
|---|---|---|---|---|---|---|---|
| 14805 Mudstone Pl | 0.18mi | 4/2.0 | 1,483 (0%) | 1mo | $177,999 | $120 | 91 |
| 15106 Azzurro Stone | 0.09mi | 4/2.0 | 1,575 (+6%) | 1mo | $196,999 | $125 | 85 |
| 15103 Azzurro Stone | 0.35mi | 4/2.0 | 1,483 (0%) | 1mo | $177,999 | $120 | 83 |
| 6630 Fiore Gdn | 0.06mi | 3/2.0 (-1) | 1,354 (-9%) | 1mo | $188,999 | $140 | 77 |
| 14809 Granite Gdn | 0.11mi | 3/2.0 (-1) | 1,650 (+11%) | 1mo | $221,999 | $135 | 71 |
| 6729 Marble Rdg | 0.25mi | 3/2.5 (-1) | 1,360 (-8%) | 0mo | $140,999 | $104 | 67 |
| 15102 Azzurro Stone | 0.10mi | 3/2.0 (-1) | 1,266 (-15%) | 1mo | $177,999 | $141 | 65 |
| 6844 Marble Rdg | 0.29mi | 3/2.5 (-1) | 1,360 (-8%) | 0mo | $139,999 | $103 | 65 |
| 6808 Marble Rdg | 0.29mi | 3/2.5 (-1) | 1,360 (-8%) | 1mo | $143,999 | $106 | 65 |
| 6820 Marble Rdg | 0.29mi | 3/2.5 (-1) | 1,360 (-8%) | 2mo | $146,999 | $108 | 64 |
| 15111 Azzurro Stone | 0.35mi | 4/2.0 | 1,692 (+14%) | 1mo | $195,999 | $116 | 59 |
| 15027 Azzurro Stone | 0.35mi | 4/2.0 | 1,692 (+14%) | 2mo | $180,999 | $107 | 59 |
Match score weights: distance 35% · size 25% · config 20% · recency 20%. Top-matched comps best support the ARV.
Projected returns pro-forma
-0.17% appreciation · 3.0% rent growth · sell at horizon
- IRR
- -3.9%
- Equity multiple
- 0.82×
- Total profit
- $-10,074
- Equity at exit
- $55,411
- IRR
- 2.0%
- Equity multiple
- 1.21×
- Total profit
- $11,741
- Equity at exit
- $65,330
Cash invested: $54,992 (down + closing). Projections, not guarantees.
Landlord ↔ Tenant lean methodology
- Overall (STATE)
- 87 Strongly Landlord-Friendly
- State Texas
- 87 Strongly Landlord-Friendly · R+5
- County
- — inherits STATE
- City
- — inherits STATE
ZIP-level market 78112
- Home prices YoY
- -0.1%
- Active inventory
- 442
- Price-to-rent
- 9.8×
Monthly cashflow live
- Estimated rent
- $1,662 high interval (Pro) →
- Mortgage (P&I)
- −$1,030
- Tax est. 1.5%
- −$245 /mo · $2,946/yr
- Insurance
- −$82
- HOA
- −$0
- Vacancy / Maint / Mgmt
- −$349
- Net cashflow
- $-45
Break-even live
UW: 25.0% down · 7.5% · 30yr · 1.5% tax · 5.0% vac · 8.0% maint · 8.0% mgmt
Financing live
Cash to close
- Down payment
- $49,100
- Closing costs
- $5,892
- Reserves months
- —
- Total cash needed
- —
Loan-product check · same deal, 3 products live
Conventional
25% down · 7.5% · 30yr
- Down + closing
- —
- Monthly P&I
- —
- Monthly cashflow
- —
- DSCR
- —
- Eligible?
- —
Personal DTI + credit; lowest rate.
DSCR
20% down · 8.5% · 30yr
- Down + closing
- —
- Monthly P&I
- —
- Monthly cashflow
- —
- DSCR
- —
- Eligible?
- —
No personal income docs; deal must DSCR.
Hard money
10% down · 12.0% · 12mo
- Down + closing
- —
- Monthly P&I
- —
- Monthly cashflow
- —
- DSCR
- —
- Eligible?
- —
Short-term bridge; refi at stabilization.
Rent comps 7 comps
| Address | Beds | Baths | Sqft | Rent | $/sqft | DOM | Units | Dist |
|---|---|---|---|---|---|---|---|---|
| 6933 Biotite Rdg San Antonio, TX | 3.0 | 2.0 | 1125 | $1,650 | $1.47 | 10d | 1 | 0.39mi |
| 6933 Calcite Trl San Antonio, TX | 4.0 | 2.0 | 1606 | $1,695 | $1.06 | 12d | 1 | 0.44mi |
| 6948 Calcite Trl San Antonio, TX | 3.0 | 2.0 | 1440 | $1,600 | $1.11 | 1d | 1 | 0.48mi |
| 14606 Hackamore Way Elmendorf, TX | 4.0 | 2.0 | 1699 | $1,700 | $1.00 | 14d | 1 | 1.16mi |
| 14606 Hackamore Way Elmendorf, TX | 4.0 | 2.0 | 1696 | $1,700 | $1.00 | 1d | 1 | 1.16mi |
| 14651 Latigo Loop Elmendorf, TX | 4.0 | 2.0 | 1696 | $1,750 | $1.03 | 1d | 1 | 1.26mi |
| 7663 Stud Dr Elmendorf, TX | 3.0 | 2.0 | 1233 | $1,600 | $1.30 | 1d | 1 | 1.26mi |
Listing history 17 events
-
2026-06-18days on market $196,399 Active 54 DOM
-
2026-06-17days on market $196,399 Active 53 DOM
-
2026-06-16days on market $196,399 Active 52 DOM
-
2026-06-15price $196,399 Active 51 DOM
-
2026-06-15days on market $196,149 Active 51 DOM
-
2026-06-13days on market $196,149 Active 49 DOM
-
2026-06-09days on market $196,149 Active 45 DOM
-
2026-06-08days on market $196,149 Active 44 DOM
-
2026-06-08price $196,149 Active 43 DOM
-
2026-06-07days on market $195,899 Active 43 DOM
-
2026-06-04days on market $195,899 Active 40 DOM
-
2026-06-03days on market $195,899 Active 39 DOM
-
2026-06-02days on market $195,899 Active 38 DOM
-
2026-06-01days on market $195,899 Active 37 DOM
-
2026-05-31days on market $195,899 Active 36 DOM
-
2026-05-01price $195,899 403-char remark
-
2026-04-25$192,899 Active 403-char remark
ⓘ Source: listings_history table (triggers on properties + properties_extension) + one-shot
backfill from property_details.listing_events for pre-trigger history.
Nearby sold comps map
Loading sold comps map…
Walkable amenities ~0.75 mi
Loading nearby amenities…
Taxation est. · year 1
- Rental income
- $19,941
- − Mortgage interest
- −$11,001
- − Property taxes
- −$2,946
- − Insurance
- −$982
- − Repairs & maintenance
- −$1,595
- − Management
- −$1,595
- − Depreciation
- −$5,713
- Taxable loss
- −$3,893
- Est. tax savings @ 24.0%
- +$934
- After-tax cash flow
- $400/yr
For passive investors: Depreciation is non-cash, so a rental often shows a tax loss while cash-flowing — sheltering income. Rental losses are passive: they offset passive income freely, and up to $25,000/yr can offset ordinary (W-2) income if you actively participate and your MAGI is under $100k (phasing out to $0 by $150k); unused losses carry forward. On sale, claimed depreciation is recaptured at up to 25%, and gains may owe capital-gains tax (a 1031 exchange can defer both). Figures are a year-1 estimate at your 24.0% rate — not tax advice; consult a CPA.
Condition & rehab AI · 12 photos
This single-level home features a spacious open floorplan and a well-maintained exterior. It is in good condition with minor cosmetic updates needed to enhance its curb appeal and value.
Value-add opportunities
- Resale Paint the exterior siding — Fresh paint can enhance curb appeal and property value.
- Resale Replace the front door — A new front door can improve the home's curb appeal and security.
- Rental Clean the gutters — Clean gutters can prevent water damage and improve the home's overall appearance.
Renovation cost estimate screening
Value-add ROI direction
- Resale Paint the exterior siding — Fresh paint can enhance curb appeal and property value. ↑
- Resale Replace the front door — A new front door can improve the home's curb appeal and security. ↑
- Rental Clean the gutters — Clean gutters can prevent water damage and improve the home's overall appearance. ↑
ⓘ Cost ranges are severity-bucket heuristics (US national rule-of-thumb). Get contractor quotes + a written scope before underwriting a rehab budget.
Schools (NCES district)
- District
- East Central ISD
- NCES district ID
- 4817850
- Math proficiency
- 16% ▼ -12.00%
- Reading proficiency
- 25% ▼ -6.00%
- Median HH income
- $53,941
- Composite
- 18.67/100
- National rank
- #8887
- State rank
- #758 of 826 in TX
Livability — San Antonio
- Score
- 80/100
- State rank
- #31
- US rank
- #1616
Category grades
Schools grade is shown separately in the Schools card above.
Census & demographics
- City population
- 1,806,925
- Population (ZIP)
- 9,959
Population outlook (Bexar County) Hauer SSP2
- Today (2025)
- 2,336,851 people
- By 2030
- 2,560,728 · +9.6%
- By 2040
- 3,020,569 · +29.3%
- By 2050
- 3,493,522 · +49.5%
- By 2075
- 4,668,459 · +99.8%
- By 2100
- 5,533,242 · +136.8%
Race, ethnicity, and origin ACS 2023
- Neighborhood character
- Predominantly Hispanic (72%)
- Race & ethnicity
- Hispanic / Latino 72% Two or more races 39% White 24% Asian 1%
- Hispanic origin (detail)
- Mexican 64%
- Common ancestry
- Lithuanian 1%
- Foreign-born
- 14% · Canada
- Languages at home
- 57% English-only · Spanish 42% Tagalog/Filipino 1%
Political lean MEDSL · Bexar
- 2024 margin
- Lean D (+9.8) · D 54.3% · R 44.6% · Other 1.1%
- 2008→2024 swing
- +4.2pp toward D · 2008: 5.6pp · 2024: 9.8pp
- All cycles
- 2024: D+9.8 2020: D+18.2 2016: D+13.5 2012: D+4.6 2008: D+5.6
Not yet ingested
- Civics
- —
Market trends
- HPI YoY
- ▼ -0.17%
- Current HPI
- 276.3302
- Rent YoY
- —
- Metro
- —
- State GDP YoY
- ▲ 3.95%
- F500 in state
- 110
Industry mix (Fortune 500 HQ in TX)
| Industry | F500 HQs | Revenue |
|---|---|---|
| Energy | 16 | $1,198B |
|
||
| Technology | 5 | $198B |
|
||
| Engineering / Construction | 4 | $72B |
|
||
| Energy Services | 3 | $60B |
|
||
| Utilities | 3 | $41B |
|
||
| Healthcare | 2 | $330B |
|
||
Cash-flow waterfall
monthlySold comps — $/sqft
last 12 mo · ≤1 miLoading sold comps…