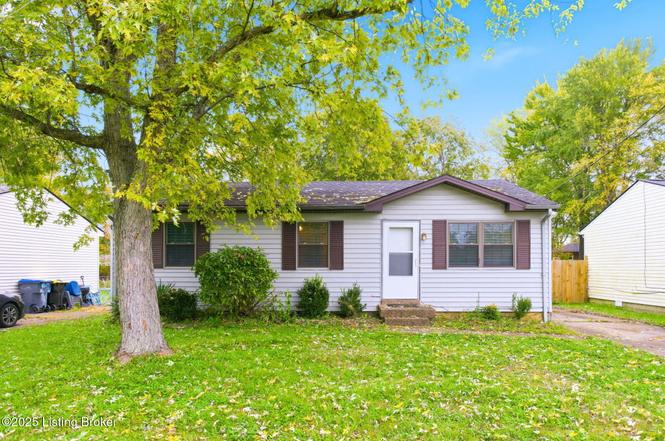
6217 Jeffrey Dr · Louisville/Jefferson County metro government (balance), KY
Flood risk 1/10 · Minimal
- FEMA flood zone
- X
- Chance of flooding over 30 yrs
- 0.0%
- Est. flood insurance / yr
- $507 – $1,088
Fire risk 1/10 · Minimal
- Est. fire insurance / yr
- $839 – $1,559
Heat risk 5/10 · Moderate
- Hot days now (above 104°F)
- 7 days/yr
- Hot days in 30 yrs
- 20 days/yr
Wind risk 2/10 · Minimal
- Chance of severe wind over 30 yrs
- 1.0%
Air-quality risk 3/10 · Minor
- Unhealthy air days now
- 2 days/yr
- Unhealthy air days in 30 yrs
- 3 days/yr
Risk factors via First Street. Map © Google.
Why this score? — see what drove the D+ grade
The composite is a weighted blend of 9 inputs, each scored 0–100. Each bar is that input's sub-score; the figure is the points it added to the 100-point composite (weight × sub-score).
- Cash flow +15.2/30.0
- ARV discount +14.1/15.0
- DSCR +4.7/10.0
- 1% rule +3.4/10.0
- Rent growth +2.6/5.0
- Livability +2.5/5.0
- Condition / age +2.5/5.0
- Schools +2.3/10.0
- Appreciation +0.0/10.0
$174,900
🖨 Deal sheet 📄 Offer letter ✓ Due diligence
Listing remarks MLS
Lots of Updates in 2015 including the Roof, Windows, Kitchen Cabinets & Flooring, Carpet & a Nice Large Deck. Storage Shed in Backyard can remain. Seller providing a One Year First American Home Warranty. Need 24 hour notice to show, property is currently has renters.
Key facts
- Great deck
- Large backyard
- Eat in kitchen
Tags
Neighborhood map
What this means for you Summary
Snapshot
- This is a 3-bed/1.0-bath single-family listed at $175k.
Deal economics
- At list price, monthly cash flow is $61 ($737/yr) — positive.
- The deal already cash-flows at list — no discount required.
- To meet the 1% rule (rent ≥ 1% of price), the offer needs to be $147k (16.2% below list).
- Recommended offer: $147k (16.2% below list) — sets the bar for 1% rule.
- Cap rate 6.7% vs local median 4.0% in Louisville/Jefferson County metro government (balance) — top-decile yield for the area; either an underpriced asset or a hidden risk that comps aren't pricing in. Stress-test before assuming the spread holds.
Location & tenants
- Location reads: area grade D — affects rentability + tenant quality, not the cash-flow math above.
- Jefferson County (urban): math 19% / reading 35% proficiency, ranked #121 of 165 in KY (top 73%) — low school quality limits family demand, transient renter base, plan for 1-2y turnover.
- Market conditions: Rents flat; 122 active listings in the ZIP; 19 comparable units currently listed for rent nearby; rentals at typical pace (median 15d on market — plan ~3-4 weeks tenant-placement turnaround); 2,836 units permitted in Jefferson County in 2024 (1,558 in 5+ unit buildings).
Forward outlook
- Local home prices are declining (-3.0%/yr); year-one equity from $1k of loan paydown is wiped out by about $5k of value loss. Plan a longer hold.
- Jefferson County population projected at +13% by 2050 — modest demand growth; plan on rents tracking national, not racing it.
Negotiation context
- It's been on market 98 days — a 9% lower offer ($159k) is reasonable based on typical stale-listing flexibility.
- 4 sale attempts since 25y ago; this cycle's ask has dropped $14k (7%) from the opening price — seller is motivated, your offer sets the floor, not the list.
- Current owner paid $112k; list at $175k implies a 56% gain — meaningful room to come down on a strong offer.
Risks & watch-outs
- Climate carrying-cost: extreme-heat days projected 7→20/yr by 2055 (HVAC capex compounding) — expect insurance premiums to compound above CPI over the hold.
Questions for the listing agent
- It's been on market 98 days. Have you received any prior offers? Is the seller open to a 16% concession, seller financing, or rate buy-down credit?
- Why hasn't it sold? Are there any deal-killer items the seller is aware of (foundation, flood, title, zoning, code violations)?
- Is there a deadline driving the sale (1031 exchange, divorce, estate, relocation)? That informs how much negotiation room exists.
- The area grade is low — what's the realistic commute time and amenity access for the typical tenant pool here? Any planned neighborhood developments (good or bad) we should know about?
- What's the average days-on-market for RENTAL listings here right now (not sales)? A rising rental-DOM trend means longer vacancies and softer asking-rent achievability than the comps imply.
- What's the recent tenant-quality profile in this submarket — average credit score on applications, eviction rate, late-payment / NSF rate, and stable-employment percentage? A property-management company in the area should have these aggregated.
- How much new for-sale + rental construction is in the pipeline within 1–3 miles? Heavy new supply typically softens prices + rents 12–24 months out; constrained supply supports both.
Investment metrics
- 1% rule
- 0.84% ✗
- Cap rate
- 6.71%
- Cash-on-cash
- 1.51%
- DSCR
- 1.07
- GRM
- 9.9
CMA / ARV
- ARV (on-the-fly)
- $205,000
- Comps found
- 12
Show comp detail 12 sales within ~0.75 mi
| Address | Dist | Beds/Ba | Sqft | Sold | Price | $/sf | Match |
|---|---|---|---|---|---|---|---|
| 6103 Mayna Rd | 0.27mi | 3/2.0 | 1,080 (+8%) | 6mo | $220,000 | $204 | 66 |
| 6513 Alamo Ct | 0.57mi | 3/1.0 | 1,055 (+6%) | 2mo | $205,000 | $194 | 63 |
| 6617 Hunters Creek Blvd | 0.43mi | 2/2.0 (-1) | 1,001 (+0%) | 10mo | $205,000 | $205 | 62 |
| 5312 Mount Blanc Rd | 0.70mi | 3/1.0 | 1,000 (0%) | 8mo | $228,000 | $228 | 60 |
| 6507 Don Bon Ct | 0.55mi | 3/1.0 | 1,050 (+5%) | 7mo | $210,000 | $200 | 60 |
| 6508 Jennifer Valley Way | 0.58mi | 3/2.0 | 1,040 (+4%) | 3mo | $210,500 | $202 | 60 |
| 6504 Jennifer Valley Way | 0.57mi | 3/2.0 | 1,040 (+4%) | 4mo | $206,000 | $198 | 60 |
| 3215 Lemmah Dr | 0.68mi | 3/1.0 | 990 (-1%) | 9mo | $190,000 | $192 | 59 |
| 6647 Sylvania Rd | 0.51mi | 3/1.0 | 924 (-8%) | 6mo | $197,000 | $213 | 59 |
| 6715 Memory Ln | 0.64mi | 3/2.0 | 1,061 (+6%) | 3mo | $219,999 | $207 | 54 |
| 6005 Cole Ave | 0.21mi | 2/1.0 (-1) | 851 (-15%) | 9mo | $175,000 | $206 | 53 |
| 6814 Memory Ln | 0.73mi | 3/1.0 | 936 (-6%) | 10mo | $200,000 | $214 | 47 |
Match score weights: distance 35% · size 25% · config 20% · recency 20%. Top-matched comps best support the ARV.
Projected returns pro-forma
-3.0% appreciation · 0.5% rent growth · sell at horizon
- IRR
- -16.5%
- Equity multiple
- 0.43×
- Total profit
- $-28,072
- Equity at exit
- $26,078
- IRR
- -13.1%
- Equity multiple
- 0.31×
- Total profit
- $-33,637
- Equity at exit
- $15,122
Cash invested: $48,972 (down + closing). Projections, not guarantees.
Landlord ↔ Tenant lean methodology
- Overall (STATE)
- 83 Strongly Landlord-Friendly
- State Kentucky
- 83 Strongly Landlord-Friendly · R+16
- County
- — inherits STATE
- City
- — inherits STATE
ZIP-level market 40258
- Rents YoY
- 0.5%
- Active inventory
- 122
- Price-to-rent
- 9.9×
Monthly cashflow live
- Estimated rent
- $1,466 high interval (Pro) →
- Mortgage (P&I)
- −$917
- Tax from tax record
- −$106 /mo · $1,278/yr
- Insurance
- −$73
- HOA
- −$0
- Vacancy / Maint / Mgmt
- −$308
- Net cashflow
- $61
Break-even live
UW: 25.0% down · 7.5% · 30yr · 1.5% tax · 5.0% vac · 8.0% maint · 8.0% mgmt
Financing live
Cash to close
- Down payment
- $43,725
- Closing costs
- $5,247
- Reserves months
- —
- Total cash needed
- —
Loan-product check · same deal, 3 products live
Conventional
25% down · 7.5% · 30yr
- Down + closing
- —
- Monthly P&I
- —
- Monthly cashflow
- —
- DSCR
- —
- Eligible?
- —
Personal DTI + credit; lowest rate.
DSCR
20% down · 8.5% · 30yr
- Down + closing
- —
- Monthly P&I
- —
- Monthly cashflow
- —
- DSCR
- —
- Eligible?
- —
No personal income docs; deal must DSCR.
Hard money
10% down · 12.0% · 12mo
- Down + closing
- —
- Monthly P&I
- —
- Monthly cashflow
- —
- DSCR
- —
- Eligible?
- —
Short-term bridge; refi at stabilization.
Rent comps 19 comps
| Address | Beds | Baths | Sqft | Rent | $/sqft | DOM | Units | Dist |
|---|---|---|---|---|---|---|---|---|
| 6004 Noah Dr Louisville, KY | 3.0 | 1.0 | 1130 | $1,650 | $1.46 | 17d | 1 | 0.16mi |
| 6712 Stana Dr Louisville, KY | 3.0 | 1.0 | 984 | $1,375 | $1.40 | 14d | 1 | 0.36mi |
| 6311 Hackel Dr Louisville, KY | 3.0 | 1.5 | 1248 | $1,735 | $1.39 | 1d | 1 | 0.36mi |
| 6711 Hunters Creek Blvd Louisville, KY | 2.0 | 1.0 | 1000 | $1,349 | $1.35 | 10d | 1 | 0.42mi |
| 6424 Hackel Dr Unit 12 Louisville, KY | 2.0 | 1.0 | 850 | $1,100 | $1.29 | 23d | 1 | 0.50mi |
| 6508 Hackel Dr Unit 5 Louisville, KY | 2.0 | 1.0 | 825 | $800 | $0.97 | 19d | 1 | 0.59mi |
| 6512 Hackel Dr Unit 2 Louisville, KY | 2.0 | 1.0 | 825 | $850 | $1.03 | 23d | 1 | 0.61mi |
| 5629 Fox Horn Cir Louisville, KY | 1.0–2.0 | 1.0–2.0 | 1092 | $1,145 | $1.05 | 1d | 8 | 0.62mi |
| 6516 Hackel Dr Apt 6 Louisville, KY | 2.0 | 1.0 | 900 | $1,100 | $1.22 | 3d | 1 | 0.63mi |
| 7210 Strive Ln Louisville, KY | 3.0 | 1.0 | 975 | $1,495 | $1.53 | 14d | 1 | 0.84mi |
| 7414 Terry Rd Louisville, KY | 3.0 | 1.0 | 1046 | $1,635 | $1.56 | 2d | 1 | 1.10mi |
| 5010 Kaufman Ln Louisville, KY | 2.0 | 1.0–2.0 | 1076 | $1,402 | $1.30 | 1d | 3 | 1.20mi |
| 3219 Wilkie Rd Louisville, KY | 2.0 | 1.0 | 725 | $1,350 | $1.86 | 10d | 1 | 1.23mi |
| 7817 Moss Creek Dr Louisville, KY | 2.0 | 2.0 | 1053 | $1,259 | $1.20 | 1d | 14 | 1.31mi |
| 4810 Guy Dr Louisville, KY | 3.0 | 1.0 | 925 | $1,800 | $1.95 | 23d | 1 | 1.35mi |
| 4902 Saddlebrook Ln Unit 3 Louisville, KY | 2.0 | 1.0 | 800 | $899 | $1.12 | 23d | 1 | 1.37mi |
| 4911 Saddlebrook Ln Apt 3 Louisville, KY | 2.0 | 1.0 | 800 | $949 | $1.19 | 23d | 1 | 1.42mi |
| 4904 Saddlebrook Ln Unit 4 Louisville, KY | 2.0 | 1.0 | 725 | $765 | $1.06 | 23d | 1 | 1.43mi |
| 6701 Barfield Rd Louisville, KY | 3.0 | 1.0 | 900 | $1,560 | $1.73 | 23d | 1 | 1.48mi |
Listing history 13 events
-
2026-02-16status Pending
-
2025-12-09price $174,900
-
2025-12-03price $179,900
-
2025-11-10$189,000 Active
-
2024-12-10historical
-
2024-08-30$169,900 Active
-
2021-07-28soldstatus $112,000
-
2018-05-11soldstatus $97,500
-
2018-05-09soldstatus $97,500 Closed 276-char remark
Show marketing remark (276 chars)
Lots of Updates in 2015 including the Roof, Windows, Kitchen Cabinets & Flooring, Carpet & a Nice Large Deck. Storage Shed in Backyard can remain. Seller providing a One Year First American Home Warranty. Need 24 hour notice to show, property is currently has renters.
-
2018-03-08status Pending 276-char remark
Show marketing remark (276 chars)
Lots of Updates in 2015 including the Roof, Windows, Kitchen Cabinets & Flooring, Carpet & a Nice Large Deck. Storage Shed in Backyard can remain. Seller providing a One Year First American Home Warranty. Need 24 hour notice to show, property is currently has renters.
-
2018-03-06$99,500 Active 276-char remark
Show marketing remark (276 chars)
Lots of Updates in 2015 including the Roof, Windows, Kitchen Cabinets & Flooring, Carpet & a Nice Large Deck. Storage Shed in Backyard can remain. Seller providing a One Year First American Home Warranty. Need 24 hour notice to show, property is currently has renters.
-
2001-11-09historical
-
2001-09-21$78,500
ⓘ Source: listings_history table (triggers on properties + properties_extension) + one-shot
backfill from property_details.listing_events for pre-trigger history.
Tax reassessment forecast KY · Resets to sale price
- Current annual tax
- $1,278 · $106/mo
- Projected year-2 tax
- $1,504 · $125/mo
- Expected delta
- +$226/yr (+$19/mo · 17.7%)
ⓘ Screening estimate from a state-policy table — verify with the county assessor before closing.
Climate risk First Street
- Flood 1/10 Low FEMA zone X · 0% chance over 30 yrs
- Wildfire 1/10 Low
- Heat 5/10 Major 7 d/yr ≥104°F today · 20 d/yr by 30 yrs out
- Wind 2/10 Low 100% chance of damaging wind over 30 yrs
- Air quality 3/10 Moderate 2 unhealthy d/yr today · 3 by 30 yrs out
Nearby sold comps map
Loading sold comps map…
Walkable amenities ~0.75 mi
Loading nearby amenities…
Taxation est. · year 1
- Rental income
- $17,590
- − Mortgage interest
- −$9,797
- − Property taxes
- −$1,278
- − Insurance
- −$874
- − Repairs & maintenance
- −$1,407
- − Management
- −$1,407
- − Depreciation
- −$5,088
- Taxable loss
- −$2,262
- Est. tax savings @ 24.0%
- +$543
- After-tax cash flow
- $1,280/yr
For passive investors: Depreciation is non-cash, so a rental often shows a tax loss while cash-flowing — sheltering income. Rental losses are passive: they offset passive income freely, and up to $25,000/yr can offset ordinary (W-2) income if you actively participate and your MAGI is under $100k (phasing out to $0 by $150k); unused losses carry forward. On sale, claimed depreciation is recaptured at up to 25%, and gains may owe capital-gains tax (a 1031 exchange can defer both). Figures are a year-1 estimate at your 24.0% rate — not tax advice; consult a CPA.
Schools (NCES district)
- District
- Jefferson County
- NCES district ID
- 2102990
- Math proficiency
- 19% ▼ -17.00%
- Reading proficiency
- 35% ▼ -11.00%
- Median HH income
- $47,885
- Composite
- 23.45/100
- National rank
- #7884
- State rank
- #121 of 165 in KY
Livability — Louisville/Jefferson County metro government (balance)
No livability data for this city. (Only ~50 U.S. cities are tracked.)
Census & demographics
- Census place
- Louisville/Jefferson County metro government (balance), KY
- County
- Jefferson County · 790,184 people
- City population
- 419,741
- Metro
- Louisville/Jefferson County, KY-IN
- Population (ZIP)
- 26,841
- Household income
- $68,162
- Rent vs Own
- Severe rent burden
- 839.0
Population outlook (Jefferson County) Hauer SSP2
- Today (2025)
- 823,112 people
- By 2030
- 849,343 · +3.2%
- By 2040
- 895,696 · +8.8%
- By 2050
- 933,630 · +13.4%
- By 2075
- 1,028,262 · +24.9%
- By 2100
- 1,072,675 · +30.3%
Race, ethnicity, and origin ACS 2023
- Neighborhood character
- Predominantly White (67%)
- Race & ethnicity
- White 67% Black 22% Two or more races 8% Hispanic / Latino 5%
- Hispanic origin (detail)
- Mexican 3% Cuban 1%
- Common ancestry
- Iranian 2% Italian 2% Slovak 2%
- Foreign-born
- 5% · Canada
- Languages at home
- 94% English-only · Spanish 4%
Political lean MEDSL · Jefferson
- 2024 margin
- D (+16.6) · D 57.4% · R 40.9% · Other 1.7%
- 2008→2024 swing
- +4.5pp toward D · 2008: 12.0pp · 2024: 16.6pp
- All cycles
- 2024: D+16.6 2020: D+20.1 2016: D+13.3 2012: D+11.1 2008: D+12.0
Not yet ingested
- Civics
- —
Market trends
- HPI YoY
- ▼ -296.36%
- Current HPI
- 244.6667
- Rent YoY
- ▲ 0.50%
- Metro
- Louisville/Jefferson County, KY-IN
- State GDP YoY
- ▲ 1.81%
- F500 in state
- 4
Industry mix (Fortune 500 HQ in KY)
| Industry | F500 HQs | Revenue |
|---|---|---|
| Healthcare | 1 | $118B |
|
||
| Food / Beverage | 1 | $7B |
|
||
Price history
+122.8% since first listed13 events — show timeline
- 2026-02-16 Pending — Metro Search MLS
- 2025-12-09 Price Changed $174,900 Metro Search MLS
- 2025-12-03 Price Changed $179,900 Metro Search MLS
- 2025-11-10 Listed $189,000 Metro Search MLS
- 2024-12-10 Listing Removed — Metro Search MLS
- 2024-08-30 Listed $169,900 Metro Search MLS
- 2021-07-28 Sold (Public Records) $112,000 Public Records
- 2018-05-11 Sold (Public Records) $97,500 Public Records
- 2018-05-09 Sold (MLS) $97,500 Metro Search MLS
- 2018-03-08 Pending — Metro Search MLS
- 2018-03-06 Listed $99,500 Metro Search MLS
- 2001-11-09 Listing Removed — Metro Search MLS
- 2001-09-21 Listed $78,500 Metro Search MLS
Property tax history
+3.6%/yrLatest (2025): $1,278 · -2.1% YoY. Source: county tax records.
Cash-flow waterfall
monthlySold comps — $/sqft
last 12 mo · ≤1 miLoading sold comps…