751 Milanville Rd · Narrowsburg, NY
Flood risk 1/10 · Minimal
- FEMA flood zone
- X (unshaded)
- Chance of flooding over 30 yrs
- 0.0%
- Est. flood insurance / yr
- $473 – $860
Fire risk 2/10 · Minimal
- Est. fire insurance / yr
- $511 – $949
Heat risk 2/10 · Minimal
- Hot days now (above 92°F)
- 7 days/yr
- Hot days in 30 yrs
- 15 days/yr
Wind risk 2/10 · Minimal
- Chance of severe wind over 30 yrs
- 2.0%
Air-quality risk 2/10 · Minimal
- Unhealthy air days now
- 1 days/yr
- Unhealthy air days in 30 yrs
- 1 days/yr
Risk factors via First Street. Map © Google.
Why this score? — see what drove the C grade
The composite is a weighted blend of 9 inputs, each scored 0–100. Each bar is that input's sub-score; the figure is the points it added to the 100-point composite (weight × sub-score).
- Cash flow +17.6/30.0
- Appreciation +9.5/10.0
- ARV discount +7.5/15.0
- DSCR +5.5/10.0
- Schools +4.7/10.0
- 1% rule +4.4/10.0
- Livability +2.8/5.0
- Rent growth +2.5/5.0
- Condition / age +2.5/5.0
$210,000
🖨 Deal sheet (PDF) 📄 Offer letter ✓ Due diligence
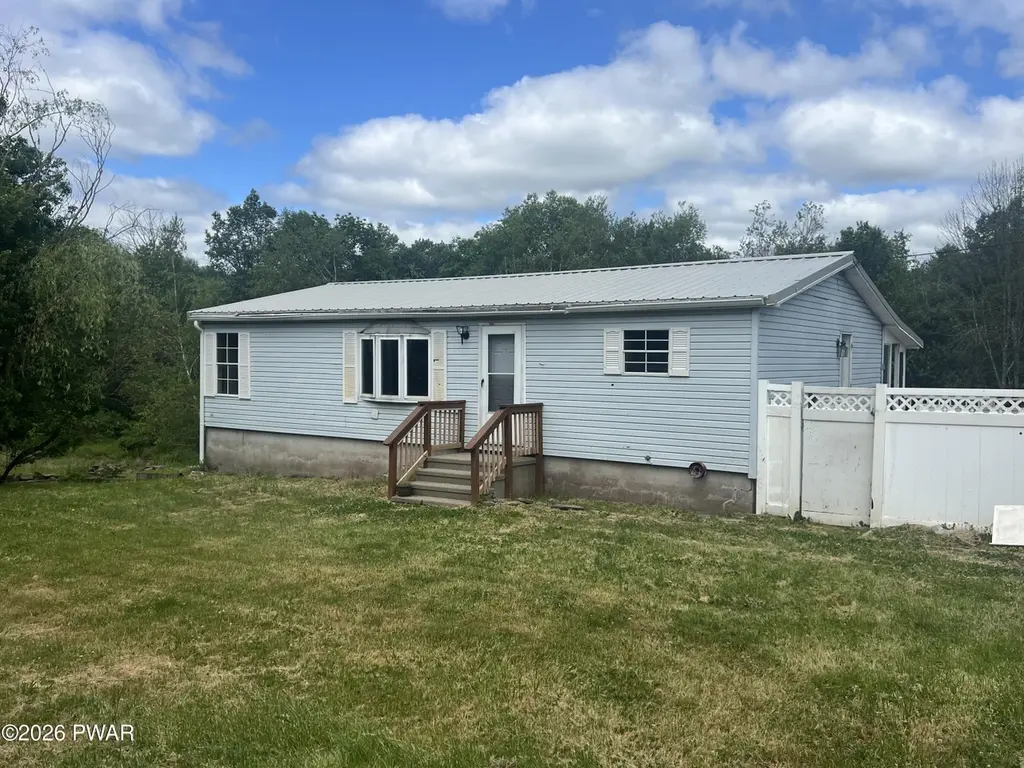
Listing remarks
5 bedroom 3 bath ranch with a detached two car garage and another detached garage for storage. sitting on a 2 acre parcel. the home also has an additional kitchen in the remodeled basement area. Potential for a possible rental unit. In a good location in the beach lake area close to the town of Honesdale and the Narrowsburg area.
Key facts
- Remodeled basement
- Additional kitchen
- Beach lake area
Tags
Property features AI
Exterior
- Parking: Detached garage(s); 2-car garage; Driveway (unpaved, private on-site parking)
- Utilities: Private well water; Septic tank sewer; 200+ amp electrical service
- Home design: Manufactured house; Two levels; Used as single-family and multi-family; Property listed as residential single-family residence; Condition ranges from fixer to updated/remodeled
- Construction: Vinyl siding and asphalt construction materials; Aluminum and asphalt roof; Block foundation; Built area includes finished living space above and below grade
- Exterior features: Deck; Rear porch; Storm door(s); Back yard and front yard; Wooded and private lot; Sloped, gentle sloping terrain
Interior
- Kitchen: Dishwasher; Microwave; Refrigerator; Gas cooktop
- Flooring: Laminate flooring; Tile flooring; Vinyl flooring
- Bathrooms: Three full bathrooms
- Heating & cooling: Electric forced-air heating; No central cooling
- Interior features: Eat-in kitchen; Bay windows; Double-pane windows; Finished full basement
- Laundry & utility: Laundry room with washer and electric dryer hookups; Main-level and basement laundry access
Neighborhood map
What this means for you Summary
Snapshot
- This is a 4-bed/2.0-bath manufactured listed at $210k.
Deal economics
- At list price, monthly cash flow is $163 ($2k/yr) — positive.
- The deal already cash-flows at list — no discount required.
- To meet the 1% rule (rent ≥ 1% of price), the offer needs to be $197k (6.2% below list).
- Recommended offer: $197k (6.2% below list) — sets the bar for 1% rule.
- Cap rate 7.2% vs local median 1.7% in Narrowsburg — top-decile yield for the area; either an underpriced asset or a hidden risk that comps aren't pricing in. Stress-test before assuming the spread holds.
Location & tenants
- Location reads 56/100 on livability (#1,108 in NY) — a working-class tenant base; expect higher turnover. Strengths: cost of living A+, housing A; Watch: schools F, crime F, amenities F.
- Wayne Highlands SD (town): math 48% / reading 64% proficiency, ranked #115 of 539 in PA (top 21%) — acceptable for families but not a draw, mixed tenant base, ~2y average lease.
- Market conditions: 177 units permitted in Wayne County in 2024 (0 in 5+ unit buildings).
Forward outlook
- In year one you build about $20k of equity ($1k loan paydown + $19k appreciation (8.9% local appreciation)).
- Wayne County population projected at -17% by 2050 — secular population decline; favor cash flow + early exit over multi-decade hold.
- At projected returns (8.9% appreciation + 3.0% rent growth), your $59k cash investment doubles in ~3 years — after that, you're playing with house money.
- By year 2, paydown + projected appreciation supports a ~$32k cash-out refi (75% LTV) — recoverable capital for the next deal without selling this one.
Negotiation context
- Only 6 days on market — expect competitive offers; lowballing is unlikely to land.
- 6 sale attempts since 3y ago with the ask held roughly flat each time — persistent listings suggest the price (not the market) is what's stuck; bring a comps-based counter.
- Current owner paid $155k; 35% above their basis — modest negotiation headroom, anchor on the comps not their cost.
Questions for the listing agent
- Is there a deadline driving the sale (1031 exchange, divorce, estate, relocation)? That informs how much negotiation room exists.
- Schools are F-rated, which usually means shorter tenancies and higher turnover. Who's the typical renter profile here, and what's been the actual vacancy rate?
- Crime grade is F in this area — have there been break-ins, vandalism, or insurance claims at this property in the last 3 years? What carrier currently insures it and at what premium?
- What's the average days-on-market for RENTAL listings here right now (not sales)? A rising rental-DOM trend means longer vacancies and softer asking-rent achievability than the comps imply.
- What's the recent tenant-quality profile in this submarket — average credit score on applications, eviction rate, late-payment / NSF rate, and stable-employment percentage? A property-management company in the area should have these aggregated.
- How much new for-sale + rental construction is in the pipeline within 1–3 miles? Heavy new supply typically softens prices + rents 12–24 months out; constrained supply supports both.
Investment metrics
- 1% rule
- 0.94% ✗
- Cap rate
- 7.23%
- Cash-on-cash
- 3.34%
- DSCR
- 1.15
- GRM
- 8.9
CMA / ARV
No comps found within radius.
Projected returns pro-forma
8.92% appreciation · 3.0% rent growth · sell at horizon
- IRR
- 24.5%
- Equity multiple
- 2.86×
- Total profit
- $109,431
- Equity at exit
- $172,859
- IRR
- 21.9%
- Equity multiple
- 6.29×
- Total profit
- $311,010
- Equity at exit
- $356,667
Cash invested: $58,800 (down + closing). Projections, not guarantees.
Landlord ↔ Tenant lean methodology
- Overall (STATE)
- 15 Strongly Tenant-Friendly
- State New York
- 15 Strongly Tenant-Friendly · D+10
- County
- — inherits STATE
- City
- — inherits STATE
ZIP-level market 18405
- Home prices YoY
- 2.8%
- Price-to-rent
- 8.9×
Monthly cashflow live
- Estimated rent
- $1,970 medium interval (Pro) →
- Mortgage (P&I)
- −$1,101
- Tax from tax record
- −$204 /mo · $2,448/yr
- Insurance
- −$88
- HOA
- −$0
- Vacancy / Maint / Mgmt
- −$414
- Net cashflow
- $163
Break-even live
Sensitivity live
| Price | -10% $282 | -5% $223 | +0% $163 | +5% $104 | +10% $45 |
|---|---|---|---|---|---|
| Rent | -10% $8 | -5% $86 | +0% $163 | +5% $241 | +10% $319 |
| Rate | -1.0pp $269 | -0.5pp $217 | base $163 | +0.5pp $109 | +1.0pp $54 |
UW: 25.0% down · 7.5% · 30yr · 1.5% tax · 5.0% vac · 8.0% maint · 8.0% mgmt
Financing live
Cash to close
- Down payment
- $52,500
- Closing costs
- $6,300
- Reserves months
- —
- Total cash needed
- —
Loan-product check · same deal, 3 products live
Conventional
25% down · 7.5% · 30yr
- Down + closing
- —
- Monthly P&I
- —
- Monthly cashflow
- —
- DSCR
- —
- Eligible?
- —
Personal DTI + credit; lowest rate.
DSCR
20% down · 8.5% · 30yr
- Down + closing
- —
- Monthly P&I
- —
- Monthly cashflow
- —
- DSCR
- —
- Eligible?
- —
No personal income docs; deal must DSCR.
Hard money
10% down · 12.0% · 12mo
- Down + closing
- —
- Monthly P&I
- —
- Monthly cashflow
- —
- DSCR
- —
- Eligible?
- —
Short-term bridge; refi at stabilization.
Listing history 6 events
-
2026-06-17status $210,000 Pending 6 DOM
-
2026-06-16days on market $210,000 Active 6 DOM
-
2026-06-15days on market $210,000 Active 5 DOM
-
2026-06-13days on market $210,000 Active 3 DOM
-
2026-06-12remarks 331-char remark
-
2026-06-12$210,000 Active 2 DOM
ⓘ Source: listings_history table (triggers on properties + properties_extension) + one-shot
backfill from property_details.listing_events for pre-trigger history.
Tax reassessment forecast NY · Partial reset (capped growth)
- Current annual tax
- $2,448 · $204/mo
- Projected year-2 tax
- $2,998 · $250/mo
- Expected delta
- +$551/yr (+$46/mo · 22.5%)
ⓘ Screening estimate from a state-policy table — verify with the county assessor before closing.
Climate risk First Street
- Flood 1/10 Low FEMA zone X (unshaded) · 0% chance over 30 yrs
- Wildfire 2/10 Low
- Heat 2/10 Low 7 d/yr ≥92°F today · 15 d/yr by 30 yrs out
- Wind 2/10 Low 2% chance of damaging wind over 30 yrs
- Air quality 2/10 Low 1 unhealthy d/yr today · 1 by 30 yrs out
Nearby sold comps map
Loading sold comps map…
Walkable amenities ~0.75 mi
Loading nearby amenities…
Taxation est. · year 1
- Rental income
- $23,639
- − Mortgage interest
- −$11,763
- − Property taxes
- −$2,448
- − Insurance
- −$1,050
- − Repairs & maintenance
- −$1,891
- − Management
- −$1,891
- − Depreciation
- −$6,109
- Taxable loss
- −$1,514
- Est. tax savings @ 24.0%
- +$363
- After-tax cash flow
- $2,325/yr
For passive investors: Depreciation is non-cash, so a rental often shows a tax loss while cash-flowing — sheltering income. Rental losses are passive: they offset passive income freely, and up to $25,000/yr can offset ordinary (W-2) income if you actively participate and your MAGI is under $100k (phasing out to $0 by $150k); unused losses carry forward. On sale, claimed depreciation is recaptured at up to 25%, and gains may owe capital-gains tax (a 1031 exchange can defer both). Figures are a year-1 estimate at your 24.0% rate — not tax advice; consult a CPA.
Schools (NCES district)
- District
- Wayne Highlands SD
- NCES district ID
- 4224970
- Math proficiency
- 48% ▼ -12.00%
- Reading proficiency
- 64% ▼ -10.00%
- Median HH income
- $46,476
- Composite
- 47.36/100
- National rank
- #2292
- State rank
- #115 of 539 in PA
Livability — Narrowsburg
- Score
- 56/100
- State rank
- #1108
- US rank
- #22694
Category grades
Schools grade is shown separately in the Schools card above.
Census & demographics
- Population (ZIP)
- 2,611
Population outlook (Wayne County) Hauer SSP2
- Today (2025)
- 47,924 people
- By 2030
- 46,191 · -3.6%
- By 2040
- 42,815 · -10.7%
- By 2050
- 39,873 · -16.8%
- By 2075
- 34,556 · -27.9%
- By 2100
- 28,358 · -40.8%
Race, ethnicity, and origin ACS 2023
- Neighborhood character
- Predominantly White (90%)
- Race & ethnicity
- White 90% Hispanic / Latino 8% Two or more races 2%
- Hispanic origin (detail)
- Mexican 2% Puerto Rican 4% Dominican 2%
- Common ancestry
- Romanian 9% Scottish 2% Subsaharan African 2%
- Foreign-born
- 2%
- Languages at home
- 96% English-only · Spanish 3% German/W. Germanic 1%
Political lean MEDSL · Wayne
- 2024 margin
- Solid R (+37.1) · D 31.1% · R 68.2%
- 2008→2024 swing
- -24.8pp toward R · 2008: -12.3pp · 2024: -37.1pp
- All cycles
- 2024: R+37.1 2020: R+33.6 2016: R+39.7 2012: R+20.9 2008: R+12.3
Not yet ingested
- Civics
- —
Market trends
- HPI YoY
- ▲ 8.92%
- Current HPI
- 333.3408
- Rent YoY
- —
- Metro
- —
- State GDP YoY
- ▲ 2.60%
- F500 in state
- 92
Industry mix (Fortune 500 HQ in NY)
| Industry | F500 HQs | Revenue |
|---|---|---|
| Financial Services | 10 | $950B |
|
||
| Consumer Goods | 9 | $162B |
|
||
| Insurance | 4 | $225B |
|
||
| Telecommunications | 2 | $144B |
|
||
| Pharmaceuticals | 2 | $112B |
|
||
| Media / Entertainment | 2 | $69B |
|
||
Price history
+320.0% since first listed14 events — show timeline
- 2026-06-07 Listed $210,000 PWMLS
- 2025-10-01 Price Changed $210,000 PWMLS
- 2025-09-07 Price Changed $229,000 PWMLS
- 2025-09-07 Price Changed $244,500 PWMLS
- 2025-07-14 Listed $249,900 PWMLS
- 2024-12-31 Listing Removed — BRIGHT MLS
- 2024-10-09 Listed $229,000 BRIGHT MLS
- 2024-10-01 Listed $229,000 PWMLS
- 2023-07-10 Sold (Public Records) $155,000 Public Records
- 2023-05-26 Sold (MLS) $155,000 PWMLS
- 2023-05-26 Sold (MLS) $155,000 PWMLS
- 2023-04-14 Listed $169,000 PWMLS
- 2023-04-14 Listed $169,000 PWMLS
- 2001-12-13 Sold (Public Records) $50,000 Public Records
Property tax history
+2.1%/yrLatest (2026): $2,448 · +2.7% YoY. Source: county tax records.
Cash-flow waterfall
monthlySold comps — $/sqft
last 12 mo · ≤1 miLoading sold comps…