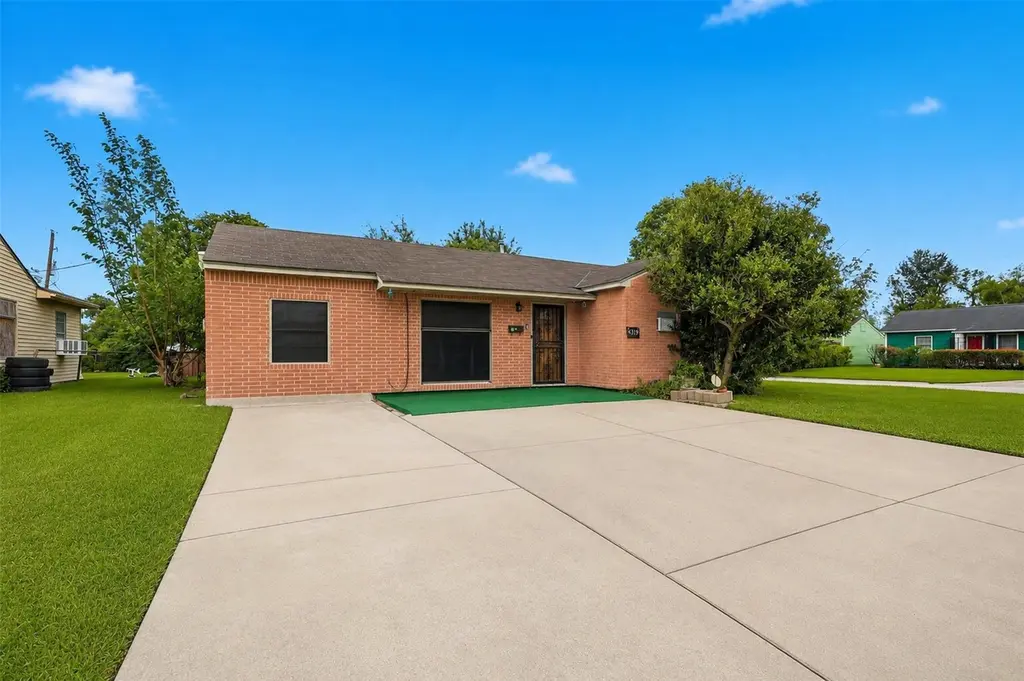
1419 Silverdale St · Houston, TX
Flood risk 4/10 · Minor
- FEMA flood zone
- X (unshaded)
- Chance of flooding over 30 yrs
- 0.22%
- Est. flood insurance / yr
- $507 – $1,088
Fire risk 2/10 · Minimal
- Est. fire insurance / yr
- $1,222 – $2,270
Heat risk 9/10 · Severe
- Hot days now (above 110°F)
- 7 days/yr
- Hot days in 30 yrs
- 24 days/yr
Wind risk 9/10 · Severe
- Chance of severe wind over 30 yrs
- 99.0%
Air-quality risk 3/10 · Minor
- Unhealthy air days now
- 2 days/yr
- Unhealthy air days in 30 yrs
- 3 days/yr
Risk factors via First Street. Map © Google.
Why this score? — see what drove the C grade
The composite is a weighted blend of 9 inputs, each scored 0–100. Each bar is that input's sub-score; the figure is the points it added to the 100-point composite (weight × sub-score).
- Cash flow +15.3/30.0
- ARV discount +12.7/15.0
- Appreciation +10.0/10.0
- DSCR +4.7/10.0
- 1% rule +4.5/10.0
- Livability +3.7/5.0
- Schools +2.7/10.0
- Rent growth +2.5/5.0
- Condition / age +2.5/5.0
$150,000
🖨 Deal sheet (PDF) 📄 Offer letter ✓ Due diligence
Listing remarks
Ready for your vision! This all brick 2/3 bedroom, 1 bath home sits on a spacious corner lot in Houston’s Pleasantville community. NO HOA, this is your chance to create something special. TLC needed throughout. Great bones, great location, great opportunity. Bring your contractor and your creativity. Situated at the crossroads of I-10 and I-610 with direct access to Downtown Houston in 10 to 15 minutes. High demand rental corridor. Close to major employment centers along the Ship Channel. Strong long term value in an established Houston neighborhood.
Key facts
- 6,181 sq ft lot
- Built 1953
- Listed 52 days
Property features AI
Finance
- Financial info: Fractional ownership
- HOA & community: Community curbs
Exterior
- Parking: No parking
- Utilities: Public water; Public sewer; Concrete road surface
- Home design: Residential property; Corner lot
- Construction: Brick construction; Built in 1953; Composition roof; Slab foundation
- Exterior features: Fenced backyard; Storage; Shed(s)
Interior
- Kitchen: Kitchen on the first floor
- Bedrooms: Primary bedroom on the first floor; Additional bedroom on the first floor; Up to 3 possible bedrooms
- Flooring: Carpet
- Bathrooms: 1 full bathroom
- Heating & cooling: Window unit heating; Window unit cooling
- Interior features: Tile counters; Kitchen/dining combo; Living/dining room
Neighborhood map
What this means for you Summary
Snapshot
- This is a 3-bed/1.0-bath single-family listed at $150k.
Deal economics
- At list price, monthly cash flow is $55 ($656/yr) — positive.
- The deal already cash-flows at list — no discount required.
- To meet the 1% rule (rent ≥ 1% of price), the offer needs to be $142k (5.3% below list).
- Recommended offer: $142k (5.3% below list) — sets the bar for 1% rule.
- Cap rate 6.7% vs local median 3.2% in Houston — top-decile yield for the area; either an underpriced asset or a hidden risk that comps aren't pricing in. Stress-test before assuming the spread holds.
Location & tenants
- Location reads 74/100 on livability (#184 in TX, #4,771 nationally) — a middle-class / working-renter tenant base. Strengths: amenities A+, cost of living A+, housing A+; Watch: crime F.
- Houston ISD (urban): math 27% / reading 35% proficiency, ranked #593 of 826 in TX (top 72%) — families likely to look elsewhere, expect single-tenant / working-renter base with shorter leases; 71% free/reduced lunch — lower-income household profile, screen leases tightly.
- Zoned schools: Pleasantville El (math 8% / reading 22%, grade F, #4,021 of 4,322 statewide, top 94%, 233 students, 97% FRL); Holland Middle (math 10% / reading 16%, grade F, #1,609 of 1,662 statewide, top 97%, 644 students, 98% FRL); Furr H S (math 8% / reading 25%, grade F, #1,497 of 1,632 statewide, top 92%, 1,173 students, 96% FRL) — zoned schools average 97% FRL vs 71% district-wide (26 pts higher); higher-poverty schools than district average — tighter screening recommended.
- Zoned-school proficiency averages 15% at this address vs 31% district-wide (-16 pts) — the specific schools serving this property underperform the Houston ISD average; the district grade overstates school quality for this exact location.
- Market conditions: 154 active listings in the ZIP; 11 comparable units currently listed for rent nearby; rentals lingering (median 45d on market — plan ~5-8 weeks vacancy on turnover, expect pricing pressure); 55% of comp listings sitting > 30 days — soft ceiling on asking rent; 29,883 units permitted in Harris County in 2024 (8,621 in 5+ unit buildings).
Forward outlook
- In year one you build about $16k of equity ($1k loan paydown + $15k appreciation (10.0% local appreciation)).
- Harris County population projected at +47% by 2050 — long-run rental-demand tailwind backs the buy-and-hold thesis.
- At projected returns (10.0% appreciation + 3.0% rent growth), your $42k cash investment doubles in ~3 years — after that, you're playing with house money.
- By year 3, paydown + projected appreciation supports a ~$41k cash-out refi (75% LTV) — recoverable capital for the next deal without selling this one.
Negotiation context
- It's been on market 53 days — a 3% lower offer ($146k) is reasonable based on typical stale-listing flexibility.
Risks & watch-outs
- Watch-outs: built in 1953 — expect roof / HVAC / electrical / plumbing capex.
- Climate carrying-cost: severe wind risk, 99% chance of damaging wind over 30y; extreme-heat days projected 7→24/yr by 2055 (HVAC capex compounding) — expect insurance premiums to compound above CPI over the hold.
Questions for the listing agent
- It's been on market 53 days. Have you received any prior offers? Is the seller open to a 5% concession, seller financing, or rate buy-down credit?
- Built in 1953 — when were the roof, HVAC, electrical panel, plumbing, and water heater last replaced?
- Is there a deadline driving the sale (1031 exchange, divorce, estate, relocation)? That informs how much negotiation room exists.
- Schools are D-rated, which usually means shorter tenancies and higher turnover. Who's the typical renter profile here, and what's been the actual vacancy rate?
- Crime grade is F in this area — have there been break-ins, vandalism, or insurance claims at this property in the last 3 years? What carrier currently insures it and at what premium?
- What's the average days-on-market for RENTAL listings here right now (not sales)? A rising rental-DOM trend means longer vacancies and softer asking-rent achievability than the comps imply.
- What's the recent tenant-quality profile in this submarket — average credit score on applications, eviction rate, late-payment / NSF rate, and stable-employment percentage? A property-management company in the area should have these aggregated.
- How much new for-sale + rental construction is in the pipeline within 1–3 miles? Heavy new supply typically softens prices + rents 12–24 months out; constrained supply supports both.
Investment metrics
- 1% rule
- 0.95% ✗
- Cap rate
- 6.73%
- Cash-on-cash
- 1.56%
- DSCR
- 1.07
- GRM
- 8.8
CMA / ARV
- ARV (median comp)
- $169,571
- List price
- $150,000
- Delta
- -11.54%
- Verdict
- UNDERPRICED
- Comps
- 20 within 1.0 mi
Show comp detail 12 sales within ~0.75 mi
| Address | Dist | Beds/Ba | Sqft | Sold | Price | $/sf | Match |
|---|---|---|---|---|---|---|---|
| 8734 Josie St | 0.43mi | 3/1.0 | 1,150 (+5%) | 1mo | $159,000 | $138 | 71 |
| 1431 Teanaway Ln | 0.12mi | 2/1.0 (-1) | 1,000 (-9%) | 9mo | $115,000 | $115 | 67 |
| 1718 Normandale St | 0.34mi | 3/2.0 | 1,144 (+4%) | 9mo | $229,000 | $200 | 65 |
| 1427 Teanaway Ln | 0.11mi | 3/2.0 | 1,232 (+12%) | 11mo | $239,750 | $195 | 61 |
| 1531 Teanaway Ln | 0.17mi | 4/1.0 (+1) | 1,226 (+12%) | 12mo | $195,000 | $159 | 58 |
| 8606 Guinevere St | 0.39mi | 3/1.5 | 1,238 (+13%) | 2mo | $225,000 | $182 | 57 |
| 8711 Othello St | 0.43mi | 3/2.0 | 1,180 (+8%) | 8mo | $215,000 | $182 | 57 |
| 8427 Guinevere St | 0.40mi | 4/2.0 (+1) | 1,228 (+12%) | 1mo | $225,000 | $183 | 52 |
| 8647 Berndale St | 0.26mi | 4/2.0 (+1) | 1,252 (+14%) | 11mo | $199,999 | $160 | 47 |
| 8715 Josie st St | 0.38mi | 3/2.0 | 1,006 (-8%) | 23mo | $198,000 | $197 | 45 |
| 8755 Pattibob St | 0.45mi | 4/1.0 (+1) | 1,240 (+13%) | 22mo | $179,000 | $144 | 34 |
| 7902 Wiggins St | 0.73mi | 2/1.0 (-1) | 940 (-14%) | 11mo | $175,000 | $186 | 28 |
Match score weights: distance 35% · size 25% · config 20% · recency 20%. Top-matched comps best support the ARV.
Projected returns pro-forma
10.0% appreciation · 3.0% rent growth · sell at horizon
- IRR
- 25.4%
- Equity multiple
- 3.03×
- Total profit
- $85,216
- Equity at exit
- $135,132
- IRR
- 22.4%
- Equity multiple
- 6.91×
- Total profit
- $248,290
- Equity at exit
- $291,417
Cash invested: $42,000 (down + closing). Projections, not guarantees.
Landlord ↔ Tenant lean methodology
- Overall (STATE)
- 87 Strongly Landlord-Friendly
- State Texas
- 87 Strongly Landlord-Friendly · R+5
- County
- — inherits STATE
- City
- — inherits STATE
ZIP-level market 77029
- Home prices YoY
- 7.2%
- Active inventory
- 154
- Price-to-rent
- 8.8×
Monthly cashflow live
- Estimated rent
- $1,421 high interval (Pro) →
- Mortgage (P&I)
- −$787
- Tax from tax record
- −$219 /mo · $2,624/yr
- Insurance
- −$62
- HOA
- −$0
- Vacancy / Maint / Mgmt
- −$298
- Net cashflow
- $55
Break-even live
Sensitivity live
| Price | -10% $140 | -5% $97 | +0% $55 | +5% $12 | +10% $-30 |
|---|---|---|---|---|---|
| Rent | -10% $-58 | -5% $-1 | +0% $55 | +5% $111 | +10% $167 |
| Rate | -1.0pp $130 | -0.5pp $93 | base $55 | +0.5pp $16 | +1.0pp $-24 |
UW: 25.0% down · 7.5% · 30yr · 1.5% tax · 5.0% vac · 8.0% maint · 8.0% mgmt
Financing live
Cash to close
- Down payment
- $37,500
- Closing costs
- $4,500
- Reserves months
- —
- Total cash needed
- —
Loan-product check · same deal, 3 products live
Conventional
25% down · 7.5% · 30yr
- Down + closing
- —
- Monthly P&I
- —
- Monthly cashflow
- —
- DSCR
- —
- Eligible?
- —
Personal DTI + credit; lowest rate.
DSCR
20% down · 8.5% · 30yr
- Down + closing
- —
- Monthly P&I
- —
- Monthly cashflow
- —
- DSCR
- —
- Eligible?
- —
No personal income docs; deal must DSCR.
Hard money
10% down · 12.0% · 12mo
- Down + closing
- —
- Monthly P&I
- —
- Monthly cashflow
- —
- DSCR
- —
- Eligible?
- —
Short-term bridge; refi at stabilization.
Rent comps 11 comps
| Address | Beds | Baths | Sqft | Rent | $/sqft | DOM | Units | Dist |
|---|---|---|---|---|---|---|---|---|
| 8710 Josie St Houston, TX | 3.0 | 1.0 | 1000 | $1,090 | $1.09 | 0d | 1 | 0.38mi |
| 8735 Cowart St Houston, TX | 3.0 | 1.0 | 1136 | $1,000 | $0.88 | 45d | 1 | 0.40mi |
| 8726 Josie St Houston, TX | 3.0 | 1.0 | 950 | $1,000 | $1.05 | 45d | 1 | 0.42mi |
| 8534 Fillmore St Houston, TX | 3.0 | 1.0 | 965 | $1,600 | $1.66 | 45d | 1 | 0.45mi |
| 2203 Pearl St Houston, TX | 3.0 | 2.0 | 1298 | $1,570 | $1.21 | 15d | 1 | 0.86mi |
| 9701 Market St Houston, TX | 1.0–2.0 | 1.0 | 798 | $1,309 | $1.64 | 9d | 1 | 1.12mi |
| 9709 Cargill St Houston, TX | 3.0 | 2.0 | 1184 | $2,300 | $1.94 | 45d | 1 | 1.17mi |
| 9806 Fillmore St Houston, TX | 2.0 | 2.0 | 850 | $1,850 | $2.18 | 45d | 1 | 1.24mi |
| 9710 Tuffly St Houston, TX | 3.0 | 2.0 | 1275 | $1,795 | $1.41 | 26d | 1 | 1.28mi |
| 9907 Lanewell St Unit a Houston, TX | 3.0 | 2.0 | 872 | $1,154 | $1.32 | 23d | 1 | 1.34mi |
| 9713 Stedman St Unit b Houston, TX | 3.0 | 2.0 | 872 | $1,095 | $1.26 | 45d | 1 | 1.41mi |
Listing history 15 events
-
2026-06-21days on market $150,000 Active 53 DOM
-
2026-06-18days on market $150,000 Active 50 DOM
-
2026-06-17days on market $150,000 Active 49 DOM
-
2026-06-16days on market $150,000 Active 48 DOM
-
2026-06-15days on market $150,000 Active 47 DOM
-
2026-06-13days on market $150,000 Active 45 DOM
-
2026-06-10days on market $150,000 Active 41 DOM
-
2026-06-08days on market $150,000 Active 40 DOM
-
2026-06-07days on market $150,000 Active 39 DOM
-
2026-06-04days on market $150,000 Active 36 DOM
-
2026-06-01days on market $150,000 Active 33 DOM
-
2026-05-31days on market $150,000 Active 32 DOM
-
2026-04-30$150,000 Active 562-char remark
-
2026-04-25historical $150,000 562-char remark
-
1988-01-02soldstatus
ⓘ Source: listings_history table (triggers on properties + properties_extension) + one-shot
backfill from property_details.listing_events for pre-trigger history.
Tax reassessment forecast TX · Resets to sale price
- Current annual tax
- $2,624 · $219/mo
- Projected year-2 tax
- $2,745 · $229/mo
- Expected delta
- +$121/yr (+$10/mo · 4.6%)
ⓘ Screening estimate from a state-policy table — verify with the county assessor before closing.
Climate risk First Street
- Flood 4/10 Moderate FEMA zone X (unshaded) · 22% chance over 30 yrs
- Wildfire 2/10 Low
- Heat 9/10 Extreme 7 d/yr ≥110°F today · 24 d/yr by 30 yrs out
- Wind 9/10 Extreme 99% chance of damaging wind over 30 yrs
- Air quality 3/10 Moderate 2 unhealthy d/yr today · 3 by 30 yrs out
Nearby sold comps map
Loading sold comps map…
Walkable amenities ~0.75 mi
Loading nearby amenities…
Taxation est. · year 1
- Rental income
- $17,050
- − Mortgage interest
- −$8,402
- − Property taxes
- −$2,624
- − Insurance
- −$750
- − Repairs & maintenance
- −$1,364
- − Management
- −$1,364
- − Depreciation
- −$4,364
- Taxable loss
- −$1,818
- Est. tax savings @ 24.0%
- +$436
- After-tax cash flow
- $1,092/yr
For passive investors: Depreciation is non-cash, so a rental often shows a tax loss while cash-flowing — sheltering income. Rental losses are passive: they offset passive income freely, and up to $25,000/yr can offset ordinary (W-2) income if you actively participate and your MAGI is under $100k (phasing out to $0 by $150k); unused losses carry forward. On sale, claimed depreciation is recaptured at up to 25%, and gains may owe capital-gains tax (a 1031 exchange can defer both). Figures are a year-1 estimate at your 24.0% rate — not tax advice; consult a CPA.
Schools (NCES district)
- District
- Houston ISD
- NCES district ID
- 4823640
- Math proficiency
- 27% ▼ -18.00%
- Reading proficiency
- 35% ▼ -6.00%
- Median HH income
- $46,054
- Composite
- 26.63/100
- National rank
- #7173
- State rank
- #593 of 826 in TX
Livability — Houston
- Score
- 74/100
- State rank
- #184
- US rank
- #4771
Category grades
Schools grade is shown separately in the Schools card above.
Census & demographics
- Census place
- Houston, TX
- County
- Harris County · 4,702,590 people
- City population
- 3,226,434
- Metro
- Houston-The Woodlands-Sugar Land, TX
- Population (ZIP)
- 16,154
- Household income
- $48,279
- Rent vs Own
- Severe rent burden
- 457.0
Population outlook (Harris County) Hauer SSP2
- Today (2025)
- 5,571,493 people
- By 2030
- 6,089,821 · +9.3%
- By 2040
- 7,142,806 · +28.2%
- By 2050
- 8,185,864 · +46.9%
- By 2075
- 10,574,329 · +89.8%
- By 2100
- 12,109,958 · +117.4%
Race, ethnicity, and origin ACS 2023
- Neighborhood character
- Predominantly Hispanic (72%)
- Race & ethnicity
- Hispanic / Latino 72% Two or more races 32% Black 22% White 5%
- Hispanic origin (detail)
- Mexican 66%
- Foreign-born
- 31% · Canada
- Languages at home
- 39% English-only · Spanish 61%
Political lean MEDSL · Harris
- 2024 margin
- Lean D (+5.5) · D 52.0% · R 46.4% · Other 1.6%
- 2008→2024 swing
- +3.9pp toward D · 2008: 1.6pp · 2024: 5.5pp
- All cycles
- 2024: D+5.5 2020: D+13.3 2016: D+12.4 2012: D+0.1 2008: D+1.6
Not yet ingested
- Civics
- —
Market trends
- HPI YoY
- ▲ 18.53%
- Current HPI
- 276.1811
- Rent YoY
- —
- Metro
- Houston-The Woodlands-Sugar Land, TX
- State GDP YoY
- ▲ 3.95%
- F500 in state
- 110
Industry mix (Fortune 500 HQ in TX)
| Industry | F500 HQs | Revenue |
|---|---|---|
| Energy | 16 | $1,198B |
|
||
| Technology | 5 | $198B |
|
||
| Engineering / Construction | 4 | $72B |
|
||
| Energy Services | 3 | $60B |
|
||
| Utilities | 3 | $41B |
|
||
| Healthcare | 2 | $330B |
|
||
Price history
+0.0% since first listed3 events — show timeline
- 2026-04-30 Listed $150,000 HARMLS
- 2026-04-25 Coming Soon $150,000 HARMLS
- 1988-01-02 Sold (Public Records) — Public Records
Property tax history
+2.9%/yrLatest (2025): $2,624 · +4.9% YoY. Source: county tax records.
Cash-flow waterfall
monthlySold comps — $/sqft
last 12 mo · ≤1 miLoading sold comps…