 12-Plex
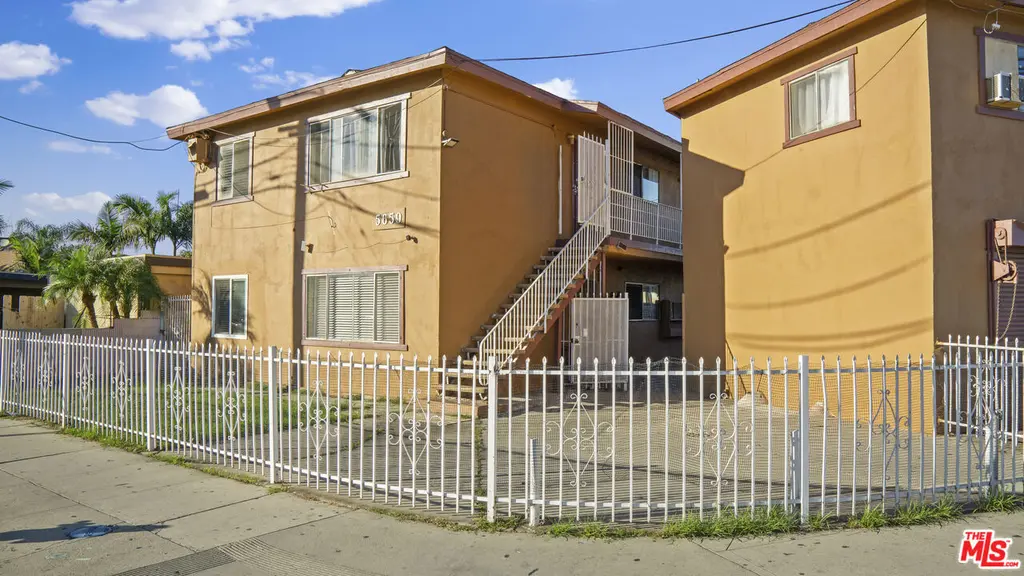
5659 Quinn St · Bell Gardens, CA
Flood risk 6/10 · Moderate
- FEMA flood zone
- X
- Chance of flooding over 30 yrs
- 0.72%
- Est. flood insurance / yr
- $507 – $1,088
Fire risk 1/10 · Minimal
- Est. fire insurance / yr
- $659 – $1,223
Heat risk 5/10 · Moderate
- Hot days now (above 92°F)
- 7 days/yr
- Hot days in 30 yrs
- 21 days/yr
Wind risk 1/10 · Minimal
- Chance of severe wind over 30 yrs
- —
Air-quality risk 5/10 · Moderate
- Unhealthy air days now
- 9 days/yr
- Unhealthy air days in 30 yrs
- 9 days/yr
Risk factors via First Street. Map © Google.
Why this score? — see what drove the D- grade
The composite is a weighted blend of 9 inputs, each scored 0–100. Each bar is that input's sub-score; the figure is the points it added to the 100-point composite (weight × sub-score).
- Cash flow +18.9/30.0
- DSCR +6.0/10.0
- 1% rule +4.0/10.0
- Livability +3.2/5.0
- Rent growth +2.5/5.0
- Condition / age +2.5/5.0
- Schools +2.1/10.0
- ARV discount +0.0/15.0
- Appreciation +0.0/10.0
$2,699,999
🖨 Deal sheet 📄 Offer letter ✓ Due diligence
Multi-family units
County records classify this as Multi-Family (5+ Unit). Listing-text estimate: 12 units. confirmed
5+ unit building — per-unit beds/baths from public records are typically unavailable; the breakdown below (if shown) is an estimate from the listing text.
Listing remarks MLS
Attractive 12 unit multifamily property in the high demand Bell Gardens market. The mix includes (8) two bedroom one bath units and (4) one bedroom one bath units that rent well and stay occupied. Current income is $229,392 with market rents supporting $278,400 , giving buyers clear rent upside of about 21.4% . The building offers on site parking with carports, 4 garage spaces, and open spaces. Each unit is separately metered for electricity and gas. The on site laundry room generates about $400 per month in extra income. The layout and features make the property easy to run. Located near Eastern Avenue, Jaboneria Road, the 710 Freeway, and Florence Avenue, the property sits close to major retailers, services, and employment centers. Tenants benefit from quick access to shopping and transit, supporting long term demand in this proven rental area.
Key facts
- On site laundry room
- On site parking
- Multifamily property
Tags
Neighborhood map
What this means for you Summary
Snapshot
- This is a 8×2bd/1ba + 4×1bd/1ba units multifamily listed at $2.70M.
Deal economics
- At list price, monthly cash flow is $3k ($33k/yr) — positive. Per door: $230/mo.
- The deal already cash-flows at list — no discount required.
- To meet the 1% rule (rent ≥ 1% of price), the offer needs to be $2.43M (10.0% below list).
- Recommended offer: $2.38M (12.0% below list) — sets the bar for market timing.
- Cap rate 7.5% vs local median 4.0% in Bell Gardens — top-decile yield for the area; either an underpriced asset or a hidden risk that comps aren't pricing in. Stress-test before assuming the spread holds.
Location & tenants
- Location reads 65/100 on livability (#388 in CA) — a middle-class / working-renter tenant base. Strengths: commute A+; Watch: crime C-, amenities D+, employment D+.
- Montebello Unified (suburban): math 17% / reading 32% proficiency, ranked #419 of 517 in CA (top 81%) — low school quality limits family demand, transient renter base, plan for 1-2y turnover; 76% free/reduced lunch — lower-income household profile, screen leases tightly.
- Market conditions: 55 active listings in the ZIP; 19,697 units permitted in Los Angeles County in 2024 (9,426 in 5+ unit buildings).
- At $24,289/mo this rent would consume 478% of the median local household income ($61k/yr) (locally 6155% of renters already pay >50% of income on rent) — very limited rent-growth headroom before tenants either downsize or default.
Forward outlook
- Local home prices are declining (-3.0%/yr); year-one equity from $19k of loan paydown is wiped out by about $81k of value loss. Plan a longer hold.
- Los Angeles County population projected at +9% by 2050 — modest demand growth; plan on rents tracking national, not racing it.
Negotiation context
- It's been on market 192 days — a 12% lower offer ($2.38M) is reasonable based on typical stale-listing flexibility.
- 4 sale attempts since 25y ago; this cycle's ask has dropped $24.30M (90%) from the opening price — seller is motivated, your offer sets the floor, not the list.
- Current owner paid $565k; list at $2.70M implies a 378% gain — meaningful room to come down on a strong offer.
Risks & watch-outs
- Climate carrying-cost: major flood risk; extreme-heat days projected 7→21/yr by 2055 (HVAC capex compounding) — expect insurance premiums to compound above CPI over the hold.
Questions for the listing agent
- It's been on market 192 days. Have you received any prior offers? Is the seller open to a 12% concession, seller financing, or rate buy-down credit?
- Can we see the unit-by-unit rent roll, current vacancy, and any below-market leases? What's the average tenancy length?
- What capital expenditures (roof, boiler, parking lot, exteriors) have been made in the last 5 years, and what's planned in the next 2?
- Built in 1962 — when were the roof, HVAC, electrical panel, plumbing, and water heater last replaced?
- Why hasn't it sold? Are there any deal-killer items the seller is aware of (foundation, flood, title, zoning, code violations)?
- Is there a deadline driving the sale (1031 exchange, divorce, estate, relocation)? That informs how much negotiation room exists.
- Schools are F-rated, which usually means shorter tenancies and higher turnover. Who's the typical renter profile here, and what's been the actual vacancy rate?
- The area grade is low — what's the realistic commute time and amenity access for the typical tenant pool here? Any planned neighborhood developments (good or bad) we should know about?
- What's the average days-on-market for RENTAL listings here right now (not sales)? A rising rental-DOM trend means longer vacancies and softer asking-rent achievability than the comps imply.
- What's the recent tenant-quality profile in this submarket — average credit score on applications, eviction rate, late-payment / NSF rate, and stable-employment percentage? A property-management company in the area should have these aggregated.
- How much new apartment / multifamily construction is in the pipeline within 1–3 miles? Heavy new supply (>2% of stock underway) typically softens rents 12–24 months out; light construction supports rent growth.
Investment metrics
- 1% rule
- 0.90% ✗
- Cap rate
- 7.52%
- Cash-on-cash
- 4.39%
- DSCR
- 1.20
- GRM
- 9.3
CMA / ARV
- ARV (median comp)
- $2,031,043
- List price
- $2,699,999
- Delta
- 32.94%
- Verdict
- OVERPRICED
- Comps
- 6 within 1.0 mi
Projected returns pro-forma
-3.0% appreciation · 3.0% rent growth · sell at horizon
- IRR
- -9.5%
- Equity multiple
- 0.65×
- Total profit
- $-262,401
- Equity at exit
- $402,579
- IRR
- -0.1%
- Equity multiple
- 0.99×
- Total profit
- $-5,801
- Equity at exit
- $233,447
Cash invested: $756,000 (down + closing). Projections, not guarantees.
Landlord ↔ Tenant lean methodology
- Overall (STATE)
- 18 Strongly Tenant-Friendly
- State California
- 18 Strongly Tenant-Friendly · D+13
- County
- — inherits STATE
- City
- — inherits STATE
ZIP-level market 90201
- Active inventory
- 55
- Price-to-rent
- 109.3×
Monthly cashflow live
- Estimated rent
- $24,289 high interval (Pro) →
- Mortgage (P&I)
- −$14,159
- Tax from tax record
- −$1,139 /mo · $13,667/yr
- Insurance
- −$1,125
- HOA
- −$0
- Vacancy / Maint / Mgmt
- −$5,101
- Net cashflow
- $2,765
Break-even live
12-unit breakdown (identical units grouped — click to expand)
| Units | Beds | Baths | Est. rent |
|---|---|---|---|
| 8× units | 2 | 1 | $16,464 |
| #1 | 2 | 1 | $2,058 |
| #2 | 2 | 1 | $2,058 |
| #3 | 2 | 1 | $2,058 |
| #4 | 2 | 1 | $2,058 |
| #5 | 2 | 1 | $2,058 |
| #6 | 2 | 1 | $2,058 |
| #7 | 2 | 1 | $2,058 |
| #8 | 2 | 1 | $2,058 |
| 4× units | 1 | 1 | $7,824 |
| #9 | 1 | 1 | $1,956 |
| #10 | 1 | 1 | $1,956 |
| #11 | 1 | 1 | $1,956 |
| #12 | 1 | 1 | $1,956 |
| Total (12 units) | $24,289 | ||
UW: 25.0% down · 7.5% · 30yr · 1.5% tax · 5.0% vac · 8.0% maint · 8.0% mgmt
Financing live
Cash to close
- Down payment
- $675,000
- Closing costs
- $81,000
- Reserves months
- —
- Total cash needed
- —
Loan-product check · same deal, 3 products live
Conventional
25% down · 7.5% · 30yr
- Down + closing
- —
- Monthly P&I
- —
- Monthly cashflow
- —
- DSCR
- —
- Eligible?
- —
Personal DTI + credit; lowest rate.
DSCR
20% down · 8.5% · 30yr
- Down + closing
- —
- Monthly P&I
- —
- Monthly cashflow
- —
- DSCR
- —
- Eligible?
- —
No personal income docs; deal must DSCR.
Hard money
10% down · 12.0% · 12mo
- Down + closing
- —
- Monthly P&I
- —
- Monthly cashflow
- —
- DSCR
- —
- Eligible?
- —
Short-term bridge; refi at stabilization.
Listing history 25 events
-
2026-06-18days on market $2,699,999 Active 192 DOM
-
2026-06-17days on market $2,699,999 Active 191 DOM
-
2026-06-16days on market $2,699,999 Active 190 DOM
-
2026-06-15days on market $2,699,999 Active 189 DOM
-
2026-06-13days on market $2,699,999 Active 187 DOM
-
2026-06-13days on market $2,699,999 Active 186 DOM
-
2026-06-09days on market $2,699,999 Active 183 DOM
-
2026-06-08days on market $2,699,999 Active 182 DOM
-
2026-06-07days on market $2,699,999 Active 181 DOM
-
2026-06-04days on market $2,699,999 Active 178 DOM
-
2026-06-03days on market $2,699,999 Active 177 DOM
-
2026-06-02days on market $2,699,999 Active 176 DOM
-
2026-06-01days on market $2,699,999 Active 175 DOM
-
2026-05-31days on market $2,699,999 Active 174 DOM
-
2025-12-08price $2,699,999 858-char remark
Show marketing remark (858 chars)
Attractive 12 unit multifamily property in the high demand Bell Gardens market. The mix includes (8) two bedroom one bath units and (4) one bedroom one bath units that rent well and stay occupied. Current income is $229,392 with market rents supporting $278,400 , giving buyers clear rent upside of about 21.4% . The building offers on site parking with carports, 4 garage spaces, and open spaces. Each unit is separately metered for electricity and gas. The on site laundry room generates about $400 per month in extra income. The layout and features make the property easy to run. Located near Eastern Avenue, Jaboneria Road, the 710 Freeway, and Florence Avenue, the property sits close to major retailers, services, and employment centers. Tenants benefit from quick access to shopping and transit, supporting long term demand in this proven rental area.
-
2025-12-08$26,999,999 Active 858-char remark
Show marketing remark (858 chars)
Attractive 12 unit multifamily property in the high demand Bell Gardens market. The mix includes (8) two bedroom one bath units and (4) one bedroom one bath units that rent well and stay occupied. Current income is $229,392 with market rents supporting $278,400 , giving buyers clear rent upside of about 21.4% . The building offers on site parking with carports, 4 garage spaces, and open spaces. Each unit is separately metered for electricity and gas. The on site laundry room generates about $400 per month in extra income. The layout and features make the property easy to run. Located near Eastern Avenue, Jaboneria Road, the 710 Freeway, and Florence Avenue, the property sits close to major retailers, services, and employment centers. Tenants benefit from quick access to shopping and transit, supporting long term demand in this proven rental area.
-
2025-11-21historical
-
2025-06-03$2,750,000 Active
-
2012-04-17historical
-
2011-10-19$1,275,000 Active
-
2001-08-16soldstatus $565,000
-
2001-07-15soldstatus $565,000
-
2001-03-16$579,000
-
1998-05-11soldstatus $92,000
-
1986-12-31soldstatus $475,000
ⓘ Source: listings_history table (triggers on properties + properties_extension) + one-shot
backfill from property_details.listing_events for pre-trigger history.
Tax reassessment forecast CA · Resets to sale price
- Current annual tax
- $13,667 · $1,139/mo
- Projected year-2 tax
- $20,520 · $1,710/mo
- Expected delta
- +$6,853/yr (+$571/mo · 50.1%)
ⓘ Screening estimate from a state-policy table — verify with the county assessor before closing.
Climate risk First Street
- Flood 6/10 Major FEMA zone X · 72% chance over 30 yrs
- Wildfire 1/10 Low
- Heat 5/10 Major 7 d/yr ≥92°F today · 21 d/yr by 30 yrs out
- Wind 1/10 Low
- Air quality 5/10 Major 9 unhealthy d/yr today · 9 by 30 yrs out
Nearby sold comps map
Loading sold comps map…
Walkable amenities ~0.75 mi
Loading nearby amenities…
Taxation est. · year 1
- Rental income
- $291,468
- − Mortgage interest
- −$151,242
- − Property taxes
- −$13,667
- − Insurance
- −$13,500
- − Repairs & maintenance
- −$23,317
- − Management
- −$23,317
- − Depreciation
- −$78,545
- Taxable loss
- −$12,121
- Est. tax savings @ 24.0%
- +$2,909
- After-tax cash flow
- $36,093/yr
For passive investors: Depreciation is non-cash, so a rental often shows a tax loss while cash-flowing — sheltering income. Rental losses are passive: they offset passive income freely, and up to $25,000/yr can offset ordinary (W-2) income if you actively participate and your MAGI is under $100k (phasing out to $0 by $150k); unused losses carry forward. On sale, claimed depreciation is recaptured at up to 25%, and gains may owe capital-gains tax (a 1031 exchange can defer both). Figures are a year-1 estimate at your 24.0% rate — not tax advice; consult a CPA.
Schools (NCES district)
- District
- Montebello Unified
- NCES district ID
- 0625470
- Math proficiency
- 17% ▼ -7.00%
- Reading proficiency
- 32% ▼ -5.00%
- Median HH income
- $45,250
- Composite
- 21.13/100
- National rank
- #8433
- State rank
- #419 of 517 in CA
Livability — Bell Gardens
- Score
- 65/100
- State rank
- #388
- US rank
- #13241
Category grades
Schools grade is shown separately in the Schools card above.
Census & demographics
- Census place
- Bell Gardens, CA
- County
- Los Angeles County · 9,444,647 people
- Metro
- Los Angeles-Long Beach-Anaheim, CA
- Population (ZIP)
- 92,763
- Household income
- $60,927
- Rent vs Own
- Severe rent burden
- 6155.0
Population outlook (Los Angeles County) Hauer SSP2
- Today (2025)
- 10,940,515 people
- By 2030
- 11,256,481 · +2.9%
- By 2040
- 11,729,929 · +7.2%
- By 2050
- 11,948,407 · +9.2%
- By 2075
- 11,818,114 · +8.0%
- By 2100
- 10,842,928 · -0.9%
Race, ethnicity, and origin ACS 2023
- Neighborhood character
- Predominantly Hispanic (94%)
- Race & ethnicity
- Hispanic / Latino 94% Two or more races 44% White 3% Black 1% Native American 1%
- Hispanic origin (detail)
- Mexican 77%
- Foreign-born
- 42% · Canada
- Languages at home
- 11% English-only · Spanish 87% Arabic 1%
Political lean MEDSL · Los Angeles
- 2024 margin
- Solid D (+32.9) · D 64.8% · R 31.9% · Other 3.3%
- 2008→2024 swing
- -7.4pp toward R · 2008: 40.4pp · 2024: 32.9pp
- All cycles
- 2024: D+32.9 2020: D+44.2 2016: D+48.0 2012: D+40.0 2008: D+40.4
Not yet ingested
- Civics
- —
Market trends
- HPI YoY
- ▼ -571.65%
- Current HPI
- 450.0128
- Rent YoY
- —
- Metro
- Los Angeles-Long Beach-Anaheim, CA
- State GDP YoY
- ▲ 3.21%
- F500 in state
- 116
Industry mix (Fortune 500 HQ in CA)
| Industry | F500 HQs | Revenue |
|---|---|---|
| Technology | 27 | $1,492B |
|
||
| Financial Services | 3 | $174B |
|
||
| Retail | 3 | $44B |
|
||
| Insurance | 3 | $26B |
|
||
| Media / Entertainment | 2 | $115B |
|
||
| Pharmaceuticals / Biotech | 2 | $62B |
|
||
Price history
+468.4% since first listed11 events — show timeline
- 2025-12-08 Price Changed $2,699,999 TheMLS
- 2025-12-08 Listed $26,999,999 TheMLS
- 2025-11-21 Listing Removed — CRMLS
- 2025-06-03 Listed $2,750,000 CRMLS
- 2012-04-17 Listing Removed — CRMLS
- 2011-10-19 Listed $1,275,000 CRMLS
- 2001-08-16 Sold (Public Records) $565,000 Public Records
- 2001-07-15 Sold (MLS) $565,000 CRMLS
- 2001-03-16 Listed $579,000 CRMLS
- 1998-05-11 Sold (Public Records) $92,000 Public Records
- 1986-12-31 Sold (Public Records) $475,000 Public Records
Property tax history
+1.4%/yrLatest (2025): $13,667 · +6.4% YoY. Source: county tax records.
Cash-flow waterfall
monthlySold comps — $/sqft
last 12 mo · ≤1 miLoading sold comps…