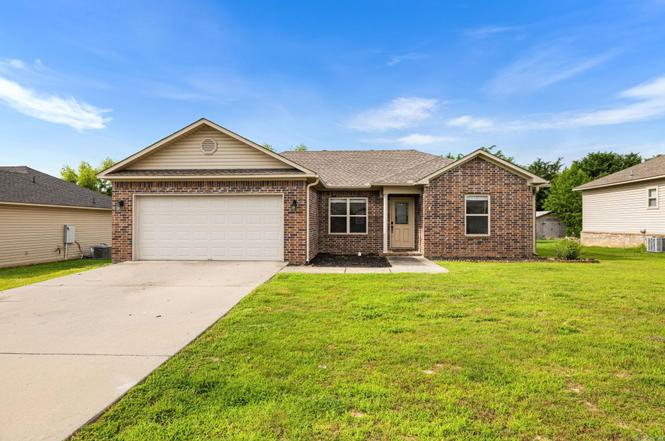
27 Mill Creek Dr · Ward, AR
Flood risk 1/10 · Minimal
- FEMA flood zone
- X (unshaded)
- Chance of flooding over 30 yrs
- 0.0%
- Est. flood insurance / yr
- $507 – $1,088
Fire risk 5/10 · Moderate
- Est. fire insurance / yr
- $1,499 – $2,785
Heat risk 6/10 · Moderate
- Hot days now (above 109°F)
- 7 days/yr
- Hot days in 30 yrs
- 18 days/yr
Wind risk 3/10 · Minor
- Chance of severe wind over 30 yrs
- 8.0%
Air-quality risk 2/10 · Minimal
- Unhealthy air days now
- 1 days/yr
- Unhealthy air days in 30 yrs
- 1 days/yr
Risk factors via First Street. Map © Google.
Why this score? — see what drove the F grade
The composite is a weighted blend of 9 inputs, each scored 0–100. Each bar is that input's sub-score; the figure is the points it added to the 100-point composite (weight × sub-score).
- Cash flow +9.5/30.0
- Appreciation +7.7/10.0
- Schools +4.0/10.0
- Livability +3.5/5.0
- DSCR +2.7/10.0
- Rent growth +2.5/5.0
- Condition / age +2.5/5.0
- 1% rule +1.9/10.0
- ARV discount +0.4/15.0
$230,000
🖨 Deal sheet (PDF) 📄 Offer letter ✓ Due diligence
Listing remarks MLS
Come see this great 4bd/2ba home! A large living area and open dining area. The kitchen has granite countertops, all stainless appliances and the refrigerator stays with the home. A separate laundry room and spacious garage. The master bedroom is separate from the other three. One of the bedrooms has countertops installed for use as a craft room or office but can easily be made back into a bedroom. A large back yard with a concrete patio, built in fire pit and above ground pool perfect for entertaining.
Key facts
- Concrete patio
- Built-in countertops
- Backyard retreat
Tags
Property features AI
Finance
- Financial info: Accepts VA, FHA, conventional and rural development loans, or cash
- HOA & community: Located in the Mill Creek Acres subdivision
Exterior
- Parking: 2-car garage with automatic door opener
- Utilities: Public water; Public sewer; Electric service via cooperative; Insulated windows; Insulated doors
- Home design: Brick and metal/vinyl siding exterior
- Construction: Architectural shingle roof; Slab foundation
- Exterior features: Patio; Above-ground pool; Guttering; Paved road access; Level lot in a subdivision
Interior
- Kitchen: Free-standing stove; Electric range; Microwave; Dishwasher; Garbage disposal; Pantry; Refrigerator remains
- Bedrooms: Walk-in closet(s) (bedroom features)
- Flooring: Carpet; Tile; Laminate
- Bathrooms: 2 full bathrooms
- Heating & cooling: Central electric heating; Central electric cooling
- Interior features: Washer connection; Electric dryer connection; Electric water heater; Smoke detectors; Walk-in closets; Ceiling fans; Granite slab kitchen counters
- Laundry & utility: Laundry room
Neighborhood map
What this means for you Summary
Snapshot
- This is a 4-bed/1.5-bath single-family listed at $230k.
Deal economics
- At list price, monthly cash flow is $-159 ($-2k/yr) — negative.
- To cash-flow at today's rent, offer at most $202k (12.2% below list).
- To meet the 1% rule (rent ≥ 1% of price), the offer needs to be $159k (30.7% below list).
- Recommended offer: $159k (30.7% below list) — sets the bar for 1% rule.
Location & tenants
- Location reads 69/100 on livability (#66 in AR) — a middle-class / working-renter tenant base. Strengths: cost of living A+, housing A+, crime B; Watch: amenities F, commute F.
- Cabot School District (suburban): math 48% / reading 43% proficiency, ranked #29 of 238 in AR (top 12%) — families likely to look elsewhere, expect single-tenant / working-renter base with shorter leases.
- Zoned schools: Ward Central Elementary (math 57% / reading 42%, grade D, #93 of 454 statewide, top 23%, 494 students, 62% FRL); Cabot Middle School North (math 52% / reading 41%, grade D+, #49 of 201 statewide, top 26%, 907 students, 42% FRL); Cabot High School (math 29% / reading 45%, grade F, #64 of 292 statewide, top 26%, 2,198 students, 36% FRL) — zoned schools average 47% FRL vs 30% district-wide (17 pts higher); higher-poverty schools than district average — tighter screening recommended.
- Market conditions: 156 active listings in the ZIP; 6 comparable units currently listed for rent nearby; rentals at typical pace (median 25d on market — plan ~3-4 weeks tenant-placement turnaround); 185 units permitted in Lonoke County in 2024 (0 in 5+ unit buildings).
Forward outlook
- In year one you build about $14k of equity ($2k loan paydown + $12k appreciation (5.3% local appreciation)).
- Lonoke County population projected at +12% by 2050 — modest demand growth; plan on rents tracking national, not racing it.
- By year 3, paydown + projected appreciation supports a ~$34k cash-out refi (75% LTV) — recoverable capital for the next deal without selling this one.
Negotiation context
- Only 12 days on market — expect competitive offers; lowballing is unlikely to land.
- 4 sale attempts since 10y ago with the ask held roughly flat each time — persistent listings suggest the price (not the market) is what's stuck; bring a comps-based counter.
- Current owner paid $157k; 46% above their basis — modest negotiation headroom, anchor on the comps not their cost.
Risks & watch-outs
- Climate carrying-cost: moderate wildfire risk; extreme-heat days projected 7→18/yr by 2055 (HVAC capex compounding) — expect insurance premiums to compound above CPI over the hold.
Questions for the listing agent
- What do current leases actually rent for vs. the listed asking? Can we see a recent rent roll and the last 12 months of T-12 income?
- Is there a deadline driving the sale (1031 exchange, divorce, estate, relocation)? That informs how much negotiation room exists.
- The area grade is low — what's the realistic commute time and amenity access for the typical tenant pool here? Any planned neighborhood developments (good or bad) we should know about?
- What's the average days-on-market for RENTAL listings here right now (not sales)? A rising rental-DOM trend means longer vacancies and softer asking-rent achievability than the comps imply.
- What's the recent tenant-quality profile in this submarket — average credit score on applications, eviction rate, late-payment / NSF rate, and stable-employment percentage? A property-management company in the area should have these aggregated.
- How much new for-sale + rental construction is in the pipeline within 1–3 miles? Heavy new supply typically softens prices + rents 12–24 months out; constrained supply supports both.
Investment metrics
- 1% rule
- 0.69% ✗
- Cap rate
- 5.46%
- Cash-on-cash
- -2.96%
- DSCR
- 0.87
- GRM
- 12.0
CMA / ARV
- ARV (on-the-fly)
- $198,650
- Comps found
- 12
Show comp detail 12 sales within ~0.75 mi
| Address | Dist | Beds/Ba | Sqft | Sold | Price | $/sf | Match |
|---|---|---|---|---|---|---|---|
| 10 Mill Creek Dr | 0.11mi | 3/2.0 (-1) | 1,347 (-2%) | 1mo | $205,000 | $152 | 85 |
| 710 Moon Rd | 0.22mi | 3/2.0 (-1) | 1,321 (-4%) | 4mo | $224,500 | $170 | 73 |
| 720 Moon Rd | 0.22mi | 3/2.0 (-1) | 1,321 (-4%) | 5mo | $224,500 | $170 | 73 |
| 480 Moonlight Graham Blvd | 0.37mi | 3/2.0 (-1) | 1,435 (+5%) | 5mo | $196,000 | $137 | 64 |
| 440 Moonlight Graham Blvd | 0.37mi | 3/2.0 (-1) | 1,280 (-7%) | 5mo | $185,000 | $145 | 61 |
| 460 Moonlight Graham Blvd | 0.35mi | 3/2.5 (-1) | 1,489 (+9%) | 1mo | $200,000 | $134 | 59 |
| 500 Moonlight Graham Blvd | 0.35mi | 3/2.5 (-1) | 1,489 (+9%) | 4mo | $211,000 | $142 | 57 |
| 7 Sunshine Ln | 0.65mi | 4/2.0 | 1,449 (+6%) | 4mo | $192,000 | $133 | 54 |
| 23 Moonridge Dr | 0.71mi | 3/2.0 (-1) | 1,242 (-9%) | 1mo | $180,000 | $145 | 43 |
| 3 Moonlight Cv | 0.67mi | 3/2.0 (-1) | 1,485 (+8%) | 9mo | $197,900 | $133 | 40 |
| 3 Sunrise Ln | 0.67mi | 3/2.0 (-1) | 1,198 (-13%) | 5mo | $189,900 | $159 | 37 |
| 1 Moon Ridge Dr | 0.73mi | 3/2.0 (-1) | 1,511 (+10%) | 6mo | $219,900 | $146 | 37 |
Match score weights: distance 35% · size 25% · config 20% · recency 20%. Top-matched comps best support the ARV.
Projected returns pro-forma
5.35% appreciation · 3.0% rent growth · sell at horizon
- IRR
- 11.3%
- Equity multiple
- 1.74×
- Total profit
- $47,504
- Equity at exit
- $135,320
- IRR
- 12.4%
- Equity multiple
- 3.33×
- Total profit
- $150,134
- Equity at exit
- $237,771
Cash invested: $64,400 (down + closing). Projections, not guarantees.
Landlord ↔ Tenant lean methodology
- Overall (STATE)
- 92 Strongly Landlord-Friendly
- State Arkansas
- 92 Strongly Landlord-Friendly · R+14
- County
- — inherits STATE
- City
- — inherits STATE
ZIP-level market 72176
- Home prices YoY
- 2.6%
- Active inventory
- 156
- Price-to-rent
- 12.0×
Monthly cashflow live
- Estimated rent
- $1,593 high interval (Pro) →
- Mortgage (P&I)
- −$1,206
- Tax from tax record
- −$116 /mo · $1,386/yr
- Insurance
- −$96
- HOA
- −$0
- Vacancy / Maint / Mgmt
- −$335
- Net cashflow
- $-159
Break-even live
Sensitivity live
| Price | -10% $-29 | -5% $-94 | +0% $-159 | +5% $-224 | +10% $-289 |
|---|---|---|---|---|---|
| Rent | -10% $-285 | -5% $-222 | +0% $-159 | +5% $-96 | +10% $-33 |
| Rate | -1.0pp $-43 | -0.5pp $-100 | base $-159 | +0.5pp $-218 | +1.0pp $-279 |
UW: 25.0% down · 7.5% · 30yr · 1.5% tax · 5.0% vac · 8.0% maint · 8.0% mgmt
Financing live
Cash to close
- Down payment
- $57,500
- Closing costs
- $6,900
- Reserves months
- —
- Total cash needed
- —
Loan-product check · same deal, 3 products live
Conventional
25% down · 7.5% · 30yr
- Down + closing
- —
- Monthly P&I
- —
- Monthly cashflow
- —
- DSCR
- —
- Eligible?
- —
Personal DTI + credit; lowest rate.
DSCR
20% down · 8.5% · 30yr
- Down + closing
- —
- Monthly P&I
- —
- Monthly cashflow
- —
- DSCR
- —
- Eligible?
- —
No personal income docs; deal must DSCR.
Hard money
10% down · 12.0% · 12mo
- Down + closing
- —
- Monthly P&I
- —
- Monthly cashflow
- —
- DSCR
- —
- Eligible?
- —
Short-term bridge; refi at stabilization.
Rent comps 6 comps
| Address | Beds | Baths | Sqft | Rent | $/sqft | DOM | Units | Dist |
|---|---|---|---|---|---|---|---|---|
| 12 Gold Meadows Loop Ward, AR | 3.0 | 2.0 | 1484 | $1,300 | $0.88 | 25d | 1 | 0.77mi |
| 65 Birchwood Dr Ward, AR | 3.0 | 2.0 | 1302 | $1,650 | $1.27 | 23d | 1 | 0.89mi |
| 21 Windsor Park Dr Ward, AR | 3.0 | 2.0 | 1442 | $1,500 | $1.04 | 25d | 1 | 0.93mi |
| 21 Weatherwood Ward, AR | 3.0 | 2.0 | 1156 | $1,300 | $1.12 | 25d | 1 | 1.26mi |
| 29 Green Apple Ward, AR | 3.0 | 2.0 | 1200 | $1,450 | $1.21 | 20d | 1 | 1.27mi |
| 23 Green Apple Ward, AR | 3.0 | 2.0 | 1212 | $1,450 | $1.20 | 25d | 1 | 1.28mi |
Listing history 8 events
-
2026-06-21days on market $230,000 Active 12 DOM
-
2026-06-18days on market $230,000 Active 9 DOM
-
2026-06-17days on market $230,000 Active 8 DOM
-
2026-06-16statusdays on market $230,000 Active 7 DOM
-
2026-06-15days on market $230,000 New Listing 6 DOM
-
2026-06-14days on market $230,000 New Listing 4 DOM
-
2026-06-10remarks 695-char remark
-
2026-06-10$230,000 New Listing 1 DOM
ⓘ Source: listings_history table (triggers on properties + properties_extension) + one-shot
backfill from property_details.listing_events for pre-trigger history.
Tax reassessment forecast AR · Resets to sale price
- Current annual tax
- $1,386 · $116/mo
- Projected year-2 tax
- $1,472 · $123/mo
- Expected delta
- +$86/yr (+$7/mo · 6.2%)
ⓘ Screening estimate from a state-policy table — verify with the county assessor before closing.
Climate risk First Street
- Flood 1/10 Low FEMA zone X (unshaded) · 0% chance over 30 yrs
- Wildfire 5/10 Major
- Heat 6/10 Major 7 d/yr ≥109°F today · 18 d/yr by 30 yrs out
- Wind 3/10 Moderate 8% chance of damaging wind over 30 yrs
- Air quality 2/10 Low 1 unhealthy d/yr today · 1 by 30 yrs out
Nearby sold comps map
Loading sold comps map…
Walkable amenities ~0.75 mi
Loading nearby amenities…
Taxation est. · year 1
- Rental income
- $19,120
- − Mortgage interest
- −$12,884
- − Property taxes
- −$1,386
- − Insurance
- −$1,150
- − Repairs & maintenance
- −$1,530
- − Management
- −$1,530
- − Depreciation
- −$6,691
- Taxable loss
- −$6,049
- Est. tax savings @ 24.0%
- +$1,452
- After-tax cash flow
- $-453/yr
For passive investors: Depreciation is non-cash, so a rental often shows a tax loss while cash-flowing — sheltering income. Rental losses are passive: they offset passive income freely, and up to $25,000/yr can offset ordinary (W-2) income if you actively participate and your MAGI is under $100k (phasing out to $0 by $150k); unused losses carry forward. On sale, claimed depreciation is recaptured at up to 25%, and gains may owe capital-gains tax (a 1031 exchange can defer both). Figures are a year-1 estimate at your 24.0% rate — not tax advice; consult a CPA.
Schools (NCES district)
- District
- Cabot School District
- NCES district ID
- 0503750
- Math proficiency
- 48% ▼ -14.00%
- Reading proficiency
- 43% ▼ -10.00%
- Median HH income
- $55,993
- Composite
- 39.66/100
- National rank
- #3912
- State rank
- #29 of 238 in AR
Livability — Ward
- Score
- 69/100
- State rank
- #66
- US rank
- #8464
Category grades
Schools grade is shown separately in the Schools card above.
Census & demographics
- Census place
- Ward, AR
- County
- Lonoke County · 46,130 people
- City population
- 8,678
- Metro
- Little Rock-North Little Rock-Conway, AR
- Population (ZIP)
- 8,678
- Household income
- $68,840
- Rent vs Own
- Severe rent burden
- 90.0
Population outlook (Lonoke County) Hauer SSP2
- Today (2025)
- 78,072 people
- By 2030
- 80,673 · +3.3%
- By 2040
- 84,977 · +8.8%
- By 2050
- 87,778 · +12.4%
- By 2075
- 91,398 · +17.1%
- By 2100
- 87,858 · +12.5%
Race, ethnicity, and origin ACS 2023
- Neighborhood character
- Predominantly White (85%)
- Race & ethnicity
- White 85% Two or more races 7% Hispanic / Latino 6% Black 2% Asian 1%
- Hispanic origin (detail)
- Mexican 2%
- Common ancestry
- Russian 2% Iranian 1% Slovak 1%
- Foreign-born
- 2% · Canada
- Languages at home
- 95% English-only · Spanish 3% Tagalog/Filipino 1% German/W. Germanic 1%
Political lean MEDSL · Lonoke
- 2024 margin
- Solid R (+53.7) · D 22.2% · R 75.8% · Other 2.0%
- 2008→2024 swing
- -6.2pp toward R · 2008: -47.5pp · 2024: -53.7pp
- All cycles
- 2024: R+53.7 2020: R+52.8 2016: R+53.3 2012: R+50.9 2008: R+47.5
Not yet ingested
- Civics
- —
Market trends
- HPI YoY
- ▲ 5.35%
- Current HPI
- 208.9387
- Rent YoY
- —
- Metro
- Little Rock-North Little Rock-Conway, AR
- State GDP YoY
- ▲ 3.80%
- F500 in state
- 10
Industry mix (Fortune 500 HQ in AR)
| Industry | F500 HQs | Revenue |
|---|---|---|
| Retail | 1 | $681B |
|
||
| Food / Agriculture | 1 | $53B |
|
||
| Retail / Energy | 1 | $22B |
|
||
| Transportation / Logistics | 1 | $12B |
|
||
| Energy | 1 | $4B |
|
||
Price history
+67.9% since first listed13 events — show timeline
- 2026-06-09 Listed $230,000 CARMLS
- 2020-11-18 Sold (Public Records) $157,000 Public Records
- 2020-11-14 Pending — CARMLS
- 2020-11-13 Sold (MLS) $157,000 CARMLS
- 2020-10-07 Contingent — CARMLS
- 2020-10-05 Listed $150,000 CARMLS
- 2017-03-02 Sold (Public Records) $131,000 Public Records
- 2017-02-24 Sold (MLS) $131,000 CARMLS
- 2017-01-19 Pending — CARMLS
- 2017-01-12 Price Changed $136,500 CARMLS
- 2016-12-22 Listed $137,000 CARMLS
- 2016-12-16 Listing Removed — CARMLS
- 2016-08-31 Listed $137,000 CARMLS
Property tax history
+25.5%/yrLatest (2025): $1,386 · +0.0% YoY. Source: county tax records.
Cash-flow waterfall
monthlySold comps — $/sqft
last 12 mo · ≤1 miLoading sold comps…