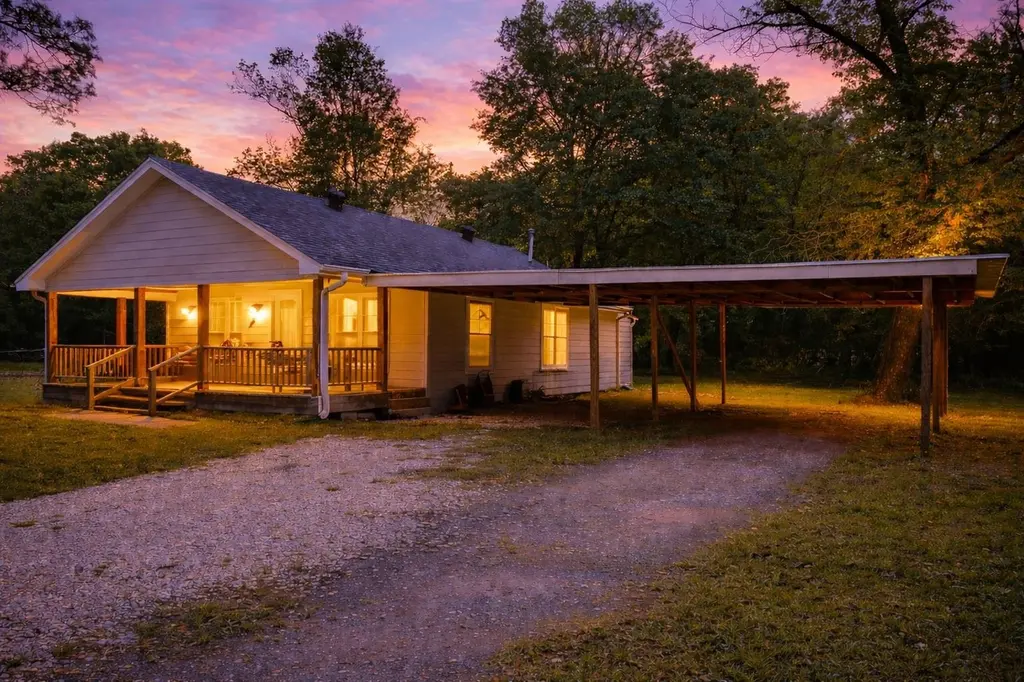
705 Moreland St · Vidor, TX
Flood risk 7/10 · Major
- FEMA flood zone
- X (shaded)
- Chance of flooding over 30 yrs
- 0.99%
- Est. flood insurance / yr
- $507 – $1,088
Fire risk 4/10 · Minor
- Est. fire insurance / yr
- $1,222 – $2,270
Heat risk 9/10 · Severe
- Hot days now (above 110°F)
- 7 days/yr
- Hot days in 30 yrs
- 23 days/yr
Wind risk 9/10 · Severe
- Chance of severe wind over 30 yrs
- 99.0%
Air-quality risk 2/10 · Minimal
- Unhealthy air days now
- 1 days/yr
- Unhealthy air days in 30 yrs
- 1 days/yr
Risk factors via First Street. Map © Google.
Why this score? — see what drove the D grade
The composite is a weighted blend of 9 inputs, each scored 0–100. Each bar is that input's sub-score; the figure is the points it added to the 100-point composite (weight × sub-score).
- Cash flow +19.2/30.0
- DSCR +6.0/10.0
- 1% rule +5.3/10.0
- Schools +3.4/10.0
- Livability +3.4/5.0
- ARV discount +2.6/15.0
- Rent growth +2.5/5.0
- Condition / age +2.5/5.0
- Appreciation +0.0/10.0
$135,000
🖨 Deal sheet 📄 Offer letter ✓ Due diligence
Listing remarks MLS
This beautifully remodeled 2-bedroom, 2-bath charmer sits on half an acre! Inside you'll find a fresh, updated interior with stylish finishes that make the home feel both cozy and modern. The open-concept living area is filled with natural light, creating a welcoming space to relax or entertain. The kitchen shines with sleek countertops. Outside, you'll love the expansive yard, plenty of room for gardening, play, or simply enjoying the great outdoors. Whether you're looking for your first home, a place to downsize, or maybe even a home to add to your rental portfolio, this one checks all the boxes. Come see it for yourself and imagine the possibilities!
Key facts
- Remodeled
- Expansive yard
- Sleek countertops
Tags
Neighborhood map
What this means for you Summary
Snapshot
- This is a 2-bed/2.0-bath single-family listed at $135k.
Deal economics
- At list price, monthly cash flow is $78 ($940/yr) — positive.
- The deal already cash-flows at list — no discount required.
- Meets the 1% rule at list price ($1k rent vs $135k).
- Recommended offer: $131k (3.0% below list) — sets the bar for market timing.
- Cap rate 7.6% vs local median 4.6% in Vidor — top-decile yield for the area; either an underpriced asset or a hidden risk that comps aren't pricing in. Stress-test before assuming the spread holds.
Location & tenants
- Location reads 67/100 on livability (#576 in TX) — a middle-class / working-renter tenant base. Strengths: cost of living A+, housing A+, crime B; Watch: schools D-, amenities F, commute F.
- Vidor ISD (suburban): math 41% / reading 39% proficiency, ranked #422 of 826 in TX (top 51%) — families likely to look elsewhere, expect single-tenant / working-renter base with shorter leases.
- Market conditions: 241 active listings in the ZIP; 6 comparable units currently listed for rent nearby; rentals leasing fast (median 14d on market — plan ~1-2 weeks tenant-placement turnaround); 235 units permitted in Orange County in 2024 (50 in 5+ unit buildings).
Forward outlook
- Local home prices are declining (-3.0%/yr); year-one equity from $933 of loan paydown is wiped out by about $4k of value loss. Plan a longer hold.
- Orange County population projected at +6% by 2050 — modest demand growth; plan on rents tracking national, not racing it.
Negotiation context
- It's been on market 47 days — a 3% lower offer ($131k) is reasonable based on typical stale-listing flexibility.
- 5 sale attempts since 2y ago with the ask held roughly flat each time — persistent listings suggest the price (not the market) is what's stuck; bring a comps-based counter.
Risks & watch-outs
- Watch-outs: flood insurance adds $66/mo; built in 1940 — expect roof / HVAC / electrical / plumbing capex.
- Climate carrying-cost: major flood risk; severe wind risk, 99% chance of damaging wind over 30y; extreme-heat days projected 7→23/yr by 2055 (HVAC capex compounding) — expect insurance premiums to compound above CPI over the hold.
Questions for the listing agent
- It's been on market 47 days. Have you received any prior offers? Is the seller open to a 3% concession, seller financing, or rate buy-down credit?
- Built in 1940 — when were the roof, HVAC, electrical panel, plumbing, and water heater last replaced?
- What's the actual annual flood-insurance premium (NFIP or private), and is the property in a SFHA with mandatory coverage?
- Is there a deadline driving the sale (1031 exchange, divorce, estate, relocation)? That informs how much negotiation room exists.
- Schools are D-rated, which usually means shorter tenancies and higher turnover. Who's the typical renter profile here, and what's been the actual vacancy rate?
- The area grade is low — what's the realistic commute time and amenity access for the typical tenant pool here? Any planned neighborhood developments (good or bad) we should know about?
- What's the average days-on-market for RENTAL listings here right now (not sales)? A rising rental-DOM trend means longer vacancies and softer asking-rent achievability than the comps imply.
- What's the recent tenant-quality profile in this submarket — average credit score on applications, eviction rate, late-payment / NSF rate, and stable-employment percentage? A property-management company in the area should have these aggregated.
- How much new for-sale + rental construction is in the pipeline within 1–3 miles? Heavy new supply typically softens prices + rents 12–24 months out; constrained supply supports both.
Investment metrics
- 1% rule
- 1.03% ✓
- Cap rate
- 7.58%
- Cash-on-cash
- 4.60%
- DSCR
- 1.20
- GRM
- 8.1
CMA / ARV
- ARV (median comp)
- $121,641
- List price
- $135,000
- Delta
- 10.98%
- Verdict
- OVERPRICED
- Comps
- 10 within 1.0 mi
Projected returns pro-forma
-3.0% appreciation · 3.0% rent growth · sell at horizon
- IRR
- -12.3%
- Equity multiple
- 0.56×
- Total profit
- $-16,808
- Equity at exit
- $20,129
- IRR
- -3.1%
- Equity multiple
- 0.79×
- Total profit
- $-7,898
- Equity at exit
- $11,672
Cash invested: $37,800 (down + closing). Projections, not guarantees.
Landlord ↔ Tenant lean methodology
- Overall (STATE)
- 87 Strongly Landlord-Friendly
- State Texas
- 87 Strongly Landlord-Friendly · R+5
- County
- — inherits STATE
- City
- — inherits STATE
ZIP-level market 77662
- Active inventory
- 241
- Price-to-rent
- 8.1×
Monthly cashflow live
- Estimated rent
- $1,394 high interval (Pro) →
- Mortgage (P&I)
- −$708
- Tax from tax record
- −$192 /mo · $2,309/yr
- Insurance
- −$56
- Flood insurance flood zone
- −$66 /mo · $798/yr
- HOA
- −$0
- Vacancy / Maint / Mgmt
- −$293
- Net cashflow
- $78
Break-even live
UW: 25.0% down · 7.5% · 30yr · 1.5% tax · 5.0% vac · 8.0% maint · 8.0% mgmt
Financing live
Cash to close
- Down payment
- $33,750
- Closing costs
- $4,050
- Reserves months
- —
- Total cash needed
- —
Loan-product check · same deal, 3 products live
Conventional
25% down · 7.5% · 30yr
- Down + closing
- —
- Monthly P&I
- —
- Monthly cashflow
- —
- DSCR
- —
- Eligible?
- —
Personal DTI + credit; lowest rate.
DSCR
20% down · 8.5% · 30yr
- Down + closing
- —
- Monthly P&I
- —
- Monthly cashflow
- —
- DSCR
- —
- Eligible?
- —
No personal income docs; deal must DSCR.
Hard money
10% down · 12.0% · 12mo
- Down + closing
- —
- Monthly P&I
- —
- Monthly cashflow
- —
- DSCR
- —
- Eligible?
- —
Short-term bridge; refi at stabilization.
Rent comps 6 comps
| Address | Beds | Baths | Sqft | Rent | $/sqft | DOM | Units | Dist |
|---|---|---|---|---|---|---|---|---|
| 575 Moreland St Vidor, TX | 3.0 | 1.5 | 1418 | $1,395 | $0.98 | 13d | 1 | 0.14mi |
| 290 Beach St Vidor, TX | 3.0 | 1.5 | 1000 | $1,550 | $1.55 | 13d | 1 | 0.44mi |
| 240 Mill St Unit B Vidor, TX | 1.0 | 1.0 | 880 | $995 | $1.13 | 13d | 1 | 0.59mi |
| 315 N Dwayne Cir Vidor, TX | 3.0 | 1.5 | 1040 | $1,600 | $1.54 | 21d | 1 | 1.13mi |
| 475 S Denver St Vidor, TX | 2.0–3.0 | 1.0 | 910 | $850 | $0.93 | 43d | 2 | 1.33mi |
| 475 S Denver St Unit St216 Vidor, TX | 2.0 | 1.0 | 880 | $850 | $0.97 | 13d | 1 | 1.33mi |
Listing history 19 events
-
2026-06-07statusdays on market $135,000 Pending 47 DOM
-
2026-06-03days on market $135,000 Active 43 DOM
-
2026-06-02days on market $135,000 Active 42 DOM
-
2026-06-01days on market $135,000 Active 41 DOM
-
2026-05-31days on market $135,000 Active 40 DOM
-
2026-05-30days on market $135,000 Active 39 DOM
-
2026-04-21$135,000 Active 661-char remark
Show marketing remark (661 chars)
This beautifully remodeled 2-bedroom, 2-bath charmer sits on half an acre! Inside you'll find a fresh, updated interior with stylish finishes that make the home feel both cozy and modern. The open-concept living area is filled with natural light, creating a welcoming space to relax or entertain. The kitchen shines with sleek countertops. Outside, you'll love the expansive yard, plenty of room for gardening, play, or simply enjoying the great outdoors. Whether you're looking for your first home, a place to downsize, or maybe even a home to add to your rental portfolio, this one checks all the boxes. Come see it for yourself and imagine the possibilities!
-
2026-02-26historical
-
2025-09-02$135,000 Active
-
2025-04-03price $135,000
-
2025-03-06historical $1,350
-
2025-02-21$1,350
-
2024-01-13historical $1,300
-
2024-01-11$1,300
-
2024-01-11historical $1,300
-
2024-01-05$1,300
-
2023-08-08soldstatus
-
2022-01-14soldstatus
-
2008-04-10soldstatus
ⓘ Source: listings_history table (triggers on properties + properties_extension) + one-shot
backfill from property_details.listing_events for pre-trigger history.
Tax reassessment forecast TX · Resets to sale price
- Current annual tax
- $2,309 · $192/mo
- Projected year-2 tax
- $2,470 · $206/mo
- Expected delta
- +$162/yr (+$13/mo · 7.0%)
ⓘ Screening estimate from a state-policy table — verify with the county assessor before closing.
Climate risk First Street
- Flood 7/10 Severe FEMA zone X (shaded) · 99% chance over 30 yrs
- Wildfire 4/10 Moderate
- Heat 9/10 Extreme 7 d/yr ≥110°F today · 23 d/yr by 30 yrs out
- Wind 9/10 Extreme 99% chance of damaging wind over 30 yrs
- Air quality 2/10 Low 1 unhealthy d/yr today · 1 by 30 yrs out
Nearby sold comps map
Loading sold comps map…
Walkable amenities ~0.75 mi
Loading nearby amenities…
Taxation est. · year 1
- Rental income
- $16,730
- − Mortgage interest
- −$7,562
- − Property taxes
- −$2,309
- − Insurance
- −$1,472
- − Repairs & maintenance
- −$1,338
- − Management
- −$1,338
- − Depreciation
- −$3,927
- Taxable loss
- −$1,217
- Est. tax savings @ 24.0%
- +$292
- After-tax cash flow
- $1,233/yr
For passive investors: Depreciation is non-cash, so a rental often shows a tax loss while cash-flowing — sheltering income. Rental losses are passive: they offset passive income freely, and up to $25,000/yr can offset ordinary (W-2) income if you actively participate and your MAGI is under $100k (phasing out to $0 by $150k); unused losses carry forward. On sale, claimed depreciation is recaptured at up to 25%, and gains may owe capital-gains tax (a 1031 exchange can defer both). Figures are a year-1 estimate at your 24.0% rate — not tax advice; consult a CPA.
Schools (NCES district)
- District
- Vidor ISD
- NCES district ID
- 4844160
- Math proficiency
- 41% ▼ -6.00%
- Reading proficiency
- 39% ▲ 1.00%
- Median HH income
- $44,169
- Composite
- 33.95/100
- National rank
- #5331
- State rank
- #422 of 826 in TX
Livability — Vidor
- Score
- 67/100
- State rank
- #576
- US rank
- #11001
Category grades
Schools grade is shown separately in the Schools card above.
Census & demographics
- Census place
- Vidor, TX
- County
- Orange County · 87,112 people
- City population
- 25,041
- Metro
- Beaumont-Port Arthur, TX
- Population (ZIP)
- 25,041
- Household income
- $72,243
- Rent vs Own
- Severe rent burden
- 401.0
Population outlook (Orange County) Hauer SSP2
- Today (2025)
- 88,065 people
- By 2030
- 89,591 · +1.7%
- By 2040
- 91,982 · +4.4%
- By 2050
- 93,023 · +5.6%
- By 2075
- 94,871 · +7.7%
- By 2100
- 88,155 · +0.1%
Race, ethnicity, and origin ACS 2023
- Neighborhood character
- Predominantly White (88%)
- Race & ethnicity
- White 88% Hispanic / Latino 6% Two or more races 6%
- Hispanic origin (detail)
- Mexican 5%
- Common ancestry
- Lithuanian 15% Slovak 1% Italian 1%
- Foreign-born
- 3% · Canada
- Languages at home
- 93% English-only · Spanish 4% Other Indo-European 1% Other Asian/Pacific 1%
Political lean MEDSL · Orange
- 2024 margin
- Solid R (+66.8) · D 16.4% · R 83.1%
- 2008→2024 swing
- -19.6pp toward R · 2008: -47.1pp · 2024: -66.8pp
- All cycles
- 2024: R+66.8 2020: R+63.4 2016: R+61.9 2012: R+54.3 2008: R+47.1
Not yet ingested
- Civics
- —
Market trends
- HPI YoY
- ▼ -116.46%
- Current HPI
- 141.0844
- Rent YoY
- —
- Metro
- Beaumont-Port Arthur, TX
- State GDP YoY
- ▲ 3.95%
- F500 in state
- 110
Industry mix (Fortune 500 HQ in TX)
| Industry | F500 HQs | Revenue |
|---|---|---|
| Energy | 16 | $1,198B |
|
||
| Technology | 5 | $198B |
|
||
| Engineering / Construction | 4 | $72B |
|
||
| Energy Services | 3 | $60B |
|
||
| Utilities | 3 | $41B |
|
||
| Healthcare | 2 | $330B |
|
||
Price history
+10284.6% since first listed13 events — show timeline
- 2026-04-21 Listed $135,000 BBOR
- 2026-02-26 Listing Removed — HARMLS
- 2025-09-02 Listed $135,000 HARMLS
- 2025-04-03 Price Changed $135,000 BBOR
- 2025-03-06 Rental Removed $1,350 BUILDIUM
- 2025-02-21 Listed for Rent $1,350 BUILDIUM
- 2024-01-13 Rental Removed $1,300 BUILDIUM
- 2024-01-11 Listed for Rent $1,300 BUILDIUM
- 2024-01-11 Rental Removed $1,300 BBOR
- 2024-01-05 Listed for Rent $1,300 BBOR
- 2023-08-08 Sold (Public Records) — Public Records
- 2022-01-14 Sold (Public Records) — Public Records
- 2008-04-10 Sold (Public Records) — Public Records
Property tax history
+9.9%/yrLatest (2025): $2,309 · +30.7% YoY. Source: county tax records.
Cash-flow waterfall
monthlySold comps — $/sqft
last 12 mo · ≤1 miLoading sold comps…